|
|
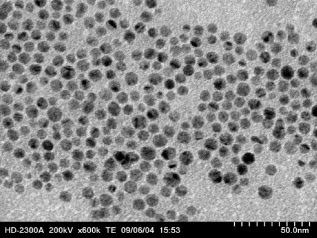
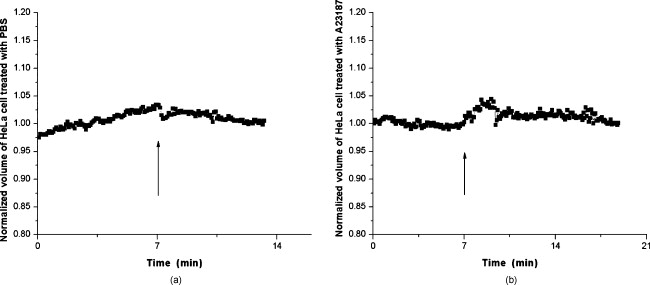
1.IntroductionDegranulation in a mast cell is a pivotal process activated by antigens or some other secretagogues. After activation, granules inside a mast cell move toward the cell membrane and fuse with it, then secretory pores are formed and the inflammation mediators such as histamine are released. During this process, the cell membrane undergoes significant deformation from a smooth surface with integrity to a bubbly and swollen state.1 Conventional methods used to study the degranulation process in a cell are imaging with electron microscopy (EM),2, 3 phase contrast, or differential interference contrast (DIC) microscopy,1 or they measure mediators (e.g., histamine or hexosaminidase) in supernatant with high performance liquid chromatography (HPLC) or fluorescence spectrophotometers.3, 4, 5 Though EM can provide the detailed structure of a granule and its variation during a degranulation process, it is impossible to observe the dynamic process of degranulation in a live cell with EM. Time-consuming sample preparation is another drawback in cell imaging with EM. Due to the small size of a granule (normally less than in diameter), it is difficult to observe it with a conventional optical microscope such as a phase contrast or DIC microscope. With the help of weakly basic fluorescent probes such as acridine orange or quinacrine, which can incorporate selectively into low-pH granules, the secretory processes of exocytosis in a mast cell could be visualized with fluorescent microscopy.6, 7 Recently, a new method combining atomic force microscopy (AFM) and laser scanning confocal microscopy was developed for characterizing 3-D structures of membrane and actin rearrangement during the degranulation process of a primary mast cell.8 Although impressive results are shown with these methods, a sample should be fixed for AFM, and an exogenous probe has to be introduced for fluorescent microscopy. Moreover, phototoxicity and photobleaching are also major limitations in live-cell fluorescence microscopy. Quantitative phase microscopy (QPM) is a new full-field imaging technique for the visualization of transparent objects that utilizes phase shifts induced by the combination of the refractive index and the thickness of a transparent object. This technique can retrieve a quantitative phase image with subnanometer path length sensitivity from a single interferogram measurement. This makes it possible to measure the volume variation of a live cell within a millisecond time scale, depending only on the frame rate of a charge-coupled device (CCD), which is suitable for observation of cell morphology and dynamics.9 We propose QPM as a new powerful method to observe degranulation processes in a cell without the need of complicated fluorescence labeling or sample fixation processes. We have demonstrated that the detailed process of degranulation can be monitored effectively by measuring the volume changes of a cell with QPM. Calcium ionophore A23187 is a well known degranulation stimulus for a mast cell.10, 11 Volume changes for a HeLa cell and an RBL-2H3 cell are measured before and after they are exposed to either A23187 or phosphate buffered saline (PBS). By monitoring the volume and the cross sectional profile of an RBL-2H3 cell, we have verified that only RBL-2H3 cells undergo the degranulation process upon exposure to A23187. It has been lately reported that silver can induce mast cells to release histamine.12, 13, 14 The process of how a silver ion makes mast cells degranulate was reported via reactive oxygen species (ROS) production and increment.12, 15 Even though there have been a lot of studies on the interaction between AgNP and live cells, most of them shed light only on the antibacterial effects of AgNP.16, 17, 18, 19 To our knowledge, no one has reported the effect of AgNP on the degranulation process of mast cells. It was recently shown that AgNP can produce ROS in a size-dependent manner in alveolar macrophages.20 This result is in accordance with other studies and indicates that ROS are important mediators generated in cells by AgNP.21, 22 Based on these results, we suspected that, besides antibacterial effects, AgNP can stimulate RBL-2H3 cells to degranulate because of the linkage between ROS and degranulation. We have proved this hypothesis by measuring changes in the cell volumes and the cross sectional line profiles of an RBL-2H3 cell after it is exposed to AgNP. Our measurement results indicate that RBL-2H3 cells can be stimulated to follow degranulation by AgNP. To verify this conclusion, histamine release from AgNP-treated RBL-2H3 cells was confirmed, and their time sequence images of fluorescent intensities were observed using fluorescent microscopy. 2.Materials and Methods2.1.Cell Culture and PreparationRBL-2H3 and HeLa cells (both from ATCC Company, USA) were grown in minimal essential medium (MEM) with Earle’s salt and Dulbecco’s Modified Eagles Medium (DMEM), respectively, supplemented with 10% fetal bovine serum and 2% L-glutamine (all from Gibco, USA) in an incubator with a humidified atmosphere (5% ) at . Cells were seeded on coverslips at an appropriate density before the imaging experiment. A23187 was purchased from Sigma (Saint Louis, Missouri) and dissolved in DMSO first, then diluted with PBS to prepare the stock solution (the maximal concentration of dimethyl sulfoxide (DMSO) ). AgNP (SARPU , 5% in water) was purchased from ABC Nanotech, Korea, and 50-fold diluted in water to prepare the of stock solution. 2.2.Cell Volume, Surface Area, and Cross Sectional Profile Measurements with Quantitative Phase MicroscopyWe have used a QPM setup, which is same as the one used in our previous paper.9 As is shown in the schematic diagram in Fig. 1 , it consists of a monochromatic laser source , an inverted microscope system (IX51, Olympus), and a CCD (IPX-VGA210-L, Imperx Incorporated). A sample was imaged on the first image plane through a objective lens. A transmission grating (G) is placed on the first image plane to create a common path interferometer utilizing the zero-order and first-order diffraction beams. High frequency conponents of the zero-order beam are filtered out with a pinhole to generate a reference light in the interferometer. The low-pass filtered zero-order beam and the first-order beam are interfered on the second image plane of the setup, and a CCD is used to take spatial interferogram data. Two lenses L2 and L3 form a 4f system with magnification. The other two lenses L4 and L5 form another 4f system with fives times the magnification. The final optical magnification of a sample at the CCD plane is calibrated to be about 50 for our case. The CCD has a frame rate of at a full resolution of . The pixel-to-pixel distance of the CCD is . The cross correlation interferogram of a cell in the spatial domain is measured. The spatial interferogram can be generally expressed as where and are the irradiance in the reference arm and the sample arm, respectively. and are the constant spatial frequency offsets of the interferogram with respect to the and axes, and is the optical phase through a sample. After using the high frequency filtering and the Hilbert transformation of a measured interferogram, the quantitative phase of a sample can be obtained easily. This transverse phase profile can be converted into the thickness profile of a sample, assuming that the refractive index of the sample is known. The major problem in calculating a cell volume is that the surrounding area around a cell has nonzero contribution in volume measurement. To eliminate this surrounding background effect in volume measurement, we need to calculate the volume integral only within the cell boundary. For accurate volume measurement of a cell, we have adapted a standard edge detection scheme to quantitative phase images.9 Cell volume is calculated by integrating 2-D thickness data within a cell boundary obtained from an edge detection technique. Thickness data are obtained assuming that the refractive index of the cell and medium are 1.40 and 1.33, respectively.RBL-2H3 cells on a coverslip were washed three times with PBS buffer and then sealed tightly in a special chamber filled with PBS (Gibco, Invitrogen, Carlsbad, California). With this chamber, we can take images while various chemicals are injected into the chamber with syringe pumps (KDScientific, Holliston, Massachusetts). After the chamber was mounted on the microscopy stage, images of a cell without any treatment (“blank”) were captured every for . Then of PBS was injected into the chamber within , and images were taken continuously for another with an interval of . The same process was performed again by replacing PBS with A23187 (the final concentration of ) or AgNP (the final concentration of ) for if not specified. The measured volume of a cell at each time point was divided by the average volume of a “blank” period for normalization. The corresponding cell surface area was normalized with the same method. To further validate the linkage of cell volume and degranulation, we replaced PBS in the cell chamber with DPBS (Gibco) plus of ethylenediaminetetraacetic acid tetra sodium salt dihydrate (EDTA) (Sigma, Saint Louis, Missouri), and repeated the volume measurement of RBL-2H3 cells treated with A23187 or AgNP. The transmission electron microscopy (TEM) image of AgNP used in our study was shown in Fig. 2 . 2.3.Fluorescent Imaging of Intracellular Calcium Concentration ChangesRBL-2H3 cells on a coverslip were washed with PBS buffer and then incubated with Fluo-3/AM (Molecular Probe, Invitrogen) at for . After washing three times, these stained cells were sealed in a chamber for fluorescence microscpy measurements. Procedures to inject AgNP into a sample are the same as those used in QPM experiments. Fluorescence images of were acquired by a fluorescence microscope with a objective lens (IX-51, Olympus, Japan). Blue light filtered from an attached mercury lamp in our microscope was selected for excitation. Fluorescence signals were recorded by an attached CCD detector (Retiga EXi FAST 1394, Qimage) with a bandpass filter. In this study, we captured a series of fluorescence images of every over , each using an exposure time of , and then processed with the Image-Pro Plus (version 5.1) software (Media Cybernetics, Bethesda, Maryland). 2.4.Histamine MeasurementHistamine release from RBL-2H3 cells was measured with the method described in Ref. 4 with slight modification. Briefly, cells were seeded in a 96-well plate to reach 80% confluence and were washed with Hank’s buffer. Then, of Hank’s buffer, AgNP , or A23187 (four wells for each group) was added, respectively. After the indicated time of treatment, supernatants were collected and reacted with a highly specific reagent, ortho-pthaldialdehyde (OPA, Sigma, Saint Louis, Missouri) ( , ) for another to determine the histamine content in supernatants (supernatant). The fluorescence intensity of the supernatant was measured at the excitation/emission wavelength of with a microplate spectrofluorometer (Spectramax XS, Molecular Devices, Silicon Valley, California). Cells from another four wells in parallel were lyzed with 0.1% Triton X-100, and the total histamine content of extracts was measured (total). The percentage of histamine released into the supernatant was calculated by using the following formula: . 2.5.Statistical AnalysisFluorescence intensities of OPA-histamine complex in each group were expressed as error of the mean (SEM). Statistical comparisons between treated groups and the control one were determined by using one-way analysis of variance (ANOVA), and significant difference was accepted when . 3.Results3.1.Volume, Surface Area, and Cross Sectional Profile Changes of an RBL-2H3 Cell by A23187We have monitored the volume of a representative RBL-2H3 cell using QPM without any treatment (blank). The volume of the RBL-2H3 cell changes very little within of its mean value, and it shows that the speed of volume change is very slow unless it undergoes a degranulation process. Figure 3 illustrates the volume variation of the RBL-2H3 cell before and after A23187 was injected into the chamber with many RBL-2H3 cells. The cell volume is normalized by its mean value taken from before the cell is exposed to the degranulation stimulus A23187. A23187 is added at around , and the exact addition time point is indicated with a small arrow. The normalized volume of the RBL-2H3 cell increases sharply to the peak value (about 20% increment) just after the addition of A23187, then it decreases slightly later. Figure 3 displays changes in the surface area of the RBL-2H3 cell sample on the addition of A23187. It shows that variations in the surface area of the cell follow similar patterns to those in the cell volume shown in Fig. 3. Figure 3 shows actual phase images for the RBL-2H3 cell at , 7, 9, 13, 17, and . The total magnification for these images was . Cross sectional line profiles of the cell at different time points across the white dashed line in the upper left phase image of Fig. 3 are shown in Fig. 3. Although the shapes of line profiles at and look very similar, the peak height in the line profile at is a little bit higher. We can see that another peak appeared on the left side of the original peak in the line profile taken at . The distance between two arrows in the horizontal axis of the line profile plot at in Fig. 3 indicates the lateral width of a cell. These two arrows were taken by the edge detection algorithm used in our image analysis method described in Ref. 9. The width of the cell increased slightly with time in Fig. 3. Even though it is not obviously recognizable because of the diffraction limited spatial resolution of our optical imaging system, phase images in Fig. 3 imply that the cell became granulated after . Fig. 3Variations in the volume and the surface area of an RBL-2H3 cell before and after the addition of A23187. (a) Normalized cell volume and (b) normalized cell surface area with respect to time. A small arrow indicates the time when A23187 was injected. (c) Cross sectional line profiles and (d) phase images of the RBL-2H3 cell for discrete time points. Line profiles correspond to the height profiles of the sample cell. The color bars indicate the phase in radians. (Color online only.) 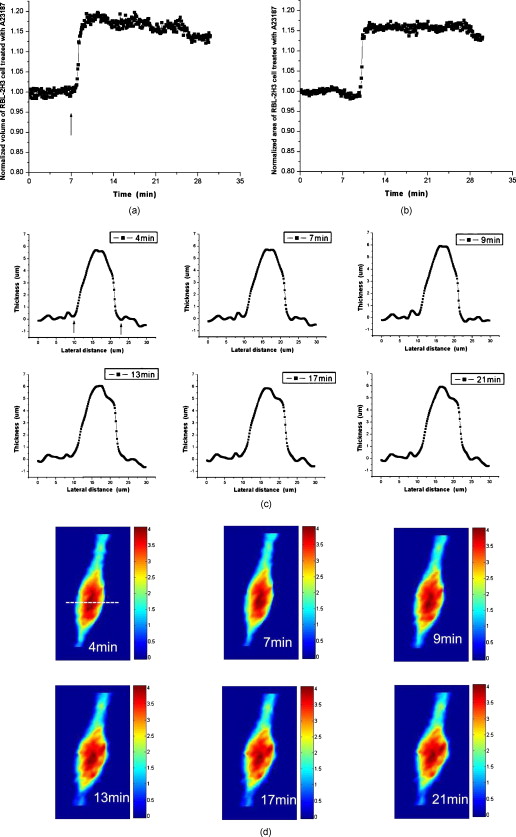 We did a control experiment for the degranulation process of an RBL-2H3 cell by replacing A23187 with PBS. Since PBS is a commonly used buffer solution, it is not supposed to stimulate degranulation to any cell. Figure 4 shows the volume change of a representative RBL-2H3 cell before and after PBS is injected to the cell chamber containing many RBL-2H3 cells. The vertical axis of the plot was normalized with the average volume of the cell within our observation period shown in the plot. We have followed the same volume measurement procedures used for Fig. 3. As expected, our experimental results in Fig. 4 show that there was no effect of PBS on the volume of the RBL-2H3 cell. An arrow near is the time point when PBS is injected into the chamber containing RBL-2H3 cells. Results shown in Fig. 4 indicate that PBS does not activate degranulation to the RBL-2H3 cell. Fig. 4Normalized cell volume for an RBL-2H3 cell as a function of time. A small arrow at indicates the time point when PBS was injected.  Next, we have used PBS and A23187 to test whether they might stimulate a degranulation process in HeLa cells. Since a HeLa cell is not a mast cell or granulocytes (neutrophils, eosinophils), it is not supposed to degranulate upon any external stimulus. Volume change in a representative HeLa cell was monitored with an interferometric QPM method, which was used in Figs. 3 and 4, while A23187 and PBS were injected into a cell chamber containing many HeLa cells. Each vertical axis in Fig. 5 was normalized by the average volume of each sample within its observation period. Figures 5 and 5 show that there is no significant cell volume change for the HeLa cell sample when it is exposed to either A23187 or PBS. Arrows near in Figs. 5 and 5 represent the time points when PBS and A23187 are injected to the chamber, respectively. We believe that small volume changes just after the addition time points in Figs. 5 and 4 are due to the fluctuations of the sample associated with the addition process. These small fluctuations last less than or so after the addition of PBS or A23187. The average cell volume is unchanged within the measurement error of the cell volume, which is about 2% for Fig. 5 and 3% for Fig. 4. Results shown in Fig. 5 indicate that neither PBS nor A23187 can induce significant change in HeLa cell volume. 3.2.Volume, Surface Area, and Cross Sectional Profile Changes of an RBL-2H3 Cell by AgNPTo find the effect of AgNP on the degranulation process of a mast cell, we have first monitored changes in the volume of a representative RBL-2H3 cell with QPM when it was exposed to of AgNP. Our measured results are displayed in Fig. 6 . The cell volume is normalized by its mean value taken for just before the addition of AgNP into the cell chamber. The addition time point is about . It shows that the volume was almost doubled immediately after AgNP was injected into the chamber, and it lasted more than . After , the cell volume was recovered to its initial volume. Similar changes in cell surface area were observed as well and are displayed in Fig. 6. Figure 6 shows actual phase images for the RBL-2H3 cell at , 7, 9, 11, 15, and . Again, the total magnification for these images was . Cross sectional line profiles corresponding to the phase images in Fig. 6 were obtained across a white dashed line in the top left image of Fig. 6. Figure 6 shows these cross sectional line profiles. Only one main peak was found in the cross sectional line profiles measured at and . However, several comparable peaks appeared in the line profile measured at , where the cell was swollen after AgNP was added. Fig. 6Effects of AgNP on an RBL-2H3 cell. Changes in (a) cell volume and (b) cell surface area after the addition of AgNP. Cross sectional line profiles (c) across the RBL-2H3 cell and (d) phase images at several different time points. The total magnification of our QPM setup was for these images. AgNP was injected into the cell culture chamber at . The color bars indicate the phase in radians. (Color online only.)  Moreover, both the lateral width and the height of the cell were increased as well [Fig. 6]. It clearly shows that the cell shape changed after the addition of AgNP in the time sequence of phase images shown in Fig. 6. Results shown in Fig. 6 show that volume change induced by AgNP can be clearly observed in the RBL-2H3 cell, and we need to verify that this volume change is really associated with degranulation in an RBL-2H3 cell with the measurements of and histamine. 3.3.Volume, Surface Area, and Cross Sectional Profile Changes of a HeLa Cell by AgNPTo confirm that the AgNP-induced volume change in an RBL-2H3 cell is linked with degranulation in the RBL-2H3 cell, we did the same volume measurement experiment for a HeLa cell as a control experiment. Since a HeLa cell is not a mast cell, we expect that there would be no apparent volume change in a HeLa cell when it is stimulated by AgNP. We have measured changes in the volume of a single HeLa cell with QPM before and after AgNP was injected into the cell culture chamber containing many HeLa cells. Figure 7 shows the results. After AgNP was added to the cell culture chamber, the volume of the representative HeLa cell fluctuated slightly around its average value, and no significant changes were detected. The inset in the upper part of Fig. 7 shows typical thickness fluctuations in measured data by QPM on an area without a cell. After the addition of AgNP, the standard deviation of our thickness data became as large as , while it was only about without AgNP. We have verified that these fluctuations are due to scattering associated intensity noise in laser light induced by AgNP. As displayed in Fig. 7, no significant changes were observed in the surface area after the addition of AgNP. Cross sectional line profiles across the white dashed line shown in the top left phase image of Fig. 7 have been shown in Fig. 7. Results shown in Fig. 7 show that there is no noticeable volume change in a HeLa cell after it is exposed to AgNP. Fig. 7Effect of AgNP on a HeLa cell. Changes in (a) cell volume and (b) cell surface area after the addition of AgNP at . (c) Cross sectional line profiles across the white dashed line shown in the top left image of (d) at several different time points. (d) Phase images corresponding to the time points of (c). The inset in (a) shows the height fluctuation in the area without a cell. Just after the addition of AgNP, the standard deviation of height measured by QPM was increased from . The total magnification of our QPM was for these images. The color bars indicate the phase in radians. (Color online only.)  3.4.Verification of and Extracellular Histamine Increase Induced by AgNPTo verify that the volume change of an RBL-2H3 cell by AgNP is due to the degranulation process of the cell, we have measured fluorescent images using fluorescent microscopy before and after the addition of AgNP to RBL-2H3 cells. Transmembrane fluxes of calcium are known to mediate the degranulation process in mast cells.1 We have incubated RBL-2H3 cells with a Fluo-3/AM probe for fluorescent imaging. AgNP was added at . A series of fluorescent images was taken after the addition and are shown in Fig. 8 . We can clearly see changes in calcium concentration by the variation of fluorescence intensity. The average intracellular calcium fluorescent intensity is calculated for each image and is plotted in Fig. 8 as a function of time. It was normalized by the initial average fluorescence intensity before the addition of AgNP. It shows that the normalized total fluorescence intensity increased quickly just after the addition of AgNP, and later it decreased slowly. The bright green curve is the averaged intracellular calcium fluorescence intensity of the RBL-2H3 cell without any treatment as a function of time. The experimental conditions were the same except for the addition of AgNP. Its intensity decreases quickly as well within a few tens of seconds. This curve works as control data representing the amount of photobleaching in our fluorescence imaging experiment. This slow decrease of the curve, which is analogous to the control data, is mostly because of photobleaching. Furthermore, the calcium in the external solution was depleted with EDTA, and the volume of RBL-2H3 cells treated with A23187 or AgNP was measured. Figures 9 and 9 show the RBL-2H3 cell volume change without the mediator of calcium. No change in the cell volume is observed in the RBL-2H3 cell treated with either A23187 or AgNP. Fig. 8(a) Fluorescent images of intracellular calcium in the AgNP-treated RBL-2H3 cell. (b) Normalized average intensity of in the RBL-2H3 cell after AgNP treatment. (Color online only.)  Fig. 9Effect of external calcium depletion on the cell volume. RBL-2H3 cells were sealed in the chamber filled with DPBS plus of EDTA and treated with (a) of A23187 or (b) of AgNP. The cell volume was measured with QPM and normalized with the average volume of a blank period. Small arrows at indicate the time points when A23187 or AgNP were added.  We have also verified the degranulation in a RBL-2H3 cell due to the addition of AgNP by measuring the histamine level in cell culture wells. Three RBL-2H3 cell sample groups were prepared: one without any treatment, one with AgNP, and one with A23187. The relative histamine release (percent) for each sample group was measured by a microplate spectrofluorometer. Relative fluorescence intensity from the histamine-OPA complex can verify whether there exist degranulation processes in each cell sample well. Figure 10 shows the time course of histamine release. At each time point after (5, 10, and ) in both the A23187 and AgNP group, histamine release increased significantly compared with that of control . These results show that both A23187 and AgNP activate degranulation in RBL-2H3 cells. Fig. 10Time course of histamine release induced by A23187 and AgNP. Measured relative histamine concentrations in three cell sample groups: Hank’s (cells without any treatment), AgNP (cells with AgNP), and A23187 (cells with A23187). At each time point after (5, 10, and ) in both the A23187 and AgNP group, histamine release increased significantly compared with that of the control .  4.DiscussionsIt is well known that A23187 can induce degranulation in an RBL-2H3 cell, during which granules inside the cell move toward the cell membrane, and granule protrusion occurs at the periphery of the cell.7, 10, 23 As a result, the cell spreads and its surface makes a change from smooth to complicated and ruffled. This process was normally clarified with electron microscopy.2, 10 Our experimental results in this work indicate that the volume of an RBL-2H3 cell increased immediately after the addition of A23187 and kept to a high level for [Fig. 3]. Ozawa observed that A23187-induced exocytosis was finished within after stimulation.7 Meanwhile, in the experiment conducted by Beaven and Cunha-Melo, it lasted up to .24 The reason why the time of cell volume increment in our study is longer than the reported degranulation times is probably the higher concentration of A23187 we used. The effective concentration of A23187 to elicit degranulation in an RBL-2H3 cell has been reported from , and the concentration in our experiment is the upper part of this range.5, 7 We have also observed that the variation of cell surface area experiences similar changes to that of cell volume during a degranulation process. Increments in cell surface as well as cell height were observed as soon as the degranulation process starts. It is clearly shown in phase images that the periphery of the cell became granulated. Our results are consistent with the previous structure study about A23187-activated RBL-2H3 cells with scanning electron microscopy.10 On the other hand, no similar volume alteration is observed in an RBL-2H3 cell treated with PBS (Fig. 4) or a HeLa cell treated with A23187 (Fig. 5). When the external calcium is depleted with EDTA, no cell volume change in the RBL-2H3 cell treated with A23187 is observed. Although A23187 can induce calcium influx and apoptosis in a HeLa cell with up to of incubation,25 there is no obvious volume change within in our experiment. Therefore, with volume measurements resulting in a HeLa cell as a cell control and volume measurements with the addition of PBS as a solvent control, we have proved that volume increase is the consequence of degranulation in an RBL-2H3 cell triggered by A23187. Based on these results, we propose that the cell volume could be one of the parameters for studying cell degranulation, and QPM can be a reliable method to measure the cell volume. Quantitative phase microscopy, which can be used to emulate other contrast image modes (including DIC and HMC) for qualitative viewing, is a nondestructive, noninterventional experimental tool for structural and functional cellular investigations.26 During the last decade, the use of AgNP in biomedical fields is becoming more and more widespread, and there are many papers on the biological properties and application of AgNP.27, 28 Except for the well known bactericidal functions of AgNP, other effects of AgNP on cells are relatively not investigated. We have tested whether AgNP can stimulate degranulation in RBL-2H3 cells by using our cell volume measurement technique with QPM. Just after the addition of AgNP into a cell culture chamber, we have observed that the cell volume of RBL-2H3 increased quickly [Fig. 6]. Meanwhile, the surface area of the RBL-2H3 cell underwent a significant change similar to that of cell volume. We have also shown that the cross sectional line profiles also changed accordingly. Before the addition of AgNP [Fig. 6], the cross sectional line profile of the RBL-2H3 cell had only one peak with a smooth surface. After AgNP was added, however, several comparable peaks emerged in the profile [ in Fig. 6], which means the cell surface became rough and granulated due to the protrusion of granules. The width of the cell was also increased in the line profile plot at , which suggests that the cell area was increased. At the same time, the thickness of the cell became higher, especially at the periphery of the cell [arrow shown at in Fig 5], where the granules probably aggregated and fused with cell membrane.2 Carlson demonstrated that a significant increase of ROS level was detected in macrophage cells exposed to of AgNP (diameter of ), but with of incubation, the ROS induced cytotoxicity.20 In our experiment, although the same concentration and similar size of AgNP is used, the exposure time is much shorter than . From Figs. 5 and 4, it is evident that after of exposure time, RBL-2H3 cell volume and shape almost recovered to pre-exposure levels. Therefore, the viability of RBL-2H3 cells was not affected, which is different from the cytotoxicity of AgNP proposed by Carlson Similar to the case of A23187 exposure, a HeLa cell was not influenced by AgNP with of time [Fig. 7], even though the cytotoxic effect and apoptosis induction by AgNP in HeLa cells was reported very recently.29 In that situation, the incubation time was as long as . The AgNP-induced volume increment in our experiment is cell-specific, which further proves that the volume change is not due to the nonspecific cytotoxicity of AgNP. To confirm the degranulation process of an RBL-2H3 cell induced by AgNP, the histamine concentration in the supernatant of cultured cell samples were measured with OPA staining. Compared with that of the control group, histamine release in either A23187 or AgNP treated groups at different time points (5, 10, and ) increased significantly , which indicates that degranulation occurred by AgNP addition in RBL-2H3 cells. The histamine release from AgNP-induced RBL-2H3 cells reaches the plateau phase sooner than the A23187-induced ones (Fig. 10). It has been reported that A23187-induced histamine release from rat mast cells can last as long as .30 So the duration time of the RBL-2H3 cell volume change induced by A23187 is longer than that of the AgNP group. In addition, the concentration of in RBL-2H3 cells was measured to increase quickly after AgNP treatment. Since it has been reported that calcium influx mediates the stimulus-degranulation coupling,1 and the increase of histamine concentration is a direct result of degranulation in a mast cell,20, 21 we believe that this Ca-dependent release of histamine in RBL-2H3 cell samples indicates that AgNP can activate the degranulation process in an RBL-2H3 cell. Due to the subnanometer path length sensitivity of QPM along the axis and transverse resolution with a objective lens ,9 it is possible to observe granule movement during the degranulation process. But some imaging processing methods are needed to distinguish granules from background fluctuation noises. The detailed process of degranulation triggered by AgNP and its exact mechanisms need to be investigated further. In conclusion, we have successfully observed that the volume of a RBL-2H3 cell increases markedly during a degranulation process triggered by AgNP. We use QPM to measure the volume of a cell with very high accuracy. We also demonstrate that the cell surface area and cross sectional line profiles can be accurately measured with this QPM. Since this volume change can be easily monitored by using QPM, we believe that our proposed method can be used in many degranulation related applications in immunology and drug development. AcknowledgmentsThis work was supported by Creative Research Initiatives (Center for 3D Nano Optical Imaging System) of MEST/KOSEF. ReferencesD. E. Cochrane and W. W. Douglas,
“Calcium-induced extrusion of secretory granules (exocytosis) in mast cells exposed to 48–80 or the ionophores A-23187 and X-537A,”
Proc. Natl. Acad. Sci. U.S.A., 71
(2), 408
–412
(1974). https://doi.org/10.1073/pnas.71.2.408 0027-8424 Google Scholar
P. Rohlich, P. Anderson, and B. Uvnas,
“Electron microscope observations on compounds 48–80-induced degranulation in rat mast cells. Evidence for sequential exocytosis of storage granules,”
J. Cell Biol., 51
(21), 465
–483
(1971). https://doi.org/10.1083/jcb.51.2.465 0021-9525 Google Scholar
A. B. Penissi,
“Novel anti-ulcer alpha, beta-unsaturated lactones inhibit compound -induced mast cell degranulation,”
Eur. J. Pharmacol., 612
(1–3), 122
–130
(2009). https://doi.org/10.1016/j.ejphar.2009.03.052 0014-2999 Google Scholar
W. Z. Yang,
“Effects of low power laser irradiation on intracellular calcium and histamine release in RBL-2H3 mast cells,”
Photochem. Photobiol., 83
(4), 979
–984
(2007). https://doi.org/10.1111/j.1751-1097.2007.00183.x 0031-8655 Google Scholar
E. Passante,
“RBL-2H3 cells are an imprecise model for mast cell mediator release,”
Inflamm Res., 58
(9), 611
–618
(2009). https://doi.org/10.1007/s00011-009-0028-4 1023-3830 Google Scholar
Y. Kawasaki, T. Saitoh, T. Okabe, K. Kumakura, and M. Ohara-Imaizumi,
“Visualization of exocytotic secretory processes of mast cells by fluorescence techniques,”
Biochim. Biophys. Acta, 1067
(1), 71
–80
(1991). https://doi.org/10.1016/0005-2736(91)90027-6 0006-3002 Google Scholar
K. Ozawa,
“Quantitative analysis of exocytosis visualized by a video-enhanced light/fluorescence microscope reveals two distinct components of exocytosis in RBL-2H3 cells,”
FEBS Lett., 398
(1), 67
–73
(1996). https://doi.org/10.1016/S0014-5793(96)01184-2 0014-5793 Google Scholar
Z. Deng,
“Impact of actin rearrangement and degranulation on the membrane structure of primary mast cells: a combined atomic force and laser scanning confocal microscopy investigation,”
Biophys. J., 96
(4), 1629
–1639
(2009). https://doi.org/10.1016/j.bpj.2008.11.015 0006-3495 Google Scholar
S. Lee,
“Autofocusing and edge detection schemes in cell volume measurements with quantitative phase microscopy,”
Opt. Express, 17
(8), 6476
–6486
(2009). https://doi.org/10.1364/OE.17.006476 1094-4087 Google Scholar
N. Sahara, R. P. Siraganian, and C. Oliver,
“Morphological changes induced by the calcium ionophore A23187 in rat basophilic leukemia (2H3) cells,”
J. Histochem. Cytochem., 38
(7), 975
–983
(1990). 0022-1554 Google Scholar
M. Veien,
“Mechanisms of nonimmunological histamine and tryptase release from human cutaneous mast cells,”
Anesthesiology, 92
(4), 1074
–1081
(2000). https://doi.org/10.1097/00000542-200004000-00026 0003-3022 Google Scholar
Y. Suzuki,
“Exposure of RBL-2H3 mast cells to induces cell degranulation and mediator release,”
Biochem. Biophys. Res. Commun., 283
(3), 707
–714
(2001). https://doi.org/10.1006/bbrc.2001.4844 0006-291X Google Scholar
A. Schedle,
“Metal ion-induced toxic histamine release from human basophils and mast cells,”
J. Biomed. Mater. Res., 39
(4), 560
–567
(1998). https://doi.org/10.1002/(SICI)1097-4636(19980315)39:4<560::AID-JBM9>3.0.CO;2-H 0021-9304 Google Scholar
Y. Suzuki,
“Silver activates calcium signals in rat basophilic leukemia-2H3 mast cells by a mechanism that differs from the Fc epsilon RI-activated response,”
J. Immunol., 169
(7), 3954
–3962
(2002). 0022-1767 Google Scholar
T. Yoshimaru,
“Silver activates mast cells through reactive oxygen species production and a thiol-sensitive store-independent influx,”
Free Radic Biol. Med., 40
(11), 1949
–1959
(2006). https://doi.org/10.1016/j.freeradbiomed.2006.01.023 0891-5849 Google Scholar
X. Chen and H. J. Schluesener,
“Nanosilver: a nanoproduct in medical application,”
Toxicol. Lett., 176
(1), 1
–12
(2008). https://doi.org/10.1016/j.toxlet.2007.10.004 0378-4274 Google Scholar
V. K. Sharma, R. A. Yngard, and Y. Lin,
“Silver nanoparticles: green synthesis and their antimicrobial activities,”
Adv. Colloid Interface Sci., 145
(1–2), 83
–96
(2009). https://doi.org/10.1016/j.cis.2008.09.002 0001-8686 Google Scholar
M. Fayaz,
“Biogenic synthesis of silver nanoparticles and its synergetic effect with antibiotics: a study against Gram positive and Gram negative bacteria,”
Nanomed., 6
(1), 103
–109
(2009). Google Scholar
P. Totaro and M. Rambaldini,
“Efficacy of antimicrobial activity of slow release silver nanoparticles dressing in post-cardiac surgery mediastinitis,”
Interact. Cardiovasc. Thorac. Surg., 8
(1), 153
–154
(2009). https://doi.org/10.1510/icvts.2008.188870 Google Scholar
C. Carlson,
“Unique cellular interaction of silver nanoparticles: size-dependent generation of reactive oxygen species,”
J. Phys. Chem. B, 112
(43), 13608
–13619
(2008). https://doi.org/10.1021/jp712087m 1089-5647 Google Scholar
O. Choi and Z. Hu,
“Size dependent and reactive oxygen species related nanosilver toxicity to nitrifying bacteria,”
Environ. Sci. Technol., 42
(12), 4583
–4588
(2008). https://doi.org/10.1021/es703238h 0013-936X Google Scholar
Y. H. Hsin,
“The apoptotic effect of nanosilver is mediated by a ROS- and JNK-dependent mechanism involving the mitochondrial pathway in NIH3T3 cells,”
Toxicol. Lett., 179
(3), 130
–139
(2008). https://doi.org/10.1016/j.toxlet.2008.04.015 0378-4274 Google Scholar
R. Sagi-Eisenberg, H. Lieman, and I. Pecht,
“Protein kinase C regulation of the receptor-coupled calcium signal in histamine-secreting rat basophilic leukaemia cells,”
Nature, 313
(5997), 59
–60
(1985). https://doi.org/10.1038/313059a0 0028-0836 Google Scholar
M. A. Beaven and J. R. Cunha-Melo,
“Membrane phosphoinositide-activated signals in mast cells and basophils,”
Prog. Allergy, 42 123
–184
(1988). 0079-6034 Google Scholar
H. Zhu,
“Calcineurin mediates acetylcholinesterase expression during calcium ionophore A23187-induced HeLa cell apoptosis,”
Biochim. Biophys. Acta, 1773
(4), 593
–602
(2007). https://doi.org/10.1016/j.bbamcr.2007.01.008 0006-3002 Google Scholar
C. L. Curl,
“Quantitative phase microscopy: a new tool for investigating the structure and function of unstained live cells,”
Clin. Exp. Pharmacol. Physiol., 31
(12), 896
–901
(2004). https://doi.org/10.1111/j.1440-1681.2004.04100.x 0305-1870 Google Scholar
R. Bhattacharya and P. Mukherjee,
“Biological properties of “naked” metal nanoparticles,”
Adv. Drug Delivery Rev., 60
(11), 1289
–1306
(2008). https://doi.org/10.1016/j.addr.2008.03.013 0169-409X Google Scholar
M. Rai, A. Yadav, and A. Gade,
“Silver nanoparticles as a new generation of antimicrobials,”
Biotechnol. Adv., 27
(1), 76
–83
(2009). https://doi.org/10.1016/j.biotechadv.2008.09.002 0734-9750 Google Scholar
N. Miura and Y. Shinohara,
“Cytotoxic effect and apoptosis induction by silver nanoparticles in HeLa cells,”
Biochem. Biophys. Res. Commun., 390
(3), 733
–737
(2009). 0006-291X Google Scholar
T. Johansen,
“Histamine release induced from rat mast cells by the ionophore A23187 in the absence of extracellular calcium,”
Eur. J. Pharmacol., 62
(4), 329
–334
(1980). https://doi.org/10.1016/0014-2999(80)90100-4 0014-2999 Google Scholar
|