

|
|
1.IntroductionThe skin is the largest organ of the human body and serves many important functions. One of its key functions is as a barrier layer preventing the entry of foreign entities into the body. The barrier function of the skin is performed by the outermost layer, the stratum corneum (SC), a composition of brick-like, densely packed dead cells interlocked with neighboring cells. Its thickness depends on the anatomical location, but has been reported to be in the range of .1, 2 This poses a major difficulty for the transdermal delivery of drugs, vaccines, and other therapeutic agents to the epidermis (ED) lying immediately beneath and beyond to the superficial dermal plexus. Although transdermal delivery is an attractive alternative to conventional methods of administration, the diffusion barrier posed by the intact stratum corneum means that the number of substances than can pass through the skin is currently limited to a small number of low-dose, low-molecular weight medicants such as nicotine, estrogen, and fentanyl.3 In recent years there has been considerable interest in the development of new techniques to overcome this problem using minimally invasive methods such as iontophoresis, skin ablation, bombardment, and electroporation.4, 5 More recent advances in micromachining and materials processing have led to the development and introduction of a variety of sharp-tipped, micron-scale projections known as microneedles. These devices are designed to penetrate the barrier layer of the skin.6 If ruptured, the diffusion of many agents into the tissue is greatly improved, thereby aiding drug delivery. Microneedle arrays combine the benefits of hypodermic needles and patches while reducing the limitations associated with each. They consist of several sharp protrusions, generally in the range. Manufactured using microfabrication technologies, they are available in a range of materials such as silicon,6 palladium,7 titanium,8 various polymers,9 and sugars.10 Transdermal drug delivery by this method uses needle arrays to create transient micropores or perforations in the skin’s stratum corneum. This can increase the permeability of the barrier layer to large molecules by several orders of magnitude.6, 11 To date, a number of groups have investigated the applicability of microneedle technology to drug delivery,12 pDNA delivery,13 insulin delivery,14, 15 vaccine delivery,16 optical clearing,17 EEG measurement,15 and electroporation therapy.18 One of the major advantages to using this kind of technology is the minimally invasive and pain-free19 nature of microneedle application, as needle array heights can be designed to penetrate the stratum corneum while avoiding stimulation of the underlying nerve endings that lie deeper in the epidermis. This generates increased patient confidence, and the potential for low-cost self-administration, especially in developing countries, is immense. To date, research investigating the micropores produced by microneedles has primarily been performed ex-vivo due to their small size and the difficulties associated with in-vivo analysis.14, 20 In particular, there are only a limited number of suitable imaging techniques available. The majority of the research has focused on whether or not the barrier layer has been compromised. Commonly used procedures involve puncturing the skin using microneedles, then using standard histological techniques and optical microscopy to image an excised section. However, the technique is slow and the efficacy of this method is reduced through damage of the structure of the needle hole during the histological process. This hampers quantitative data collection such as penetration depth and micropore closure rate. Knowledge of these parameters is vital for assessing important transdermal delivery parameters such as dosage profiles, drug diffusion rates, and skin healing times. Recent work by Bal 21 involved using confocal laser scanning microscopy (CLSM) to image in vivo the diffusion of a fluorescent dye through the skin after microneedle insertion. This work shows great promise as a technique to determine how the diffusion rates of agents are enhanced by the application of microneedles. The technique, however, is limited by the penetration depth of approximatley and field of view of the system. In this work we propose the use of optical coherence tomography (OCT)22 as a technique to image the aforementioned micropores. OCT function as a form of nondestructive “optical biopsy” allows in-vivo imaging of tissue structure in real time and in situ without the need for tissue pretreatment or removal. The procedure uses an echo technique analogous to conventional ultrasound, using reflections of light instead of sound to generate structural images. Although its origins are based in ophthalmology,23 the use of OCT has broadened to several areas of clinical research including skin,24 dental,25, 26 endoscopy,27, 28 and colonoscopy.29, 30 2.Experimental Setup2.1.MicroneedlesThe microneedle arrays used in this study were fabricated using previously reported potassium hydroxide wet-etching techniques.31 Sample images of the microneedles used are shown in Fig. 1 . The starting material was a -thick, -diam monocrystalline silicon wafer that is orientated in the ⟨100⟩ direction, on which marks denoting this crystal alignment have already been etched. A layer of silicon oxide is grown using thermal oxidation as a stress relief layer before a subsequent low-pressure chemical vapor deposition of silicon nitride. A positive photoresist layer is then deposited and patterned in square masks using standard photolithography techniques; the dimensions of these square masks determine the array pitch and needle geometry.31 The mask pattern is etched into the nitride layer using a plasma etch process before the resist is stripped and the oxide layer then removed in the open areas using hydrofluoric acid (HF). The patterned silicon wafer is then etched using a 29% w/v aqueous KOH solution at a temperature of . Needle formation is based on the anisotropic etch behavior of monocrystalline silicon in KOH, a property of the crystal structure that causes each group of crystal planes to etch at a different rate. The sides of the square nitride mask are precisely aligned to the particularly slow-etching ⟨h11⟩ plane; the faster-etching ⟨h12⟩ planes are exposed to the KOH at the convex corners of the square. As two of these fast-etching planes are etched from each corner, an octagonal needle shape is generated when the eight planes meet. The final needle is comprised of eight ⟨312⟩ planes, a base of ⟨121⟩ planes, and has a height:base diameter aspect ratio of 3:2. The array used in this study consisted of a arrangement of needles located at a pitch of on a die. The height of the needles was . 2.2.Optical Coherence Tomography SystemThis work employs the use of a commercial OCT systems developed by Bioptigen Incorporated, Research Triangle Park, North Carolina. The system is a spectral Fourier domain OCT (SFD-OCT) and is equipped with an light source. This system offers an axial resolution of and a lateral resolution of , and operates with an A-scan rate of , producing images with a volume of in . 3.ResultsTo assess the suitability of OCT in imaging micropore structures, the microneedle array was firmly pressed into a flat block of Blu-Tack® (Bostik, Wauwatosa, Wisconsin)—a pressure-sensitive clay-like adhesive—then removed. Blu-Tack® was chosen due to its soft pliable consistency, low elasticity, and highly scattering properties. A 3-D scan of the Blu-Tack® was imaged using the OCT system. The location of each micropore was located within the 3-D volume and identified by a grid reference, shown in Fig. 2 . The image segmentation and visualization was performed using an in-house designed software package written in Java, using J3D. To measure the depth of each micropore, a slice through the center of the micropore was first located [see Fig. 2]. A minimum intensity projection across 21 voxels perpendicular to the slice axis was taken [see Figs. 2 and 2] to enhance the micropore profile. This was done at angles of 0, 45, 90, and relative to the B-scan axis. The micropore depth was then manually determined for each projection, and the average value taken. The micropore depth was determined to be . The results show that by using OCT, it is possible to clearly visualize the micropore structure after microneedle insertion in a noncontact and noninvasive technique. Fig. 2OCT scan of micropores in a Blu-Tack® block imaged using OCT. (a) 3-D reconstruction of microneedle array imprint. The data shows a volume. (b) C-scan through a section (dashed line represents the B-scan direction). (c) 2-D slice through the volume data for red line indicated in (b). (d) Minimum intensity projection perpendicular to slice axis using a 21 voxel average. (Color online only.)  3.1.In-Vivo Penetration Depth of MicroneedlesThe procedure was extended to image the micropores in vivo. These tests were performed on a -old Caucasian male subject with informed consent. Two separate locations were imaged: the volar forearm and the fingernail fold. The skin was not pretreated prior to needle insertion. The subject was asked to report on the level of discomfort/pain experienced as the needles were inserted. The microneedles were placed over the insertion point, then positioned under the OCT imaging system to allow for immediate scanning. The needle array was pressed into the forearm using the forefinger with a moderate level of pressure and held for . After application, the needle array was removed from the skin and the region was imaged using the OCT (see Fig. 3 ). Fig. 3OCT imaging of microneedle array into volar forearm. (a) Optical image of microneedle application site (marked by square) after insertion. (b) OCT of microneedle pores immediately after insertion into the forearm for the region indicated in (a). (c) 2-D slice showing needles fully penetrating the epidermal layer along the line X-X indicated in (b). The arrows indicate the needle holes in the skin.  The distance to the dermal-epidermal junction (DEJ) was determined by averaging 10 B-scans to reduce the speckle noise present in OCT images. The surface of the skin was manually tracked. Regions containing hair follicles and micropores were deemed invalid and were not tracked [see Fig. 4 ]. The valid regions of the images were flattened along the tracked surface and the average A-scan determined [see Fig. 4]. The distance to the DEJ was manually measured by a skilled operator. The DEJ was measured to be at a depth of from a sample size of 163 at varying locations along the volar forearm. When the DEJ depth was compared to the averaged A-scan, it coincided with the distance from the entrance peak to the midpoint of the first minimum and the second peak [see Fig. 4]. It was not possible to measure the stratum corneum for the forearm using the OCT system, as the thickness has been previously reported to be in this region.32 Fig. 4Epidermal thickness measurement of the forearm; (a) 2-D OCT slice, (b) 2-D slice with an average of 21 B-scans, and (c) flattened image showing average A-scan (red) and epidermal thickness (orange) (scale bars ). 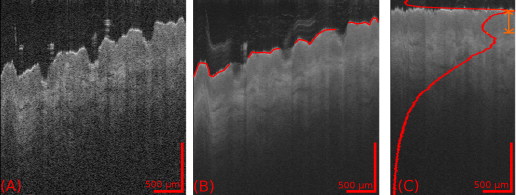 By using the previously outlined minimum projection technique, the depth of each micropore was measured. When the microneedles were inserted into skin, it was possible that the underlying tissue could compress/deform under the pressure of the microneedles. It was therefore important to determine if any epidermal tissue remained under the tip of each micropore. To achieve this, an averaged A-scan under the micropore was calculated. The averaging was performed on the plane perpendicular to a line through the tip of the micropore for voxels in both the and directions [see LM in Fig. 5 ]. The presence of a second peak in the A-scan was indicative that the DEJ remained under the micropore tip [see Fig. 5]. This was done for each projection axis (0, 45, 90, and relative to the B-scan axis), and the average value calculated. This was repeated for each micropore and the results are indicated in Fig. 6 . As before, each micropore was identified by its grid location [see Fig. 3]. Fig. 5Measurement of the epidermal thickness under the micropore. (a) OCT scan of the region. (b) Averaged A-Scan showing the location of the micropore tip and the dermal epidermal junction (DEJ).  Fig. 6In-vivo measured depth of each micropore in the skin (dark gray) and the epidermal thickness measured under each micropore (light gray) for a microneedle array in the forearm [see Fig. 3 for grid location]. The measured epidermal thickness in the region is indicated by the horizontal line.  The micropores were measured to penetrate an average depth of into the skin. This result would indicate that the microneedles had penetrated fully through the epidermis. However, epidermal tissue can still be measured under each micropore due to tissue compression/deformation. The average epidermal thickness measured under each micropore was , which indicates that the microneedles penetrate on average 61% of the epidermis. It must also be noted that the subject did not indicate any pain or discomfort during the microneedle insertion. 3.2.Penetration Depth of Microneedles in FingertipThe fingertip could prove a very elegant region for the administration of drugs using microneedles, given its easily accessible location. Hence this area was also assessed as an area for microneedle insertion. For this region, we aimed to examine how long the micropores would remain open. To achieve this, a scan was repeated every for after the needles were inserted. To prevent the finger from moving between subsequent scans, a mold of the fingertip was made. This was produced by pressing the finger into a large block of Blu-Tack® and molding it around the finger. This minimized finger movement during 3-D scans and allowed the finger to be placed back into the same location after each scan. As before, the finger was placed under the OCT system prior to needle insertion. The microneedles were then pressed into the dorsal aspect of the finger with a moderate level of pressure just above the nail-fold plexus and held for . The microneedles were removed and the location imaged using OCT (see Fig. 7 ). As before, the subject did not report any pain or discomfort during microneedle insertion. Again, the thickness of the epidermis was measured using the OCT system. The full thickness of the stratum corneum was determined to be for the fingernail plexus. This value was calculated using a refractive index of the stratum corneum previously reported as a value of .33 The micropores were each labeled (see Fig. 7), manually segmented, and their penetration depth determined. The results show that the average penetration depth of the needles has been measured as , similar to that obtained in the forearm region. On average, of stratum corneum remains under the micropores. This shows that the microneedles have penetrated through approximately 64% of the stratum corneum, indicating an enhanced transdermal diffusion rate of pharmaceutical agents via microneedle usage. Even though the diffusion rate would be limited by the remaining stratum corneum under the micropore, it must be noted that the stratum corneum in this particular region is relatively thick. Hence this pore depth would sufficiently overcome the relatively thinner stratum corneum found in most other regions of the body. Fig. 7Microneedle insertion into the fingertip just above the nailfold plexus. (a) Optical image showing region where microneedles were inserted. (b) OCT scan of microneedle pores for the region marked in (a). (c) Enlarged region of a single microneedle pore in finger tissue as marked in (b). (d) Enlarged region showing a cross section of microneedle pore along the X-X line indicated in (c).  3.3.Micropore Closure RateWhile stratum corneum disruption using microneedles has been extensively studied and it is accepted that skin healing takes place on a time scale of days,34, 35 we are unaware of any work that quantitatively describes the time-dependent depth kinetics and closure rate of the needle-induced micropores. These characteristics will be particularly relevant during the development of future transdermal products to assess required drug delivery volumes, dosage calculations, and transdermal diffusion rates. The OCT imaging technique that we present here is real time, and we demonstrate that it is therefore possible to examine the changes in the depth of the pores over time in more detail than was previously possible. The data show that the pores remain open, although the micropore depth has diminished to , while the measured stratum corneum under the micropores has increased to . This indicates that the micropores still penetrate 36% of the stratum corneum thickness. It is not yet clear whether the reduction in pore depth is due to commencement of the healing process, or to a relaxation of the tissue at needle array removal due to the elasticity of the skin. Furthermore, it is expected that topical application of a medicant could prevent early commencement of the healing process and allow diffusion pathways to remain open for a considerable time. OCT scans comparing the depth of the pores immediately after microneedle insertion and after insertion are illustrated in Fig. 8 . Fig. 8Magnified view of the microneedle holes on the fingertip: (a) and (b) immediately after application and (c) and (d) after application.  The data show that the needle holes are still clearly visible in the OCT images after insertion. The evolution of the micropores over time can be examined (see Fig. 9 ). The graph shows the average micropore depth for each row of microneedles (i.e., A is the average of A1, A2, A3, and A4) and also the average stratum corneum thickness remaining under the tips of the microneedles. The data show that the pores reduce from a depth of down to a depth of in a time frame of . The data also show that the measured stratum corneum under the micropores increases from up to in the same time frame. This is a key result, as it shows the slow time frame over which the micropores close, which is important because it gives an indication of whether there would be sufficient time for a chemical agent to diffuse across the tissue. Fig. 9Dynamics characterization of microneedle closure. Graph shows the change in average penetration depth for micropores in the fingertip (a) and change in stratum corneum (SC) thickness under each micropore (b). (Dataset A represents average of A1, A2, A3, and A4. See Fig. 7 for grid reference.)  4.DiscussionWe have demonstrated for the first time the suitability of OCT for noninvasive in-vivo measurement of micropores created by microneedles in human skin. The results have shown that it is also possible to assess the penetration depth through the tissue using OCT and the deformation/compression of the tissue after needle insertion. The data also provide a first step in quantitative measurement of pore closure rate, and illustrate the applicability of OCT analysis as a tool for microneedle-related skin characterization. Despite the fact that human skin is not uniformly flat, with surface roughness varying according to factors such as age, regional location, and pathological conditions, the results verify that the wet-etched silicon microneedles prepared for this study should reproducibly penetrate into the tissue at a variety of locations. This preliminary work outlines the dynamics of the closure of micropores in human tissue in vivo. These closure rates are a vital parameter when determining the suitability of microneedle applications. It has been demonstrated that the micropores close on a time scale approaching hours, and could therefore circumvent a major obstruction to transdermal and intradermal drug delivery. However, it must be noted that the observed closure rate may differ from the transdermal diffusion rate of agents. The results would suggest that, by using OCT, it would be possible to correlate these, and this aspect warrants greater investigation. AcknowledgmentsThe authors would like to acknowledge the support of the Irish Research Council for Science, Engineering, and Technology for funding this project. This research was also supported by the National Biophotonics Imaging Platform Ireland funded under the Higher Education Authority PRTLI Cycle 4, cofunded by the Irish Government and the European Union—“investing in your future.” ReferencesK. Holbrook and G. Odland,
“Regional differences in the thickness (cell layers) of the human stratum corneum: an ultrastructural analysis,”
J. Invest. Dermatol., 62
(4), 415
–422
(1974). https://doi.org/10.1111/1523-1747.ep12701670 0022-202X Google Scholar
M. Egawa, T. Hirao, and M. Takahashi,
“In vivo estimation of stratum corneum thickness from water concentration profiles obtained with Raman spectroscopy,”
Acta Derm Venereol, 87
(1), 4
–8
(2007). https://doi.org/10.2340/00015555-0183 0001-5555 Google Scholar
M. Prausnitz and R. Langer,
“Transdermal drug delivery,”
Nat. Biotechnol., 26
(11), 1261
–1268
(2008). https://doi.org/10.1038/nbt.1504 1087-0156 Google Scholar
T. Tanner and R. Marks,
“Delivering drugs by the transdermal route: review and comment,”
Skin Res. Technol., 14
(3), 249
–260
(2008). https://doi.org/10.1111/j.1600-0846.2008.00316.x 0909-752X Google Scholar
M. R. Prausnitz, S. Mitragotri, and R. Langer,
“Current status and future potential of transdermal drug delivery,”
Nat. Rev. Drug Discovery, 3
(9), 115
–124
(2004). 1474-1776 Google Scholar
S. Henry, D. V. McAllister, M. G. Allen, and M. R. Prausnitz,
“Microfabricated microneedles: a novel approach to transdermal drug delivery,”
J. Pharm. Sci., 87
(8), 922
–925
(1998). https://doi.org/10.1021/js980042+ 0022-3549 Google Scholar
S. Chandrasekaran and B. Frazier,
“Characterization of surface micromachined metallic microneedles,”
J. Microelectromech. Syst., 12
(3), 289
–286
(2003). 1057-7157 Google Scholar
E. R. Parker, M. P. Rao, K. L. Turner, and N. C. MacDonald,
“Bulk micromachined titanium microneedles,”
J. Microelectromech. Syst., 16
(2), 289
–296
(2007). https://doi.org/10.1109/JMEMS.2007.892909 1057-7157 Google Scholar
S. Davis, W. Martanto, M. Allen, and M. R. Prausnitz,
“Hollow metal microneedles for insulin delivery to diabetic rats,”
IEEE Trans. Biomed. Eng., 52
(5), 909
–916
(2005). 0018-9294 Google Scholar
T. Miyano, Y. Tobinaga, T. Kanno, Y. Matsuzaki, H. Takeda, M. Wakui, and K. Hanada,
“Sugar micro needles as transdermic drug delivery system,”
Biomed. Microdevices, 7
(3), 185
–189
(2005). https://doi.org/10.1007/s10544-005-3024-7 1387-2176 Google Scholar
S. Henry, D. V. McAllister, M. G. Allen, and M. R. Prausnitz,
“Micromachined needles for the transdermal delivery of drugs,”
494
–498
(1998). Google Scholar
J. H. Park, M. G. Allen, and M. R. Prausnitz,
“Biodegradable polymer microneedles: fabrication, mechanics and transdermal drug delivery,”
J. Controlled Release, 104
(1), 51
–66
(2005). https://doi.org/10.1016/j.jconrel.2005.02.002 0168-3659 Google Scholar
F. Chabri, K. Bouris, T. Jones, D. Barrow, A. Hann, C. Allender, K. Brain, and J. Birchall,
“Microfabricated silicon microneedles for nonviral cutaneous gene delivery,”
Br. J. Dermatol., 150
(869–877), 869
–877
(2004). https://doi.org/10.1111/j.1365-2133.2004.05921.x 0007-0963 Google Scholar
W. Martanto, S. P. Davis, N. R. Holiday, J. Wang, H. S. Gill, and M. R. Prausnitz,
“Transdermal delivery of insulin using microneedles in vivo,”
Pharm. Res., 21
(6), 947
–954
(2004). https://doi.org/10.1023/B:PHAM.0000029282.44140.2e 0724-8741 Google Scholar
R. Luttge, S. N. Bystrova, and M. J. A. M. v. Putten,
“Microneedle array electrode for human EEG recording,”
IFMBE Proc., 22
(3), 1246
–1249
(2008). Google Scholar
J. A. Mikszta, V. J. Sullivan, C. Dean, A. M. Waterston, J. B. Alarcon, J. P. Dekker III, J. M. Brittingham, J. Huang, C. R. Hwang, M. Ferriter, G. Jiang, K. Mar, K. U. Saikh, B. G. Stiles, C. J. Roy, R. G. Ulrich, and N. G. Harvey,
“Protective immunization against inhalational anthrax: a comparison of minimally invasive delivery platforms,”
J. Infect. Dis., 191
(2), 278
–288
(2005). https://doi.org/10.1086/426865 0022-1899 Google Scholar
Y. Jinhee, S. Taeyoon, C. Eung-ho, C. Bernard, J. S. Nelson, and J. Byungjo,
“Enhancement of optical skin clearing efficacy using a microneedle roller,”
J. Biomed. Opt., 13
(2), 021103
(2008). https://doi.org/10.1117/1.2907483 1083-3668 Google Scholar
N. Wilke, C. Hibert, J. O’Brien, and A. Morrissey,
“Silicon microneedle electrode array with temperature monitoring for electroporation,”
Sens. Actuators A: Phys., 123,124 319
–325
(2005). https://doi.org/10.1016/j.sna.2005.05.017 Google Scholar
S. Kaushik, A. H. Hord, D. D. Denson, D. V. McAllister, S. Smitra, M. G. Allen, and M. R. Prausnitz,
“Lack of pain associated with microfabricated microneedles,”
Anesth. Analg., 92
(2), 502
–504
(2001). https://doi.org/10.1097/00000539-200102000-00041 Google Scholar
S. P. Davisa, B. J. Landisa, Z. H. Adamsa, M. G. Allenb, and M. R. Prausnitza,
“Insertion of microneedles into skin: measurement and prediction of insertion force and needle fracture force,”
J. Biomech., 37 1155
–1164
(2004). 0021-9290 Google Scholar
S. Bal, A. C. Kruithof, H. Liebl, M. Tomerius, J. Bouwstra, J. Lademann, and M. Meinke,
“In vivo visualization of microneedle conduits in human skin using laser scanning microscopy,”
Laser Phys. Lett., 7
(3), 242
–246
(2010). https://doi.org/10.1002/lapl.200910134 1612-2011 Google Scholar
A. F. Fercher, W. Drexler, C. K. Hitzenberger, and T. Lasser,
“Optical coherence tomography—principles and applications,”
Rep. Prog. Phys., 66
(2), 239
–303
(2003). https://doi.org/10.1088/0034-4885/66/2/204 0034-4885 Google Scholar
C. K. Hitzenberger,
“Optical measurement of the axial eye length by laser Doppler interferometry,”
Invest. Ophthalmol. Visual Sci., 32
(3), 616
–624
(1991). 0146-0404 Google Scholar
Y. Hori, Y. Yasuno, S. Sakai, M. Matsumoto, T. Sugawara, V. Madjarova, M. Yamanari, S. Makita, T. Yasui, and T. Araki,
“Automatic characterization and segmentation of human skin using three-dimensional optical coherence tomography,”
Opt. Express, 14
(5), 1862
–1877
(2006). https://doi.org/10.1364/OE.14.001862 1094-4087 Google Scholar
R. S. Jones, C. L. Darling, J. D. B. Featherstone, and D. Fried,
“Remineralization of in vitro dental caries assessed with polarization-sensitive optical coherence tomography,”
J. Biomed. Opt., 11 014016
(2006). https://doi.org/10.1117/1.2161192 1083-3668 Google Scholar
H. Shemesh, G. van Soest, M. K. Wu, L. W. M. van der Sluis, and P. R. Wesselink,
“The ability of optical coherence tomography to characterize the root canal walls,”
J. Endodontics, 33
(11), 1369
–1373
(2007). https://doi.org/10.1016/j.joen.2007.06.022 Google Scholar
G. Isenberg, J. M. V. Sivak, A. Chak, R. C. K. Wong, J. E. Willis, B. Wolf, D. Y. Rowland, A. Das, and A. Rollins,
“Accuracy of endoscopic optical coherence tomography in the detection of dysplasia in Barrett’s esophagus: a prospective, double-blinded study,”
Gastrointest. Endosc., 62
(6), 825
–831
(2005). https://doi.org/10.1016/j.gie.2005.07.048 0016-5107 Google Scholar
Y. Chen, D. C. Adler, R. Huber, C. Zhou, J. M. Schmitt, J. Connolly, and J. G. Fujimoto,
“Three-dimensional endoscopic optical coherence tomography (OCT) using Fourier domain mode locked (FDML) lasers,”
Biomedical Optics (BIOMED), Optical Society of America, St. Petersburg, FL
(2008). Google Scholar
P. L. Hsiung, L. Pantanowitz, A. D. Aguirre, Y. Chen, D. Phatak, T. H. Ko, S. Bourquin, S. J. Schnitt, S. Raza, and J. L. Connolly,
“Ultrahigh-resolution and 3-dimensional optical coherence tomography ex vivo imaging of the large and small intestines,”
Gastrointest. Endosc., 62
(4), 561
–574
(2005). https://doi.org/10.1016/j.gie.2005.05.006 0016-5107 Google Scholar
D. C. Adler, C. Zhou, T. H. Tsai, J. Schmitt, Q. Huang, H. Mashimo, and J. G. Fujimoto,
“Three-dimensional endomicroscopy of the human colon using optical coherence tomography,”
Opt. Express, 17
(2), 784
–796
(2009). https://doi.org/10.1364/OE.17.000784 1094-4087 Google Scholar
N. Wilke, A. Mulchay, S. Ye, and A. Morrissey,
“Process optimization and characterization of silicon microneedles fabricated by wet etch technology,”
Microelectron. J., 36 650
–657
(2005). 0026-2692 Google Scholar
K. A. Holbrook and G. F. Odland,
“Regional differences in the thickness (cell layers) of the human stratum corneum: an ultrastructural analysis,”
J. Invest. Dermatol., 62
(4), 415
–422
(1974). https://doi.org/10.1111/1523-1747.ep12701670 0022-202X Google Scholar
G. J. Tearney, M. E. Brezinski, J. F. Southern, B. E. Bouma, M. R. Hee, and J. G. Fujimoto,
“Determination of the refractive index of highly scattering human tissue by optical coherence tomography,”
Opt. Lett., 20
(21), 2258
–2279
(1995). https://doi.org/10.1364/OL.20.002258 0146-9592 Google Scholar
D. Wermeling, S. Banks, D. Hudson, H. Gill, J. Gupta, M. Prausnitz, and A. Stinchcomb,
“Microneedles permit transdermal delivery of a skin-impermeant medication to humans,”
Proc. National Acad. Sci., 105
(6), 2058
–2063
(2008). https://doi.org/10.1073/pnas.0710355105 Google Scholar
M. Haq, E. Smith, D. John, M. Kalavala, C. Edwards, A. Anstey, A. Morrissey, and J. Birchall,
“Clinical administration of microneedles: skin puncture, pain and sensation,”
Biomed. Microdevices, 11
(1), 35
–47
(2009). https://doi.org/10.1007/s10544-008-9208-1 1387-2176 Google Scholar
|


