
|
|
1.IntroductionFrequency domain optical coherence tomography (FD-OCT) has emerged as a promising modality for morphological imaging.1 Nevertheless, standard FD-OCT systems suffer from a limited useful depth range on top of their limit on penetration depth in scattering media, first because only half of the potential depth range can be used due to the presence of complex conjugate artifacts, and second because there is a continuous fall-off in sensitivity with distance from the zero delay.2 The limiting factor for the depth range is the coherence length of the individual spectral measurements, defined either by the optics and pixel count of the spectrometer or by the instantaneous linewidth of a tunable laser. For the deeper penetration wavelength range of , tunable lasers currently permit a longer scan range.3 Therefore, only specialized sources can satisfy the demand at higher complexity and cost, while reducing the scanning speed,4 due to the significant mismatch between the signals obtained from the anterior and posterior structures of the eye, depending on which is positioned closer to the zero delay. Dispersion-encoded full range (DEFR) was introduced as a method of doubling the depth range of spectrometer-based FD-OCT by numerically removing the complex conjugate mirror term using the asymmetry of the spectral phase caused by dispersion imbalance,2, 5 rather than splitting the detection pathway6 or adding multiple channels. Implementation of this algorithm to tunable light sources has the potential to keep the complexity of the system low and helps to reduce costs by doubling the measurement range in independent depth scans without additional detection components. However, the low phase stability due to the sequential spectral detection might influence the phase-sensitive DEFR algorithm. 1.1.Measurement of Intraocular Distances in Genetic StudiesThe mouse is an important model for studies of the mammalian visual system because of the tremendous range of murine genetic and genomic resources available.7, 8 Methods to reliably quantify the size and shape of the eye or its component parts at high precision and reproducibility are of particular interest to researchers studying ocular development and its relationship to eye conditions such as myopia and glaucoma. Historically, techniques such as histological sectioning have been the mainstay for studies of ocular component dimensions in the mouse.9 However, because each of the histological tissue preparation steps of fixation, embedding, and sectioning can lead to shrinkage, swelling, or deformation of the eye and is incompatible with longitudinal studies in the subject per se, there has been intense research interest in finding less invasive alternative techniques that preferably do not irreversibly alter the morphology.10 Of these, ultrasonography,11 magnetic resonance imaging (MRI),12 video imaging,13 and laser micrometry14 have all proven valuable methods for the in vivo examination of mouse eyes, although each technique has its own relative advantages and disadvantages. For example, MRI can provide 2-D cross-sectional scans through the mouse eye at resolution, but the scans take several minutes to perform.12 Ultrasonography11 suffers from limited resolution , while video imaging and laser micrometry need to be performed ex vivo rather than in vivo. 1.2.Optical Measurements of the Eye Length of Small RodentsIn 2004, an improved device based on optical low-coherence interferometry (OLCI) of the intraocular distances along the optical axis was reported for in vivo biometry of the mouse eye: the ACMaster (Carl Zeiss Meditec, Germany), a time-domain low-coherence interferometer that performs one depth scan at precision in (Ref. 15). However, because the reflection from the posterior lens surface was infrequently detected, measurement of lens thickness (LT) and vitreous chamber depth (VCD) with this instrument were obtained from only a proportion of the animals phenotyped, and it did not allow for precise angular alignment. Furthermore, changes of the different surface positions within an individual measurement caused by the high breathing rate and pulsation with an amplitude in the range of multiple tens of micrometers could not be evaluated by the technology due to the sequential scanning utilized by time-domain white-light interferometry. All of these factors severely deteriorated effective precision, repeatability, and day-to-day reproducibility. Zhou 16 developed a purpose-designed instrument that improved on the ACMaster by combining time-domain optical coherence tomography (TD-OCT) with a stepper-motor system in order to produce planar “optical sections” (B-scans) through the entire mouse eye. This approach has high potential to overcome the issue of corneal irregularities frequently found in these small rodents, which can heavily offset results when only a specific depth scan is selected. However, the device suffered from a modest signal-to-noise ratio (SNR) and a slow acquisition speed . Here, we demonstrate for the first time successful application of DEFR to swept-source OCT (SS-OCT), despite the significantly lower phase stability of tunable lasers compared to spectrometer based systems, thereby circumventing the need for multiple high-resolution detection channels, and report an instrument that is capable of imaging longitudinal cross sections of the mouse eye with a speed of 28,000 depth-scans/s for high throughput, reproducible in vivo ocular biometry at high axial resolution and precision. 2.Materials and Methods2.1.Tunable Light Source, Low-Coherence Interferometer, and OCT SystemFigure 1 shows a schematic diagram of the OCT system. The light source was a wavelength-tunable laser (HSL-1000, Santec, Japan) with a center wavelength of and monodirectional scanning range of (flat-top shaped) operating at a speed of with output power. The weaker output of a coupler was sent to a free-space Michelson interferometer to generate a phase-modulated signal for dynamically calibrating the spectrum. 80% of the stronger output propagated through a fiber-optic Mach-Zehnder interferometer with a sample arm comprising a circulator, a collimator, a galvonometer mirror pair for crosshair-type scanning [Thorlabs; Fig. 1], and a telecentric objective to image the anterior segment with the pivot point at the retina and focus slightly anterior of the lens center [Fig. 1] with , which conforms to the ANSI eye-safety criterion for human subjects.17 In the reference arm, a coupler was used instead of a circulator to retrieve the light, which was collimated and thereafter reflected by a mirror. Light returning from the sample and reference arms were combined by a coupler and generated interference spectral signals , which were detected by an InGaAs balanced receiver (1817-FC, Newfocus, Santa Clara, California). The output voltage was processed by a signal conditioning chip (LT6600-20, Linear Technology, Milpitas, California) comprising a fully differential amplifier and a low-pass filter with cut-off frequency. Polarization dispersion was adjusted for maximal fringe visibility by polarization control paddles. The optical path asymmetry of the sample and reference arm resulted in considerable dispersion mismatch. We measured dispersion diversity (ratio of maximum conjugate signal to maximum signal peak5). The phase signal and the interference spectral signals for imaging were digitized synchronically by a AD conversion board (ATS 660, AlazarTech, Pointe-Claire, QC, Canada) with the internal sampling clock set to and 2048 samples in depth. Both data acquisition and real-time preview were performed with a custom LabView program. Fig. 1(a) Schematic diagram of swept-source OCT system. TL, tunable laser; FSMI, free-space Michelson interferometer; PD, photodetector; BR, balanced receiver; Cr, circulator; C1, coupler; C2, coupler; C3, C4, coupler; Col, collimator; M, mirror; S, sample; GM, galvo mirror; TO, telecentric objective; SCC, signal conditioning chip; PC, polarization control paddle. (b) Cross scanning pattern, and (c) optical path of the probe beam in the eye.  2.2.Full-Range Extraction by Dispersion EncodingOur off-line post-processing first mapped the sampling clock from time space to nonlinear -space via Hilbert transformation of the phase signal. Thereafter, the synchronous spectral signals were up-sampled and rescaled into linear -space by interpolation, followed by background subtraction and spectrum reshaping. The resampling function also describes the nonlinearity of the depth measurement and was obtained utilizing a translation stage in a free-space interferometer configuration using 21 equally spaced depth positions across the full depth range with positioning accuracy. A final full-range OCT image was generated by the fast DEFR algorithm5 with 20 iterations. Off-line post-processing took for a tomogram with (HP xw4600 Workstation, Intel dual-core processor, RAM). The measured sensitivity of the instrument was at the zero delay position, measured by a neutral density filter keeping the focal plane with a sensitivity fall-off to at and at (central ) of the depth range. The measured axial resolution within depth was in air. The transversal resolution and the depth of field of the telecentric objective were and , respectively, which was achieved in the focal plane, typically positioned at the anterior lens surface. At the cornea, the beam size was estimated to have a diameter of approximately . The center of the peak can be detected by the same fitting method used for the biological samples (described later), with an axial precision of , without the need for higher up-sampling. Tests with a phantom (polished glass plate with parallel surfaces of thickness and a group refractive index of 1.51872, originating from a Zeiss ACMaster) resulted in a reproducibility of the thickness measurement of after successive mis- and realignment of the sample. This glass plate was employed as a standard with fixed optical path length for system calibration before experimental measurement. 2.3.Positioning of SubjectsAll experimental procedures involving animals complied with UK Home Office regulations. Female mice from a pigmented strain (C57BL/6) and an albino strain (MF1) at age of were obtained from Harlan Ltd (Oxon, UK). Mice were anesthetized and positioned on a custom-designed stage that allowed the eye to be centered using a five-axis positioning system. Fine alignment of the eye was achieved by examining simultaneous, real-time cross sections (frames) of 512 depth-scans (A-lines) through the eye in the horizontal (H) and vertical (V) meridians. A fast single-iteration DEFR was implemented for the real-time preview in per tomogram. Once the eye was centered, an alternating series of 50 H-meridian and 50 V-meridian scans were recorded. Optically, the telecentric scan was affected by the cornea and lens, which resulted in image magnification for the deeper eye structures in the H and V axes, permitting visualization of the whole cornea and the bulk of the lens, in reference to a central point located approximately on the retina (hence, the retina appeared without curvature; Fig. 2 ). Fig. 2(a) to (d) Cross section in the horizontal meridian of the right eye of an -old MF1 mouse. Image size: . Images were generated with (a) iFFT (arrows indicate conjugate artifacts); (b) 1 iteration of DEFR; and (c) 20 iterations of DEFR. (d) Averaged image from a series of 50 images as (c) (arrow indicates residual conjugate artifacts). (e) AL is defined as the distance from the corneal apex to the RPE. The curves denoting the ACS and RPE were fitted using a four-order polynomial function (white/black lines). (f) The normalized intensity of images reconstructed with (dark) and without (bright shade, amplified in respect to DEFR signal) DEFR along the axial direction through the corneal apex plotted on a logarithmic scale. ACS: anterior cornea surface; PCS: posterior cornea surface; ALS: anterior lens surface; PLS: posterior lens surface; ILM: internal limiting membrane; RPE: retina pigment epithelium.  3.Results3.1.Imaging of the Mouse EyeA plane scan in the horizontal meridian of an albino (MF1) mouse right eye is shown in Fig. 2, with the zero delay [denoted by a dashed line in Fig. 2] located in the eye lens. The intensity of the image is scaled by a logarithmic gray scale. The high light transmission through the iris of albino mice provided wide-field views of the crystalline lens, whereas the iris blocked light transmission in the pigmented mice, giving a narrower view despite the lower influence of scattering at . Figure 2 shows an image directly reconstructed from dispersion-compensated spectra via inverse fast Fourier transform (iFFT). Dispersion compensation was achieved numerically by multiplying the spectra with a wavelength-dependent phase term.18 Although the entire length of the eye is visualized, the image is compromised by the presence of “double-dispersed” conjugate components (indicated by arrows). Most noticeably, the posterior lens surface is covered by the conjugate artifact of the cornea. Figure 2 shows the image generated by fast DEFR after a single iteration, as used for real-time previews. Such images proved sufficient for precise alignment of the imaging system along the optical axis of the mouse eye. The image produced after 20 iterations of the DEFR algorithm is shown in Fig. 2. Complex conjugate artifacts were suppressed by , without reducing sensitivity and axial resolution. In this figure, the suppression of conjugate artifacts extends over the entire -axis range, providing clear views of the cornea, lens, and retina. For Fig. 2, the image was further enhanced by averaging a series of frames acquired in less than . Prior to the averaging operation, the image series was digitally registered with a resolution of to eliminate motion artifacts during data acquisition.19 The arrow in Fig. 2 indicates residual conjugate artifacts arising from the skin, which scatters light strongly. Further suppression of this artifact might be obtained with greater dispersion diversity in the OCT system.5 3.2.Surface Detection and Extraction of Intraocular DistancesThe high contrast of the resulting images enabled efficient automated feature segmentation employing a Canny edge detector at the surfaces of the cornea and the vitreoretinal interface, and a peak detector at the surfaces of the lens and the retinal pigment epithelium (RPE) layer. A value of was used to compensate the position shift induced by edge detection compared to peak detection (based on average measurements in phantoms). Boundaries were fitted using a fourth-order polynomial. An advantage of the curve-fitting method is its robustness against local noise, surface irregularities, or artifacts (e.g., specular reflection at the corneal apex) with the ability to achieve subresolution precision. The axial length (AL) of eye was defined as the distance in the axial direction from the fitted anterior corneal surface (ACS) to the fitted RPE layer [curves in Fig. 2], along the -axis position defined by the corneal apex [vertical line in Fig. 2]. The signal intensity along the -axis (depth) direction through the corneal apex is shown in Fig. 2, in which peaks corresponding to the boundaries are recognizable but blurred in the original image (bright-shaded curve) and clearly reconstructed by DEFR (dark region). DEFR not only rejects the unwanted conjugate artifacts but also utilizes this signal, thereby increasing the signal to noise. Axial intraocular distances were calculated using the refractive indices listed in Table 1 .20 Table 1Reproducibility of axial biometry measurements (mean and standard deviations for a set of 10 pigmented mouse eyes, given in μm ). Refractive index of tissue: n ; average thickness of tissue: davg ; measurement precision when comparing vertical and horizontal scans: pH-V ; reproducibility after mis- and realignment: rre-al ; and day-to-day reproducibility: rd2d . Axial length was calculated as either the sum of the intraocular distances, or calculated using a group refractive index for the whole eye (Ref. 15).
Image registration identified a cyclic axial shift of the eye with time [Fig. 3 ], which would heavily offset any slow axial measurement—as would occur for all previously described noninvasive mouse ocular biometry instruments—by up to . The frequency of the cyclic axial shift was approximately , which corresponds closely to the respiration rate of mice (typically, ). Identification of this up to oscillation with the animal under general anesthesia demonstrates the potential of high-speed imaging for in vivo biometry in mice. Fig. 3(a) Cyclic image shift in the axial (depth) direction corresponding to the subject’s breathing. (b) Difference versus mean plot of mouse AL measured on two consecutive days for 10 pigmented (solid circles) and 5 albino (open circles) mouse eyes. The dashed lines indicate the 95% limits of agreement. 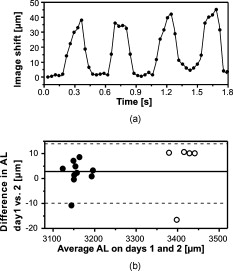 4.DiscussionA sample of mice from any specific strain will typically have axial lengths within a range of . Therefore, for longitudinal studies and for genetics/genomics research in mice, the level of day-to-day reproducibility of ocular biometry measurements needs to be of the order of or less.15, 21 Day-to-day reproducibility is affected by both the precision and long-term stability of the biometry system and by the reliability with which eyes can be repositioned for measurement. To evaluate the repeatability of our system, preliminary experiments were conducted on a sample of 10 pigmented mice (these mice being chosen in preference to albinos, since the restricted view of the crystalline lens made the eye alignment and image segmentation more challenging than in albino mice). Eyes were measured on two consecutive days. On each day, the eyes were measured twice within a three-minute interval, and the AL calculated as the mean value from the four available measurements ( , ), as shown in Table 1. The reproducibility of the two H-scans versus the two V-scans was found to be (approximately threefold greater than the test–retest reproducibility for the glass phantom). The most likely sources of error for the H-versus V-scan comparison are from curve-fitting, due to surface irregularities, or from asymmetric alignment of the eye. AL measurements were also highly reproducible from day to day [Fig. 3], showing a Pearson correlation coefficient of 0.998 and a mean difference of ( deviation). There was a highly significant difference in AL between the two strains (pigmented strain C57BL/6 , albino strain MF1 , -test). Similar differences in AL have been previously noted between mouse strains21 and have been attributed to genetic differences that influence eye development. The AL measured here for C57BL/6 mice agrees well with the value calculated using the regression equation of Schmucker and Schaeffel20 , which they developed by estimating AL using an independent technique—measurements from frozen sections—in C57BL/6 mice at a range of ages. Translating the developments made here into a device capable of 2-D or 3-D biometry in human eyes (AL compared to in mouse) would require a swept-source laser with both long coherence length (narrow instantaneous line width) and high speed. Continued advances in the performance of tunable lasers should make this feasible in the future. 5.ConclusionsIn conclusion, we have demonstrated a high-speed frequency domain OCT instrument for in vivo imaging of the mouse eye and a method for simultaneous high-accuracy biometry of all axial intraocular distances. This instrument is able to utilize the full unrestricted depth range without a compromise in hardware cost and phase stability by virtue of the DEFR algorithm. It has excellent -scale repeatability and reproducibility, avoids offsets induced by breathing or pulsation, and displays high robustness to eye motion for ocular biometry in the eyes of anesthetized mice. This approach might make fixation and the use of anesthetics expendable at even higher frame rates or by utilizing more complex image correction algorithms that dynamically adjust for motion and distortions that occur during the recording of the frame sequence. Besides application for different small animal eyes, in this particular application, DEFR technology has great potential to double the depth range and improve image quality at low cost in the majority of OCT systems. AcknowledgmentsThe authors thank Boris Hermann, Aneesh Alex, and Vedran Kajic from the School of Optometry and Vision Sciences, Cardiff University, for helpful assistance. This project is supported by the Marie Curie Research Training Network “MY EUROPIA” (MRTN-CT-2006-034021) and in part by the BBSRC, Cardiff University, DTI Grant (OMICRON), AMR Grant (AP1110), European Union Project FUN OCT (FP7 HEALTH, Contract No. 201880), and CARL ZEISS Meditec, Inc. ReferencesW. Drexler and J. G. Fujimoto, Optical Coherence Tomography: Technology and Applications, Springer, New York
(2008). Google Scholar
B. Hofer, B. Považay, B. Hermann, A. Unterhuber, G. Matz, and W. Drexler,
“Dispersion encoded full range frequency domain optical coherence tomography,”
Opt. Express, 17 7
–24
(2009). https://doi.org/10.1364/OE.17.000007 1094-4087 Google Scholar
M. Yamanari, Y. Lim, S. Makita, and Y. Yasuno,
“Visualization of phase retardation of deep posterior eye by polarization-sensitive swept-source optical coherence tomography with probe,”
Opt. Express, 17 12385
–12396
(2009). https://doi.org/10.1364/OE.17.012385 1094-4087 Google Scholar
C. H. Chong, T. Suzuki, K. Totsuka, A. Morosawa, and T. Sakai,
“Large coherence length swept source for axial length measurement of the eye,”
Appl. Opt., 48 D144
–D150
(2009). https://doi.org/10.1364/AO.48.00D144 0003-6935 Google Scholar
B. Hofer, B. Považay, A. Unterhuber, L. Wang, B. Hermann, S. Rey, G. Matz, and W. Drexler,
“Fast dispersion encoded full range optical coherence tomography for retinal imaging at and ,”
Opt. Express, 18 4898
–4919
(2010). https://doi.org/10.1364/OE.18.004898 1094-4087 Google Scholar
B. Grajciar, M. Pircher, C. K. Hitzenberger, O. Findl, and A. F. Fercher,
“High sensitive measurement of the human axial eye length in vivo with Fourier domain low coherence interferometry,”
Opt. Express, 16 2405
–2414
(2008). https://doi.org/10.1364/OE.16.002405 1094-4087 Google Scholar
J. M. Collinson, R. E. Hill, and J. D. West,
“Analysis of mouse eye development with chimeras and mosaics,”
Int. J. Dev. Biol., 48 793
–804
(2004). https://doi.org/10.1387/ijdb.041885jc 0214-6282 Google Scholar
E. E. Geisert, L. Lu, N. E. Freeman-Anderson, J. P. Templeton, M. Nassr, X. Wang, W. Gu, Y. Jiao, and R. W. Williams,
“Gene expression in the mouse eye: an online resource for genetics using 103 strains of mice,”
Mol. Vis, 15 1730
–1763
(2009). 1090-0535 Google Scholar
R. S. Smith, J. P. Sundberg, and S. W. M. John, Systematic Evaluation of the Mouse Eye: Anatomy, Pathology, and Biomethods, CRC PressBoca Raton, FL,2002). Google Scholar
N. Eter,
“Molecular imaging of the eye,”
Br. J. Ophthamol., https://doi.org/10.1136/bjo.2009.158105 0007-1161 Google Scholar
A. S. Brown, M. Y. Zhang, V. Cucevic, C. J. Pavlin, and F. S. Foster,
“In vivo assessment of postnatal murine ocular development by ultrasound biomicroscopy,”
Curr. Eye Res., 30 45
–51
(2005). https://doi.org/10.1080/02713680490894315 0271-3683 Google Scholar
T. V. Tkatchenko, Y. Shen, and A. V. Tkatchenko,
“Analysis of postnatal eye development in the mouse with high-resolution small animal magnetic resonance imaging,”
Invest. Ophthalmol. Visual Sci., 51 21
–27
(2010). https://doi.org/10.1167/iovs.08-2767 0146-0404 Google Scholar
V. A. Barathi, V. G. Boopathi, E. P. Yap, and R. W. Beuerman,
“Two models of experimental myopia in the mouse,”
Vision Res., 48 904
–916
(2008). https://doi.org/10.1016/j.visres.2008.01.004 0042-6989 Google Scholar
J. Wisard, M. A. Chrenek, C. Wright, N. Dalal, M. T. Pardue, J. H. Boatright, and J. M. Nickerson,
“Non-contact measurement of linear external dimensions of the mouse eye,”
J. Neurosci. Methods, 187 156
–166
(2010). https://doi.org/10.1016/j.jneumeth.2010.01.006 0165-0270 Google Scholar
C. Schmucker and F. Schaeffel,
“In vivo biometry in the mouse eye with low coherence interferometry,”
Vision Res., 44 2445
–2456
(2004). https://doi.org/10.1016/j.visres.2004.05.018 0042-6989 Google Scholar
X. Zhou, J. Xie, M. Shen, J. Wang, L. Jiang, J. Qu, and F. Lu,
“Biometric measurement of the mouse eye using optical coherence tomography with focal plane advancement,”
Vision Res., 48 1137
–1143
(2008). https://doi.org/10.1016/j.visres.2008.01.030 0042-6989 Google Scholar
A. N. S. Institute,
“American National Standard for safe use of lasers ANSI Z136.1-2000,”
(2000) Google Scholar
A. F. Fercher, C. K. Hitzenberger, M. Sticker, R. Zawadzki, B. Karamata, and T. Lasser,
“Numerical dispersion compensation for partial coherence interferometry and optical coherence tomography,”
Opt. Express, 9 610
–615
(2001). https://doi.org/10.1364/OE.9.000610 1094-4087 Google Scholar
M. Guizar-Sicairos, S. T. Thurman, and J. R. Fienup,
“Efficient subpixel image registration algorithms,”
Opt. Lett., 33 156
–158
(2008). https://doi.org/10.1364/OL.33.000156 0146-9592 Google Scholar
C. Schmucker and F. Schaeffel,
“A paraxial schematic eye model for the growing C57BL/6 mouse,”
Vision Res., 44 1857
–1867
(2004). https://doi.org/10.1016/j.visres.2004.03.011 0042-6989 Google Scholar
O. Puk, C. Dalke, J. Favor, M. H. de Angelis, and J. Graw,
“Variations of eye size parameters among different strains of mice,”
Mammalian Genome, 17 851
–857
(2006). https://doi.org/10.1007/s00335-006-0019-5 Google Scholar
|


