|
|
1.IntroductionTympanic membrane (TM) is the first component in the middle ear mechanical conduction system for sound transmission. It is a very thin membrane composed of three layers: external stratified epithelium, middle fibrous connective tissue, and internal epithelium. The external stratified epithelium is composed of several layers of cells. The middle fibrous layer is composed of fibroblasts, collagen fibrils, blood vessels, and lymphatics. The internal epithelium is composed of a single layer of cells. The collagen framework is arranged into external radial and internal nonradial layers.1, 2, 3 Sound from the air vibrates the TM, which leads to motion of the auditory ossicles in the middle ear cavity. Animal and mathematical models have been used for research of sound conduction in the past. To understand the mechanisms of the middle ear in mathematical models, the relevant system parameters (thickness and shape of the TM, damping, elasticity and geometry of the ossicles, etc.) are necessary. 3D spatial information of the TM is essential for further functional studies of the middle ear.4, 5 In clinical disease diagnoseis, biopsy is traditionally recognized as the gold standard. However, biopsy requires the removal, fixation, and staining of the tissues or cells. Such histological procedures are not only time consuming but also invasive and painful. Additionally, the histological preparation might cause a decrease in the thickness of the central region of the TM from 16 to 35%, depending on the position within the TM.6 Most importantly, biopsy of the TM can risk hearing loss. Therefore, a noninvasive in-vitro or in-vivo optical virtual biopsy, which can provide highly penetrative 3-D images with a submicron spatial resolution, and also provide information about the change of TM resulting from disease processes, is desired. Higher harmonic generation microscopy (HGM) can provide a noninvasive biopsy tool with excellent 3-D spatial resolution because of its virtual transition and nonlinear characteristics.7, 8 Harmonic generation itself is known to deposit no energy in the matter with which it interacts because of the energy-conservation characteristics of the generation. The generated second harmonic generation (SHG) and third harmonic generation (THG) intensities depend on the square and cube of the incident light intensity, respectively. Similar to the multiphoton-induced fluorescence process, this nonlinear dependence allows localized excitation and is ideal for intrinsic optical sectioning in scanning laser microscopy. SHG and THG signals can be acquired simultaneously with backward collection geometry (epidetection mode) without the need of exogenous contrast agents.9, 10 Thus, it is suitable for in-vivo observation.11, 12 The purpose of this study is to demonstrate the feasibility of using nonlinear optical imaging as a means of virtual biopsy. Backward-collected (epi)-SHG and THG were used to image excised rat TM. 2.MethodsOne healthy rat (Wistar) weighing about was used. The rat was euthanized by an overdose of anesthetic (phenobarbital) injected into the peritoneum, and immediately decapitated. The ear was determined to be free from middle ear infections and was pristine and transparent. The right TM was used and prepared similar to the method described in recent studies.6, 13 However, we did not dissect the TM out of its surrounding bone. The whole middle ear with intact tympanic membrane and surrounding bone was observed in this study. Thus, the intact membrane was observed under conditions that are close to a natural situation. The whole excised middle ear with intact tympanic membrane was rinsed in phosphate buffered solution for hydration during imaging. The experiment procedure was reviewed and approved by the Institutional Animal Care and Use Committee in National Taiwan University Hospital. The study of the harmonic generation microscopy of fresh intact rat tympanic membrane was performed using a home-built femtosecond Cr:forsterite laser centered at with a pulse width and a repetition rate.10, 14 The spectral full width half maximum of the laser output was . The infrared laser beam was first shaped by a telescope and then directed into a modified beam scanning system (Olympus Fluoview300) and an upright microscope (Olympus BX-51). An infrared (IR) water-immersion objective (Olympus LUMplanFL/IR 60×/NA 0.9/working distance ) was used to focus the laser beam into the observed specimen. The observed specimen was mounted on the microscope stage. The generated epi-SHG and epi-THG signals were collected using the same objective used to focus the laser beam. A chromatic beamsplitter [Chroma Technology (Rockingham, Vermont) 865dcxru] was used to direct the backward SHG and THG signals into a home-built photon detection system. In this photon detection system, the backward SHG and THG were separated by another chromatic beam splitter (Chroma Technology 490DRXR) and detected by two separate photomultiplier tubes (PMTs) (Hamamatsu R4220P for THG and Hamamatsu R943-02 for SHG) with (THG) and (SHG) narrow-band interference filters (Chroma Technology D410/10× and D615/10×). An average illumination power of was applied to the sample surface during the study. The excised rat middle ear was placed on the microscope stage with the external surface of the eardrum facing upward to the objective lens to mimic the in-vivo condition. The adopted scanning rate of Fluoview300 was , or about four frames per second for one resolution image with a field of view. By moving the axial position of the stage, about 200 frames were acquired to obtain a 3-D imaging slab covering the whole depth of the tympanic membrane. Since the spatial step size (around ) was much greater than the THG lateral resolution (around 12, 15), higher spatial resolution could be easily achieved in the future with a finer step size during the scan. Low resolution was applied just to mimic the future clinical situation for much reduced acquisition time. Scanning was repeated after lateral translation of the motorized microscope stage. The 3-D image of the whole tympanic membrane can be obtained by combining all imaging blocks. 3.ResultsFigure 1 is a photograph of the rat TM used in this study. The TM was not excised from the surrounding bone. The TM can be devided into two parts (pars flaccida and pars tensa). Figure 2 shows the obtained virtual biopsy image of pars tensa from SHG and THG microscopy. THG reveals the spatial structure of the external epithelial layer16 as well as the radial collagen fibers in the middle fibrous layer. Both the radial and circular collagen fibers in the middle fibrous layer were revealed by epi-SHG.17 Figure 3 , from the peripheral portion of pars tensa, shows red blood cells in the capillaries of the middle fibrous layer. The imaging features of red blood cells, capillaries, and epithelial cells are similar to those found in oral mucosa and skin from our previous studies of harmonic generation microscopy.10, 11, 12 Fig. 1A photograph of the rat TM used in this study. The TM was not excised from the surrounding bone. The manubrium of the malleus (arrow) can be seen on the central part of the TM. The two parts of the TM (pars flaccida and pars tensa) were labeled. Scale bar: . 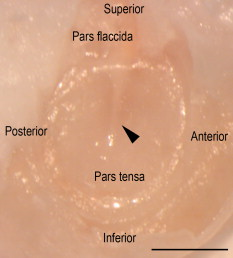 Fig. 23-D harmonic generation microscopy “virtual biopsy” images obtained from pars tensa of the tympanic membrane. THG is shown by pink and SHG is shown by green. THG is sensitive to the region of inhomogeneity, and thus it can provide the interface information and reveal the structure of outer epithelial layers as well as the middle radial collagen fibers. SHG arises from noncentrosymmetry and highly organized nanostructures; middle collagen fibers in tympanic membrane provide strong SHG contrast. (a) Horizontal section of external stratified epithelium shows cells (arrow) in the epithelium. (b) Horizontal section of middle fibrous connective tissue layer shows radial and circular fibers (arrows). There are SHG signals from both radial and circular fibers. The radial fibers in the middle fibrous layer also have a strong THG signal. (c) Cross sectional reconstructed image of whole thickness of tympanic membrane, and (d) magnified image of central portion of (c) shows strong THG signals from external stratified epithelium. The radial fibers (pink color) in the middle fibrous layer are interconnected and arranged in a chain shape (arrow). Scale bar: . (Color online only.) 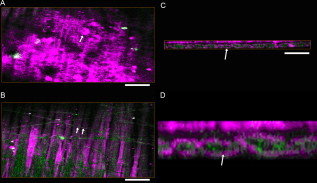 Fig. 3Horizontal section of one portion of middle fibrous connective tissue layer. THG revealed red blood cells (arrows) in capillaries. Scale bar: . (Color online only.) 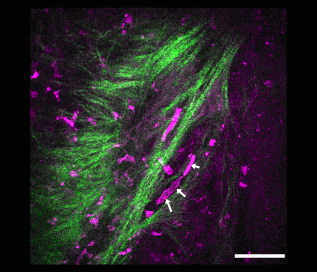 Figure 4 shows an axial image of pars tensa using the multiharmonic generation microscope. The cross section of the TM is displayed as the white, curved band. In Fig. 4, the upper surface is the external surface and the lower surface is the medial surface. The thickness of the membrane was measured by using the full width at half maximum (FWHM) of the intensity profile taken perpendicularly through the cross section from the upper surface toward the lower surface. The TM is very thin for the large part, only about . The pars flaccida is thicker than the pars tensa. The membrane is thickest around the peripheral region, becomes gradually thinner when moving inward, remains at an almost constant small value in the middle zone, and finally thickens again toward the manubrium of the malleus. Fig. 4A complete scan of the cross section of a right rat TM. The scan was obtained by aligning 200 axial images, each wide. Scale bar: . 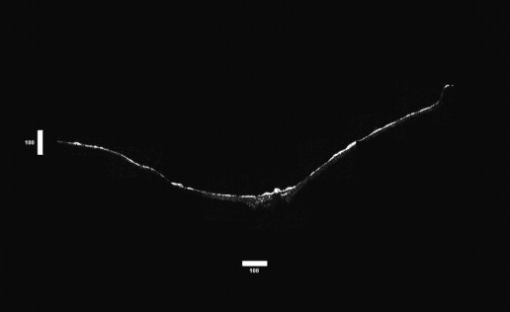 Figure 5 reveals the potential to image a large area of TM. By computer reconstruction of consecutive imaging blocks, a reconstructed 3-D image of the whole TM can be obtained. The 3-D relationship to the adjacent bony structure, spatial variation in curvature, and thickness can all be studied by this method. The plot shows a gradual increase in the thickness in the central region from the inferior to the superior region, and the thickness of TM was small relative to the diameter perpendicular to the manubrium of the malleus. The TM is thinnest in the central inferior region. The normal conical shape of the TM can also be clearly visualized. Fig. 53-D reconstructed image of the whole tympanic membrane. The thickness profile of the tympanic membrane was presented using a color map and the unit in this map is in micrometers. The central portion of the membrane is depressed because it attached to the underlying manubrium of the malleus, a small ossicle in the middle ear cavity. The normal conical shape of the intact tympanic membrane can be clearly visualized by this image. The size of the scale bar is . (Color online only.) 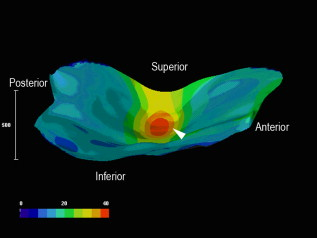 4.DiscussionIn this study, we confirmed that this method is capable of accurately resolving the minimum thickness of in the rat eardrum with a high axial resolution around . A remarkable finding in this study is that the rat TM is very thin for the large part, only about . We also found that the pars flaccida is thicker than the pars tensa. Membrane thickness varies with position: the membrane is thicker from the center to the peripheral edge and close to a recent study of rat TM thickness of .18 In addition, the thickness map constructed in this study shows that the membrane is thickest around the peripheral region, becomes gradually thinner when moving inward, remains at an almost constant small value in the middle zone, and finally thickens again toward the manubrium of the malleus. The thickness distribution of TM has been studied by Kuypers in fresh conditions by the use of the optical sectioning capability of a confocal microscope.6, 13 However, a special dye (Van Gieson dye) was required to stain the collagen in the tympanic membrane, and the membrane had to be flattened and dissected from its surrounding bone, as the lens used had a working distance limited to . This method is not suitable for in-vivo study, and the histological three-layered structure of the eardrum as well as the global 3-D shape of the membrane cannot be resolved. Acute otitis media (AOM) is a very common childhood disease. Collagen organization of the TM is modified during the inflammatory stage and the healing process.19 Radial collagen fibers in the TM play an important role in the conduction of sound above .20 Collagen orientation of human cadaver tympanic membranes has been studied meticulously by Jackson using multiphoton microscopy.21 However, the membrane also had to be flattened and dissected from its surrounding bone, as the depth of field of its multiphoton microscopy is . Our study confirms that our method could provide information on the collagen framework in the middle fibrous layer of TM without the use of fluorescence and exogenous markers. In-vivo evaluation of the TM structure and pathology will be possible in the future using harmonic generation imaging by integrating an endoscope system. Besides the role of noninvasive diagnosis of TM disease, high harmonic generation microscopy may aid the surgeon to perform myringotomy. Myringotomy is a common surgical procedure for treating middle ear infection. In this procedure, a small incision is made on the TM to drain pus from the middle ear cavity. We propose that harmonic generation microscopy can guide the myringotomy procedure by identifying the orientation of the supporting radial collagen fibrils. The surgical section should be parallel to the radial collagen fibrils. In this way, the damage to the TM during surgery can be minimized. Our study demonstrates the feasibility of using a noninvasive optical imaging system12 for comprehensive evaluation and possible surgical guidance of the TM. 5.ConclusionIn summary, harmonic generation microscopy can noninvasively evaluate the anatomy of TM in distinguishing external epithelium and middle fibrous layers of intact tympanic membrane clearly. The spatial arrangement of radial and circular collagen fibrils can be observed. The capillary and red blood cells in the middle fibrous layer are noted. The 3-D relationship to adjacent bony structures and spatial variations in thickness and curvature can also be obtained. Epi-mode harmonic generation microscopy may enable in-vivo virtual biopsy to aid in the pathological evaluation of the TM. AcknowledgmentsThis work was supported by grants from the National Health Research Institute of Taiwan through NHRI-EX98-9201EI, NTU Center for Medical Excellence, NTU grant 98R0334, the Buddhist Tzu Chi General Hospital (TCRD 9703 and 9704), and the National Science Council (NSC 97-2314-B-002-150-MY2) of Taiwan. ReferencesF. R. Johnson, R. M. McMinn, and G. N. Atfield,
“Ultrastructural and biochemical observations on the tympanic membrane,”
J. Anat., 103
(pt 2), 297
–310
(1968). 0021-8782 Google Scholar
D. J. Lim,
“Structure and function of the tympanic membrane: a review,”
Acta Otorhinolaryngol. Belg., 49
(2), 101
–115
(1995). 0001-6497 Google Scholar
K. Magnuson, S. Hellström, and B. Magnuson,
“Structural changes in the rat tympanic membrane following repeated pressure loads,”
Eur. Arch. Otorhinolaryngol., 252
(2), 76
–82
(1995). https://doi.org/10.1007/BF00168024 0937-4477 Google Scholar
M. Gaihede, D. Liao, and H. Gregersen,
“In vivo areal modulus of elasticity estimation of the human tympanic membrane system: modelling of middle ear mechanical function in normal young and aged ears,”
Phys. Med. Biol., 52
(3), 803
–814
(2007). https://doi.org/10.1088/0031-9155/52/3/019 0031-9155 Google Scholar
C. F. Lee, P. R. Chen, W. J. Lee, J. H. Chen, and T. C. Liu,
“Three-dimensional reconstruction and modeling of middle ear biomechanics by high-resolution computed tomography and finite element analysis,”
Laryngoscope, 116
(5), 711
–716
(2006). https://doi.org/10.1097/01.mlg.0000204758.15877.34 0023-852X Google Scholar
L. C. Kuypers, J. J. Dirckx, W. F. Decraemer, and J. P. Timmermans,
“Thickness of the gerbil tympanic membrane measured with confocal microscopy,”
Hear. Res., 209
(1–2), 42
–52
(2005). https://doi.org/10.1016/j.heares.2005.06.003 0378-5955 Google Scholar
C. K. Sun, C. C. Chen, S. W. Chu, T. H. Tsai, Y. C. Chen, and B. L. Lin,
“Multiharmonic-generation biopsy of skin,”
Opt. Lett., 28
(24), 2488
–2490
(2003). https://doi.org/10.1364/OL.28.002488 0146-9592 Google Scholar
C. K. Sun, S. W. Chu, S. Y. Chen, T. H. Tsai, T. M. Liu, C. Y. Lin, and H. J. Tsai,
“Higher harmonic generation microscopy for developmental biology,”
J. Struct. Biol., 147
(1), 19
–30
(2004). https://doi.org/10.1016/j.jsb.2003.10.017 1047-8477 Google Scholar
S. P. Tai, T. H. Tsai, W. J. Lee, D. B. Shieh, Y. H. Liao, H. Y. Huang, K. Y. J. Zhang, H. L. Liu, and C. K. Sun,
“Optical biopsy of fixed human skin with backward-collected optical harmonics signals,”
Opt. Express, 13
(20), 8231
–8242
(2005). https://doi.org/10.1364/OPEX.13.008231 1094-4087 Google Scholar
S. P. Tai, W. J. Lee, D. B. Shieh, P. C. Wu, H. Y. Huang, C. H. Yu, and C. K. Sun,
“In vivo optical biopsy of hamster oral cavity with epi-third-harmonic-generation microscopy,”
Opt. Express, 14
(13), 6178
–6187
(2006). https://doi.org/10.1364/OE.14.006178 1094-4087 Google Scholar
S. Y. Chen, H. Y. Wu, and C. K. Sun,
“In vivo harmonic generation biopsy of human skin,”
J. Biomed. Opt., 14
(6), 060505
(2009). https://doi.org/10.1117/1.3269676 1083-3668 Google Scholar
S. Y. Chen, S. U. Chen, H. Y. Wu, W. J. Lee, Y. H. Liao, and C. K. Sun,
“In vivo virtual biopsy of human skin by using noninvasive higher harmonic generation microscopy,”
IEEE J. Sel. Top. Quantum Electron., PP
(99), 1
–15
(2009). 1077-260X Google Scholar
L. C. Kuypers, W. F. Decraemer, J. J. J. Dirckx, and J. P. Timmermans,
“Thickness distribution of fresh eardrums of cat obtained with confocal microscopy,”
J. Assoc. Res. Otolaryngol., 6
(3), 223
–233
(2005). https://doi.org/10.1007/s10162-005-0001-z 1525-3961 Google Scholar
M. C. Chan, T. M. Liu, S. P. Tai, and C. K. Sun,
“Compact fiber-delivered Cr:forsterite laser for nonlinear light microscopy,”
J. Biomed. Opt., 10
(5), 054006
(2005). https://doi.org/10.1117/1.2060586 1083-3668 Google Scholar
T. H. Tsai, S. P. Tai, W. J. Lee, H. Y. Huang, Y. H. Liao, and C. K. Sun,
“Optical signal degradation study in fixed human skin using confocal microscopy and higher-harmonic optical microscopy,”
Opt. Express, 14
(2), 749
–758
(2006). https://doi.org/10.1364/OPEX.14.000749 1094-4087 Google Scholar
S. Y. Chen, H. C. Yu, I. J. Wang, and C. K. Sun,
“Infrared-based third and second harmonic generation imaging of cornea,”
J. Biomed. Opt., 14
(4), 044012
(2009). https://doi.org/10.1117/1.3183805 1083-3668 Google Scholar
S. W. Chu, I. H. Chen, T. M. Liu, C. K. Sun, S. P. Lee, B. L. Lin, P. C. Cheng, M. X. Kuo, D. J. Lin, and H. L. Liu,
“Nonlinear bio-photonic crystal effects revealed with multimodal nonlinear microscopy,”
J. Microsc., 208
(3), 190
–200
(2002). https://doi.org/10.1046/j.1365-2818.2002.01081.x 0022-2720 Google Scholar
G. Alzbutiene, A. Hermansson, P. Caye-Thomasen, and V. Kinduris,
“Tympanic membrane changes in experimental acute otitis media and myringotomy,”
Medicina (Kaunas), 44
(4), 313
–321
(2008). Google Scholar
K. Stenfeldt, C. Johansson, and S. Hellstrom,
“The collagen structure of the tympanic membrane: collagen types I, II, and III in the healthy tympanic membrane, during healing of a perforation, and during infection,”
Arch. Otolaryngol. Head Neck Surg., 132
(3), 293
–298
(2006). https://doi.org/10.1001/archotol.132.3.293 0886-4470 Google Scholar
K. N. O’Connor, M. Tam, N. H. Blevins, and S. Puria,
“Tympanic membrane collagen fibers: a key to high-frequency sound conduction,”
Laryngoscope, 118
(3), 483
–490
(2008). https://doi.org/10.1097/MLG.0b013e31815b0d9f 0023-852X Google Scholar
R. P. Jackson, C. Chlebicki, T. B. Krasieva, and S. Puria,
“Multiphoton microscopy imaging of collagen fiber layers and orientation in the tympanic membrane,”
Proc. SPIE, 6842 68421D
(2008). https://doi.org/10.1117/12.774353 0277-786X Google Scholar
|

