|
|
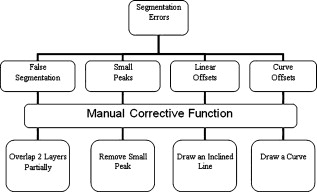
1.IntroductionOptical coherence tomography (OCT) is a relatively new imaging modality that can generate high-resolution and high-contrast cross sectional images of thin layers of biological tissue.1 This imaging system is based on the principle of optical low-coherence interferometry that measures the echo time delay and intensity of backscattered light and thus resolves the position of reflective or optical backscattering sites within a tissue sample.1, 2 To use OCT to quantitatively evaluate structural changes in the retina caused by a number of severe eye diseases, a segmentation-based determination of the thicknesses of the different intraretinal layers is required. Segmentation is an important component of OCT data processing, in which different intraretinal layers are identified and separated from each other. There are two main drawbacks with automated segmentation approaches. The first is that diseased retinal structure can vary substantially among patients. The structural disruption observed in these patients often produces artifacts to segmentation results. The other main drawback originates from inaccuracies in the data acquisition systems due to the noisy speckle field superimposed on imaged structures. Consequently, the intervention of a human operator is often needed to correct the segmentation result manually. In addition, an optimal user interface is usually lacking in the imaging applications of OCT devices to carefully review segmentation results and correct them if required. As a result, parameter outputs of some commercial OCT systems are often used without caution in retinal examinations by the ophthalmic community. Computer-aided manual correction of OCT segmentation can be useful for correcting thickness measurements in cases with errors of automated retinal boundary detection, and can also be useful for quantitative analysis of clinically relevant features, such as the volume of subretinal fluid and intraretinal fluid-filled regions.3 It is well known that detection algorithms fail when the retinal structure is disrupted by fluid accumulation, which can lead to inaccurate measurements of retinal thickness. Thus, there is a need for developing efficient, user-friendly software tools that will supplement accurate automated boundary detection algorithms to generate more precise segmentation of the various cellular layers of the retina. For instance, an interactive procedure could be activated, by means of which the user edits the segmentation directly or provides extra information to reconfigure the computational part. If the result generated by the computational part is wrong, the user can correct it directly using a manual editor. The commercial Stratus OCT (Carl Zeiss Meditec, Dublin, California) software has a measurement capability limited to thickness calculation of the macula and retinal nerve fiber layer (RNFL). Thus, quantitative information on intraretinal layers is not provided by this instrument. This limitation in the Stratus OCT system has stimulated interest in developing segmentation algorithms to better detect the local changes in the retinal structure.3, 4, 5, 6, 7, 8, 9, 10, 11, 12, 13, 14, 15, 16, 17, 18 In addition, the quantification provided by this system is often imprecise because of erroneous detection of the inner and outer borders of the retina.19, 20, 21 As a result, potentially useful quantitative information is not extracted by the current commercial Stratus OCT. In an effort to provide additional retinal quantifications along with accurate automatic/semiautomatic detection, various computer-aided grading procedures have been introduced.3, 4, 5, 6, 7, 8, 9, 10, 11, 12, 13, 14, 15, 16, 17, 18 Specifically, we developed a computer-aided grading methodology for OCT retinal image analysis (OCTRIMA) that is an interactive, user-friendly stand-alone application for analyzing Stratus OCT retinal images. The OCTRIMA methodology integrates a denoising and edge enhancement technique along with a segmentation algorithm previously developed by Cabrera Fernández, Salinas, and Puliafito.6 The denoising and edge enhancement techniques are part of a novel preprocessing step that facilitates better automatic segmentation results. In addition, the semiautomatic segmentation correction tool of OCTRIMA minimizes segmentation errors generated during the OCTRIMA’s automatic segmentation process, significantly reducing the need for manual error corrections. It also gives quantitative information of intraretinal structures, and facilitates the analysis of other retinal features that may be of diagnostic and prognostic value, such as morphology and reflectivity.13, 19, 21 In this work we aim to describe the correlation between Stratus OCT and OCTRIMA-derived thickness data, along with the intergrader and intragrader reproducibility of OCTRIMA segmentation using a set of data described previously.22 In addition, we describe how this tool corrects erroneous automatic segmentation results, and also demonstrate the applicability of OCTRIMA to images obtained by third and fourth generation OCT devices. 2.Materials and Methods2.1.Data Collection to be StudiedThe study conducted in this work was approved by the Institutional Review Board in our institutions. The research adhered to the tenets set forth in the declaration of Helsinki. All Stratus OCT study cases were obtained using the radial lines protocol (1024 A-scans per B-scan) on a single Stratus OCT instrument (version 4.0 software). All Stratus OCT scans were taken at the macula. In addition, all subjects scanned with the Stratus OCT unit underwent visual acuity testing with refraction and a complete slit-lamp examination. Informed consent was obtained from each subject. Macular radial line scans of the retina for each case were exported to disk with the export feature available in the Stratus OCT device. Total retinal thickness measurements were obtained as provided by the Stratus OCT built-in algorithms as well as with the OCTRIMA methodology. To demonstrate intragrader and intergarder reproducibility of OCTRIMA and the comparability of STRATUS and OCTRIMA-derived thickness results, we used the same set of ten healthy eyes (total of 60 OCT B-scans) from five normal subjects as reported previously, ranging in age from (mean age ).22 As in some Fourier-domain OCT (FD-OCT) systems, OCTRIMA facilitates the total retinal thickness calculations between the inner limiting membrane (ILM) and the inner boundary of the second hyperreflective band, which has been attributed to the outer segment/retinal pigment epithelium (OS/RPE) junction in agreement with histological studies.14, 23, 24 (see Fig. 1 ). Moreover, as in the Stratus OCT system, OCTRIMA’s total retinal thickness measurements can be also obtained by calculating the thickness between the ILM and the inner boundary of the innermost hyperreflective band corresponding to the inner segment-outer segment (IS/OS) junction. Accordingly, Stratus OCT retinal thickness measurements were compared with the OCTRIMA measurements in each of the nine macular regions defined by the Early Treatment Diabetic Retinopathy Study (ETDRS) using the two previously defined calculations for the total retinal thickness.25 Differences in macular volume measurements were also calculated. Moreover, the agreement of the thickness measured by OCTRIMA and Stratus OCT and those recently reported in the literature as a result of using FD-OCT systems were also evaluated. Fig. 1OCTRIMA screenshot showing the segmentation results for an OCT B-scan obtained from a healthy normal eye. The layers have been labeled as: ILM (inner limiting membrane), RNFL (retinal nerve fiber layer), complex (ganglion cell layer and inner plexiform layer), INL (inner nuclear layer), OPL (outer plexiform layer), ONL (outer nuclear layer), OS (outer segment of photoreceptors), and retinal pigment epithelial layer (RPE). We note that the sublayer labeled as ONL is actually enclosing the external limiting membrane (ELM) and IS, but in the standard resolution OCT image this thin membrane cannot be visualized clearly, making the segmentation of the IS difficult. Thus this layer classification is our assumption and does not reflect the actual anatomic structure. Also, observe that since there is no significant luminance transition between GCL and IPL, the outer boundary of the GCL layer is difficult to visualize in the Stratus OCT image shown. Thus, a combined layer is preferable.  Complementary cases with clinically significant intraretinal features from Stratus OCT were also collected only for demonstration purposes of the image segmentation performance and error correction using OCTRIMA. Particularly, these cases included a patient with mild nonproliferative diabetic retinopathy without macular edema and a patient with neovascular age-related macular degeneration. In both cases, the macular radial lines protocol was used. Moreover, to establish the feasibility of OCTRIMA for analyzing images from advanced OCT imaging systems, two image sets from two different FD-OCT systems were also analyzed with OCTRIMA. One set of images was obtained from the Bioptigen Spectral Domain Ophthalmic Imaging System (Bioptigen Incorporated, Research Triangle Park, North Carolina), while the other set was scanned by a custom-developed ultrahigh FD-OCT adapted from our anterior segment OCT system with axial resolution. The system configurations for these two FD-OCT systems have been detailed elsewhere.26, 27 2.2.Computer-Aided Optical Coherence Tomography Grading MethodThe method used for OCT image analysis (OCTRIMA) was developed using the Matlab graphical user interface design environment tool. The OCTRIMA methodology essentially provides dual functionality by combining image enhancement and denoising of Stratus OCT images along with automatic segmentation of the various cellular layers of the retina. More details of the segmentation and preprocessing process can be found in Cabrera Fernández, Salinas, and Puliafito,6 and Salinas and Cabrera Fernández.28 Moreover, OCTRIMA has the capability to perform calculations based on measured values of corrected thickness, and reflectance of the various cellular layers of the retina and the whole macula. OCTRIMA also facilitates semiautomatic correction of discontinuities in each detected boundary after automated segmentation, along with manual error correction using direct visual evaluation of the detected boundaries. Particularly, the methodology allows the operator to utilize simple computer mouse clicks to fix various boundaries in each of the six radial line OCT B-scans by using predefined corrective functions (see Fig. 2 ). These errors are mainly due to both the presence of high reflectivity regions in the inner retina, and loss of retinal structure information in local regions along the retinal cross section, as visualized by the commercial OCT system. Since normative data for OCT analysis are crucial to compare various treatment strategies, OCTRIMA facilitates normative data from healthy controls and also allows the user to generate a new norm using healthy or pathological subjects. The OCTRIMA’s norm is based on data from 74 healthy subjects as described previously.22 In addition, OCTRIMA provides a standardized method for reporting changes in thickness as a percentage of total possible change based on normative OCT data.29 2.3.Statistical MethodsThe coefficients of reproducibility were calculated using the methods outlined by Bland and Altman for each of the averaged thickness measurements obtained for the total retina and intraretinal layers.30, 31 The coefficients of reproducibility were computed from the standard deviations (SDs) of the differences between measurements made by each grader. The statistical analysis was performed using the software package SPSS version 16 (SPSS Incorporated, Chicago, Illinois). 3.Results3.1.Comparison of Stratus OCT Thickness Measurements and Optical Coherence Tomography Retinal Image Analysis Thickness MeasurementsIn contrast to Stratus OCT thickness calculations, OCTRIMA measurements of total retinal thickness were obtained using two different assumptions for the outer retinal boundary: 1. the inner boundary of the innermost hyperreflective band corresponding to the IS/OS junction (as defined in Stratus OCT), and 2. the inner border of the second hyperreflective band, assumed to be the OS/RPE junction. We note that the first assumption allows a fair comparison between the automated results of Stratus OCT and OCTRIMA algorithms for the convention used by the Stratus OCT algorithms. Table 1 shows the level of agreement between OCTRIMA and Stratus OCT measurements when the two different outer retinal border assumptions are applied on the same Stratus OCT images. Pearson correlation coefficients demonstrated for all ETDRS regions (data not shown). Table 1Comparison between Stratus OCT retinal thickness measurements (mean values) and the OCTRIMA measurements (mean values) obtained using: 1. the inner border of the IS/OS junction, and 2. the inner border of the OS/RPE junction as the outer retinal boundary. Differences in the measurement of the total macular volume are also included and are expressed in cubic millimeters (mm3) .
When OCTRIMA calculations used the convention adopted by Stratus OCT (i.e., inner border of the innermost hyperreflective band as the outer retinal border), the mean thickness difference was , which corresponded to 3% of the measured Stratus OCT retinal thickness. Measurements in the foveal central region (R1), inferior inner region (R4), and, nasal, inferior, and temporal outer (R7, R8, and R9) regions showed the greatest disagreement between the OCTRIMA and Stratus algorithms. Particularly, the mean difference included only 4% (except in R8) of the measured value obtained by the Stratus OCT algorithms. As expected, the foveal center point (FCP) measurements demonstrated best agreement, because no interpolation is required for these calculations (data not shown). Moreover, total macular volume, a measure derived from thickness in all data points of the macula, was 3% higher by OCTRIMA compared to Stratus OCT results, also supporting an average difference of 3% in thickness measurements. In contrast, when OCTRIMA calculations used the inner border of the second hyperreflective band (i.e., OS/RPE junction) as the outer retinal border, the mean thickness difference corresponded to 11% of the measured Stratus OCT retinal thickness. Similarly, the mean difference for the foveal region (R1) included only 17% of the measured value obtained by the Stratus OCT algorithms. Moreover, the mean difference results for the superior, nasal, inferior, and temporal inner and outer regions of the macula (R2 through R9) included 8 to 12% of the Stratus OCT measurements (see Table 1). Correspondingly, total macular volume was 10% higher by OCTRIMA compared to Stratus OCT results, also supporting an average difference of 10% in thickness measurements. 3.2.Intragrader and Intergrader Reproducibility of Thickness MeasurementsAs a result of scanning a total of ten healthy eyes, a total of 60 OCT B-scans were collected and analyzed by two independent experienced graders (G1 and G2). Moreover, to assess the overall performance of the OCTRIMA software, the average (between the two graders) retinal thickness in each of the nine ETDRS regions obtained by OCTRIMA analysis was compared with the automated Stratus OCT results. All scans in the study had a signal strength of 9 or 10. Algorithm performance was visually evaluated by the experienced graders to detect segmentation errors. Criteria for algorithm error included evident disruption of the detected boundary (e.g., small peaks, linear and curve offsets), and/or detected boundary jumping to and from different anatomical structures (i.e., false segmentation). The average number of manual corrections needed per scan was three. The inner nuclear layer (INL) and outer plexiform layer (OPL) were the layers that required most of the manual corrections. Table 2 shows the reproducibility attained by one grader (G2) after analyzing each of the ten eyes at two separate times (intragrader test, one week interval between analyses) using OCTRIMA software. Thickness measurements of the total retina and intraretinal layers are also shown in Table 2. The coefficient of reproducibility (CR) obtained for the thickness measurements was less than 0.2% for the total retina, less than 0.4% for the ONL, and less than 3% for the remaining layers. Overall, the median of the thickness differences as a percentage of the mean thickness was less than 1%. According to our results, the measurement accuracy of the OCTRIMA algorithm ranged between (see Table 2). Excellent intragrader agreement could be observed in the Bland-Altman plots of the mean difference between both grading sessions for each of the calculated intraretinal layer thicknesses (see Fig. 3 ). Fig. 3Bland-Altman plots of the the mean difference between both gradings for each intraretinal layer thickness calculated by the same grader in two separate occasions using OCTRIMA. Mean layer thickness for each subject is plotted against the difference in layer thickness between the two grading procedures. Solid lines show the mean of the differences between the two gradings, while dashed lines represent the CR values.  Table 2Intragrader reproducibility using OCTRIMA. Mean* thickness value averaged across all ten eyes. We note that the mean thickness value is a result of averaging the uninterpolated thickness measurements at every A-scan location for all six B-scans of all ten eyes. This** value is calculated by subtracting OCTRIMA thickness measurement obtained during the first grading from the OCTRIMA thickness measurement obtained during the second grading for each eye by the same grader G2, and then taking the absolute value. Median† of the differences between measurements expressed as a percentage of mean thickness across all ten eyes.
Table 3 shows the level of agreement between the two graders (intergrader reproducibility test, i.e., G1 versus G2) using the OCTRIMA software. The coefficient of reproducibility obtained for the thickness measurements was less than 0.5% for the total retina, less than 0.7% for the ONL, and less than 5% for the remaining layers. According to our results, the measurement accuracy of our algorithm ranged between (see Table 3). Overall, the median of the thickness differences as a percentage of the mean thickness was less than 2%. Table 3Intergrader reproducibility using OCTRIMA. Mean* thickness value averaged across all ten eyes. We note that the mean thickness value is a result of averaging the uninterpolated thickness measurements at every A-scan location for all six B-scans of all ten eyes. This** value is calculated by subtracting OCTRIMA thickness measurement obtained during the first grading from the OCTRIMA thickness measurement obtained during the second grading for each eye by the same grader G2, and then taking the absolute value. Median† of the differences between measurements expressed as a percentage of mean thickness across all ten eyes.
3.3.Image Segmentation Performance and Error Correction Using Optical Coherence Tomography Retinal Image AnalysisIllustrative cases of diseases with subretinal anomalies and representative intraretinal boundary detection errors are shown in Figs. 4, 5, 6 . Compared to a free-hand correction where curves are manually drawn, OCTRIMA’s manual corrective functions facilitate the correction of segmentation errors using less reviewing time. The advantage is based on the fact that OCTRIMA manual correction is performed after the semiautomatic correction of errors, which reduces significantly the time required to redraw the curves. Fig. 4Segmented B-scan before and after applying manual corrections. (a) Visible segmentation errors such as small peaks, linear offsets, curve offsets, and false segmentations. Manual error removal functions are available for: (b) False segmentation: note that the RNFL is not visible on the left side of the B-scan. The outer boundary of the RNFL is not properly detected. Note that the inner and outer boundaries (outlined in magenta and red, respectively) of the RNFL overlap after manually correcting the segmentation error. (c) Small peaks: note that the small peak or overshoot in the IPL outer boundary (outlined in yellow) has been manually corrected using the “Small Peak” correction function. (d) Foveal center control: the outer boundaries of the IPL, INL, and the OPL (outlined in yellow, cyan, and green, respectively) are made to appear coincident in the central foveal region, according to the control defined in the automated segmentation algorithm. (e) Linear offsets: note that the linear offsets in the outer boundaries of the OPL (outlined in green) are corrected manually by drawing a straight line segment on the specific boundary containing the offset. (f) Curved offsets: note that the curve offsets in the inner and outer boundaries of the INL (outlined in yellow and cyan, respectively) are corrected manually using the “curve plotting” function. (Color online only.)  Fig. 5Stratus OCT automated segmentation results for a patient with neovascular AMD showing common detection errors. The white circles indicate the areas where the Stratus OCT algorithm fails to properly detect the outer boundary. The red asterisk indicates the areas with fluid accumulation that were included in the final thickness calculations provided by Stratus OCT. (Color online only.) 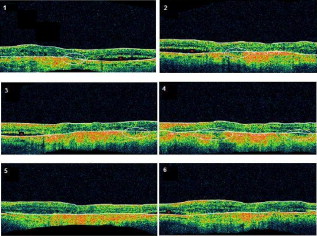 Fig. 6OCTRIMA segmentation results for a patient with neovascular AMD (nonaligned raw data for the same patient shown in Fig. 5) showing the fluid-filled regions outlined. The ONL outer border was used as the outer retinal border to compare results with Stratus OCT algorithms (see the table at the bottom). The retinal thickness map along with the ETDRS topographic map including the retinal structure and fluid-filled regions are shown in the right-bottom section. 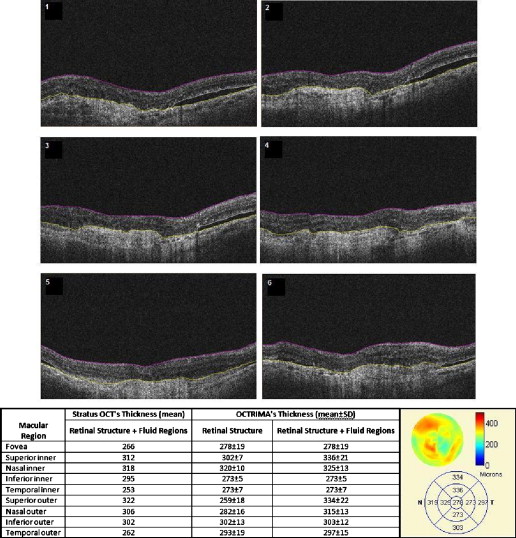 3.3.1.Mild nonproliferative diabetic retinopathy without macular edemaFigure 4 shows an OCTRIMA segmented B-scan before and after applying manual corrections. In this study case, the representative B-scan was taken from a set of images obtained for a diabetic patient with mild nonproliferative diabetic retinopathy without macular edema (male, old). Characteristic intraretinal boundary detection errors such as small peaks, linear offsets, curve offsets, and false segmentations are illustrated in Fig. 4. False segmentation refers to the falsely detected inner and/or outer boundaries of an intraretinal layer. This particular error is most commonly found during the RNFL’s outer border detection. Specifically, there are certain cases in which the true anatomical thickness of the RNFL layer (or some regions of the RNFL layer) might be negligible. In other cases, one side of the RNFL layer is completely invisible in the OCT image, like for example in the temporal part of a horizontal B-scan [see Fig. 4]. In such cases, a correction is required to overlap the inner and outer boundaries of the RNFL layer in the regions of negligible thickness [see Figs. 4 and 4]. However, sometimes the boundary detection algorithm fails in such specific cases when localized bright spots of high intensity appear on some regions of the RNFL layer, and falsely displays the outer boundary of the RNFL layer as a result of the peak search algorithm, which looks for zero crossings in the structure. Hence, the RNFL outer boundary must be manually corrected to appear overlapped on the inner boundary in the invisible part of the layer. As can be seen in Fig. 4, the ILM boundary on the inner side of the RNFL is detected but no boundary is detected on the outer left side, since the RNFL is not visible on this (temporal) side for this particular scan, whereas the RNFL is bright and clearly visible on the right (nasal) side of the scan [see Figs. 4 and 4]. Figure 4 shows the manually corrected outer boundary of the IPL (outlined in yellow) using the “small peak” corrective function of the manual correction software tool, which removes the overshoots or undershoots in the individual boundaries. These are also parts of a boundary that form a straight line segment, but are incorrectly detected as a peak or an elevated or depressed line segment by the automated segmentation algorithm. This detection error is classified as a linear offset. To resolve this class of error, the user has to manually select two points to draw a straight line segment on the specific boundary containing the offset. For example, a straight line segment was manually drawn to correct the linear offset in the outer boundary of the OPL [see the boundary outlined in green in Fig. 4]. Figure 4 shows the manual corrections for the inner and outer boundaries of the INL (outlined in yellow and cyan, respectively) that had segmentation errors as a result of curve offsets [see Fig. 4]. Curve offset is a term given to the curved portion of a boundary that has not been recognized as a curve, but instead has been incorrectly segmented as an elevated or depressed curve. Curve offsets have been rectified using a function based on a customized contour model originally introduced to identify nonconvex shapes in OCT images.3 This function allows the user to select multiple closely spaced points that will be joined to trace a curve and remove the offset. Figure 4 shows the result of the “curve plotting” function applied to correct the inner and outer boundaries of the INL (outlined in yellow and cyan, respectively). Additionally, an OCTRIMA predefined control is also in place for the inner retinal layers [RNFL, ganglion cell, and inner plexiform layer complex and INL] and OPL in a -diam zone in the fovea, where retinal reflections are minimally visible.6 The control forces the ILM, the inner and outer side of the complex, and the outer side of the INL and OPL to be coincident in this region [see Fig. 4]. Sometimes, small peaks appear at the periphery of this controlled foveal region. In such a case, it appears that the coincident layers deviate from the true foveal visible boundary and need to be corrected so that they overlap in the periphery of the controlled foveal region. Thus, the “overlap” function of the manual correction software tool is useful to rectify the segmentation at the fovea [see Fig. 4]. Figure 7 shows OCTRIMA thickness maps for the overall macula and each intraretinal layer obtained from the patient image data shown in Fig. 4. The ETDRS-like regions are based on nine sectional thickness values in three concentric circles obtained from interpolation of the six linear scans, with diameters of 1, 3, and . These maps are obtained according to the standards set by the ETDRS, similarly to the Stratus OCT analysis software, and can be easily exported to a PDF document along with the numerical results in tabulated format. The output data includes three main quantitative measures: thickness, volume, and reflectance. The sectional measurements in the retinal thickness map are calculated from the averaged data from the six individual scans. The norm used in OCTRIMA was obtained from 74 healthy eyes , as described previously.22 Fig. 7OCTRIMA thickness maps for a diabetic patient with mild nonproliferative diabetic retinopathy without macular edema (male, old). Note that thickness maps for the total retina and the intraretinal layers are shown. We also note that an OCTRIMA macular map is divided into nine zones that correspond to the ETDRS regions: fovea within a diameter of centered on the foveola; pericentral ring, the circular band from the central , divided into four quadrants, i.e., superior, inferior, temporal, and nasal; and peripheral ring from up to , divided into the same quadrants.  3.3.2.Neovascular age-related macular degenerationThe current standard OCT algorithms for obtaining the retinal thickness and volume information are error-prone when used to evaluate edematous retina, and are unable to independently assess fluid under the retina and the retinal pigment epithelium. Even when the current algorithm accurately identifies the appropriate boundaries, the retinal volume and thickness calculations only take into account the entire area between the outer reflective band (retinal pigment epithelial layer) and the inner retinal surface. Thus, the algorithms are unable to independently assess the area and volume of the fluid-filled cystic areas within and under the retina that represent leakage from choroidal neovascularization (CNV). However, our methodology allows the user to trace the internal boundary of visible nonconvex-shaped structures, such as intraretinal and subretinal fluid-filled regions, if present and visible on the OCT B-scan. To quantify the area of these fluid-filled regions, we used an active contour model to outline these regions.3 Figure 5 illustrates a common error in retinal boundary detection by the Stratus OCT software in a scan obtained from a patient with neovascular age-related macular degeneration (AMD). In neovascular AMD, the fluid accumulation usually can be identified within the retina, under the retina, and under the RPE layer. In this case, peripheral and pericentral fluid-filled regions were observed in the OCT B-scans at presentation (see Fig. 5). Note that the Stratus algorithm erroneously detected the border of the innermost hyperreflective band in four of the six radial line scans. In addition, the fluid-filled region is included as part of the retinal structure for the thickness calculation. As a result, the retina appears thickened in this patient. OCTRIMA was able to correctly detect the boundaries of the retinal structure and the fluid-filled regions (see Fig. 6, top section). The corresponding thickness maps are shown in Fig. 6, bottom section. 3.3.3.Advanced optical coherence tomography imaging systemsOur methodology is also suitable for FD-OCT images that have better resolution, and as such, ensure robust segmentation. To prove this, we applied OCTRIMA segmentation to raw images taken from FD-OCT devices using the same parameters optimized for Stratus OCT images. Particularly, Fig. 8 shows the OCTRIMA segmentation results for an image obtained with the Bioptigen Spectral Domain Ophthalmic Imaging System (Bioptigen Incorporated, Research Triangle Park, North Carolina). Figure 8 shows OCTRIMA segmentation results for an OCT image from a healthy eye obtained with a custom-developed FD-OCT adapted from our anterior segment OCT system with axial resolution.26 We note that significant improvement has been obtained for the delineation of the INL, OPL, and OS in the advanced OCT images analyzed. Fig. 8Feasibility of OCTRIMA for analyzing images from advanced OCT imaging systems. (a) OCTRIMA segmentation results for an OCT image obtained with the Bioptigen Spectral Domain ophthalmic imaging system. (b) OCTRIMA segmentation results for an OCT image obtained with the custom developed FD-OCT adapted from our anterior segment OCT system.  4.DiscussionAccording to our experience, the most difficult part of biomedical image analysis is unsupervised segmentation. However, our preprocessing method and quantitative methodology for OCT images could be used to automatically segment the retinal structure in both normal and pathological subjects.6, 19, 21, 22, 33 Although our methodology was initially developed for the quantitative analysis of Stratus OCT images, it is also potentially useful for the analysis of new OCT technologies, such as spectral domain and ultrahigh resolution-based OCT technology, which provide images with higher resolution along with a dense map of the retina. This particular methodology could help ophthalmologists explore Stratus OCT data by providing visualization and analysis methods, in conjunction with a segmentation method for extracting retinal layers and other structures, such as intraretinal and subretinal fluid-filled regions. Moreover, OCTRIMA allows further processing, so that users can diagnose and evaluate disease progression. In addition, OCTRIMA provides a manual correction tool that facilitates the interaction with the automated segmentation results, enabling significant improvements of segmentation accuracy. We found that our methodology works well at isolating most retinal layers and structures in normal healthy controls and patients with early retinopathy and diabetic diffuse macular edema.6, 19, 21, 22, 33 Accordingly, a more robust and localized quantification of the retinal structure can be achieved using this methodology. The thickness differences between Stratus OCT and OCTRIMA calculations obtained with the convention adopted by Stratus OCT (i.e., inner border of the innermost hyperreflective band as the outer retinal border) could be explained by Stratus OCT algorithm errors in the segmentation of the inner and outer borders of the retina, differences in interpolation algorithms, and scan realignment methods. On the other hand, the thickness difference between Stratus OCT measurements and OCTRIMA calculations obtained using the inner border of the second hyperreflective band (i.e., OS/RPE junction) as the outer retinal border was consistent with those obtained by comparing retinal thickness measurements between Stratus OCT and FD-OCT systems.32 The total time required to preprocess and automatically segment an OCT image (B-scan) is on a computer with an Intel® Core™ 2 Extreme CPU Q9300 at and . Since the average number of manual corrections needed per scan was three, the total time required to complete a manual correction per case was for healthy eyes and for pathological cases, depending on the magnitude of the retinal disruptions. We are currently improving the automated segmentation method to reduce the time needed to correct errors in segmentation. In a recent study, we obtained a high degree of repeatability, reproducibility, and reliability of our methodology using data from ten healthy control eyes.22 5.ConclusionIn this study we present a robust and interactive computer-aided retinal image analysis method for the assessment of retinal pathologies using Stratus OCT images. The software implements a custom segmentation algorithm to accurately identify the boundaries of the intraretinal layers with minimized errors, which is functionally more efficient compared to commercial Stratus OCT software. Additionally, compared to free-hand corrections, OCTRIMA offers a less time-consuming method to manually eliminate visible irregularities, if any, in the detected boundaries between the various cellular layers of the retina. This powerful capability ensures higher accuracy in the numerical data obtained from the measurements of the thickness and reflectance of each layer and the whole macula. Additional capabilities of our methodology include report generation for quantitative analysis of the macula and intraretinal layers per scan and per region. Moreover, topographic maps for the thickness of each cellular layer of the retina can be generated, which provides a visual aid for better analysis of local structural changes, if any, in each ETDRS retinal region. Another potential advantage of our methodology is the incorporation of a standard method for reporting changes in thickness, which could be used as a framework for reporting treatment outcomes.29 Thus, our methodology can be used to compare the efficacy of current and emerging therapies, as well as monitor the progression of disease in patients. Future work will include the adaptation of our methodology into a more practical interface to handle the large quantities of measured raw data generated by the advanced OCT systems. Moreover, OCTRIMA’s retinal thickness measurements could be used as a primary or secondary end point for clinical trials of therapeutic agents for retinal tissue alterations under investigation by pharmaceutical companies. We do believe that OCTRIMA will help physicians to better diagnose and plan treatments, and also evaluate the efficacy of therapeutic intervention. AcknowledgmentsThis study was supported in part by a Juvenile Diabetes Research Foundation grant (JDRF 2007-727), a NIH center grant P30-EY014801, and by an unrestricted grant to the University of Miami from Research to Prevent Blindness, Incorporated. ReferencesD. Huang, E. A. Swanson, C. P. Lin, J. S. Schumann, W. G. Stinson, W. Chang, M. R. Hee, T. Flotte, K. Gregory, C. A. Puliafito, and J. G. Fujimoto,
“Optical coherence tomography,”
Science, 254 1178
–1181
(1991). https://doi.org/10.1126/science.1957169 0036-8075 Google Scholar
M. R. Hee,
“Optical coherence tomography of the eye,”
Massachusetts Institute of Technology,
(1997). Google Scholar
D. Cabrera Fernández,
“Delineating fluid-filled region boundaries in optical coherence tomography images of the retina,”
IEEE Trans. Med. Imaging, 24
(8), 929
–945
(2005). https://doi.org/10.1109/TMI.2005.848655 0278-0062 Google Scholar
H. Ishikawa, D. M. Stein, G. Wollstein, S. Beaton, J. G. Fujimoto, and J. S. Schuman,
“Macular segmentation with optical coherence tomography,”
Invest. Ophthalmol. Visual Sci., 46 2012
–2020
(2005). https://doi.org/10.1167/iovs.04-0335 0146-0404 Google Scholar
M. Shahidi, Z. Wang, and R. Zelkha,
“Quantitative thickness measurement of retinal layers imaged by optical coherence tomography,”
Am. J. Ophthalmol., 139 1056
–1061
(2005). https://doi.org/10.1016/j.ajo.2005.01.012 0002-9394 Google Scholar
D. Cabrera Fernández, H. M. Salinas, and C. A. Puliafito,
“Automated detection of retinal layer structures on optical coherence tomography images,”
Opt. Express, 13 10200
–10216
(2005). https://doi.org/10.1364/OPEX.13.010200 1094-4087 Google Scholar
D. Koozekanani, K. Boyer, and C. Roberts,
“Retinal thickness measurements from optical coherence tomography using a Markov boundary model,”
IEEE Trans. Med. Imaging, 20 900
–916
(2001). https://doi.org/10.1109/42.952728 0278-0062 Google Scholar
M. Mujat, R. C. Chan, B. Cense, B. H. Park, C. Joo, T. Akkin, T. C. Chen, and J. F. de Boer,
“Retinal nerve fiber layer thickness map determined from optical coherence tomography images,”
Opt. Express, 13 9480
–9491
(2005). https://doi.org/10.1364/OPEX.13.009480 1094-4087 Google Scholar
M. Szkulmowski, M. Wojtkowski, B. Sikorski, T. Bajraszewski, V. J. Srinivasan, A. Szkulmowska, J. J. Kaluzny, J. G. Fujimoto, and A. Kowalczyk,
“Analysis of posterior retinal layers in spectral optical coherence tomography images of the normal retina and retinal pathologies,”
J. Biomed. Opt., 12
(4), 041207
(2007). https://doi.org/10.1117/1.2771569 1083-3668 Google Scholar
M. Baroni, P. Fortunato, and A. L. Torre,
“Towards quantitative analysis of retinal features in optical coherence tomography,”
Med. Eng. Phys., 29 432
–441
(2007). https://doi.org/10.1016/j.medengphy.2006.06.003 1350-4533 Google Scholar
E. Gotzinger, M. Pircher, W. Geitzenauer, C. Ahlers, B. Baumann, S. Michels, U. Schmidt-Erfurth, and C. K. Hitzenberger,
“Retinal pigment epithelium segmentation by polarization sensitive optical coherence tomography,”
Opt. Express, 16 16410
–16422
(2008). https://doi.org/10.1364/OE.16.016410 1094-4087 Google Scholar
C. A. Toth, S. Farsiu, S. J. Chiu, A. A. Khanifar, and J. A. Izatt,
“Automatic Drusen segmentation and characterization in spectral domain optical coherence tomography (SDOCT) images of AMD eyes,”
Invest. Ophthalmol. Visual Sci., 49 5394
(2008). https://doi.org/10.1167/iovs.09-4962 0146-0404 Google Scholar
D. Cabrera Fernández, G. M. Somfai, E. Tátrai, S. Ranganathan, D. C. Yee, M. Ferencz, and W. E. Smiddy,
“Potentiality of intraretinal layer segmentation to locally detect early retinal changes in patients with diabetes mellitus using optical coherence tomography,”
Invest. Ophthalmol. Visual Sci., 49 2751
(2008). 0146-0404 Google Scholar
C. Ahlers, C. Simader, W. Geitzenauer, G. Stock, P. Stetson, S. Dastmalchi, and U. Schmidt-Erfurth,
“Automatic segmentation in three-dimensional analysis of fibrovascular pigment epithelial detachment using high-definition optical coherence tomography,”
Br. J. Ophthamol., 92 197
–203
(2008). https://doi.org/10.1136/bjo.2007.120956 0007-1161 Google Scholar
T. Fabritius, S. Makita, M. Miura, R. Myllyla, and Y. Yasuno,
“Automated segmentation of the macula by optical coherence tomography,”
Opt. Express, 17
(18), 15659
–15669
(2009). https://doi.org/10.1364/OE.17.015659 1094-4087 Google Scholar
M. Garvin, M. Abramoff, R. Kardon, S. Russell, X. Wu, and M. Sonka,
“Intraretinal layer segmentation of macular optical coherence tomography images using optimal 3-D graph search,”
IEEE Trans. Med. Imaging, 27
(10), 1495
–1505
(2008). https://doi.org/10.1109/TMI.2008.923966 0278-0062 Google Scholar
A. R. Fuller, R. J. Zawadzki, S. Choi, D. F. Wiley, J. S. Werner, and B. Hamann,
“Segmentation of three-dimensional retinal image data,”
IEEE Trans. Vis. Comput. Graph., 13
(6), 1719
–1726
(2007). 1077-2626 Google Scholar
S. Joeres, J. W. Tsong, P. G. Updike, A. T. Collins, L. Dustin, A. C. Walsh, P. W. Romano, and S. R. Sadda,
“Reproducibility of quantitative optical coherence tomography subanalysis in neovascular age-related macular degeneration,”
Invest. Ophthalmol. Visual Sci., 48 4300
–4307
(2007). https://doi.org/10.1167/iovs.07-0179 0146-0404 Google Scholar
G. M. Somfai, E. Tátrai, S. Ranganathan, and D. Cabrera Fernández,
“Age-related changes in macular structure among young and middle-aged healthy subjects assessed by OCT image segmentation,”
Invest. Ophthalmol. Visual Sci., 49 3214
(2008). 0146-0404 Google Scholar
S. R. Sadda, S. Joeres, Z. Wu, P. Updike, P. Romano, A. T. Collins, and A. C. Walsh,
“Error correction and quantitative subanalysis of optical coherence tomography data using computer-assisted grading,”
Invest. Ophthalmol. Visual Sci., 48 839
–848
(2007). https://doi.org/10.1167/iovs.06-0554 0146-0404 Google Scholar
W. Gao, S. Ranganathan, E. Tátrai, G. M. Somfai, and D. Cabrera Fernández,
“Development of a graphic user interface as an additional tool of diagnostic differentiation of retinal tissue using optical coherence tomography,”
Invest. Ophthalmol. Visual Sci., 49 1891
(2008). 0146-0404 Google Scholar
D. Cabrera DeBuc, G. M. Somfai, S. Ranganathan, E. Tátrai, M. Ferencz, and C. A. Puliafito,
“Reliability and reproducibility of macular segmentation using a custom-built OCT retinal image analysis software,”
J. Biomed. Opt., 14
(6), 064023
(2009). https://doi.org/10.1117/1.3268773 1083-3668 Google Scholar
G. S. Hageman, M. F. Marmor, X. Y. Yao, and L. V. Johnson,
“The interphotoreceptor matrix mediates primate retinal adhesion,”
Arch. Ophthalmol., 113 655
–660
(1995). Google Scholar
R. A. Costa, M. Skaf, L. A. S. Melo Jr., D. Calucci, J. A. Cardillo, J. C. Castro, D. Huang, and M. Wojtkowski,
“Retinal assessment using optical coherence tomography,”
Prog. Retin Eye Res., 25 325
–353
(2006). https://doi.org/10.1016/j.preteyeres.2006.03.001 1350-9462 Google Scholar
Early Treatment Diabetic Retinopathy Study Research Group,
“Early treatment diabetic retinopathy study design and baseline patient characteristics, ETDRS Report 7,”
Ophthalmology, 98 741
–756
(1991). 0161-6420 Google Scholar
Q. Chen, J. Wang, A. Tao, M. Shen, S. Jiao, and F. Lu,
“Ultra-high resolution measurement by Optical coherence tomography of dynamic tear film changes on contact lenses,”
Invest. Ophthalmol. Visual Sci., 51 1988
–1993
(2010). 0146-0404 Google Scholar
A. W. Scott, S. Farsiu, L. B. Enyedi, D. K. Wallace, and C. A. Toth,
“Imaging the infant retina with handheld spectral domain OCT,”
Am. J. Ophthalmol., 147
(2), 364
–373
(2009). https://doi.org/10.1016/j.ajo.2008.08.010 0002-9394 Google Scholar
H. M. Salinas and D. Cabrera Fernández,
“Comparison of PDE-based nonlinear anisotropic diffusion approaches for image enhancement and denoising in optical coherence tomography,”
IEEE Trans. Med. Imaging, 26
(6), 761
–71
(2007). https://doi.org/10.1109/TMI.2006.887375 0278-0062 Google Scholar
A. Chan and J. S. Duker,
“A standardized method for reporting changes in macular thickness using OCT,”
Arch Ophthalmol., 123 939
–943
(2007). Google Scholar
, “Accuracy (trueness and precision) of measurement methods and results: basic methods for the determination of repeatability and reproducibility of a standard measurement method,”
(1994) Google Scholar
J. M. Bland and D. G. Altman,
“Statistical methods for assessing agreement between two methods of clinical measurement,”
Lancet, 1 307
–310
(1986). 0140-6736 Google Scholar
U. E. Wolf-Schnurrbusch, L. Ceklic, C. K. Brinkmann, M. Iliev, M. Frey, S. P. Rothenbuehler, V. Enzmann, and S. Wolf,
“Macular thickness measurements in healthy eyes using six different optical coherence tomography instruments,”
Invest. Ophthalmol. Visual Sci., 50 3432
–3437
(2009). https://doi.org/10.1167/iovs.08-2970 0146-0404 Google Scholar
G. M. Somfai, E. Tátrai, M. Ferencz, C. A. Puliafito, and D. Cabrera Fernández,
“Quantifying retinal layer thickness changes in eyes with diabetic diffuse macular edema using optical coherence tomography,”
Invest. Ophthalmol. Visual Sci., 48 1426
(2007). 0146-0404 Google Scholar
|
||||||||||||||||||||||||||||||||||||||||||||||||||||||||||||||||||||||||||||||||||||||||||||||||||||||||||||||||||||||||||||||||||||||||||||||||||||||||||||||||||||||||||||||||||||||||||||||||||||||||||||||||||||||||||||||||||||||||||||||||||||||||||||||||||||||