
|
|
1.IntroductionIn 1991, Huang 1 introduced optical coherence tomography (OCT) by providing examples on two different biological systems: the retina and the coronary artery. The subsequent development of OCT in ophthalmology has led to a rich collection of research literature and to the commercialization of OCT systems by numerous companies. It has culminated in the adoption of OCT in ophthalmological clinics. The more challenging development of intravascular OCT imaging (IVOCT) evolved through well-defined steps. The clinical relevance of OCT measurements was clearly demonstrated as early as 1996.2, 3 Catheter-based measurements on excised human coronary arteries were first reported in 1996.4 First in-vivo IVOCT measurements were successfully performed in rabbit aortas5 and in porcine coronary arteries.6 In-vivo IVOCT measurement in a human coronary artery was first reported in 2001.7 All these developments were performed with first-generation IVOCT systems based on time-domain OCT (TD-OCT) technology. Blood must be displaced with occlusion and/or flushing to perform OCT measurements.5 The slow imaging speed provided by TD-OCT required long occlusion and/or flushing durations. A dramatic increase in imaging speed was obtained with the development of second-generation IVOCT systems based on swept-source OCT (SS-OCT) technology, also known as optical Fourier domain imaging. A first in-vivo measurement of a human coronary artery with this second-generation IVOCT was reported in 2008.8 The increased speed allows imaging of large segments of coronary arteries with a flush duration of a few seconds.8 Simultaneously to these technical achievements, the potential of IVOCT for the diagnosis of atherosclerotic diseases and for the assessment of therapeutic treatments has been validated in numerous studies.9, 10, 11 This emerging technology is strongly supported by industry, and a few major companies are now offering or are developing IVOCT systems. Acceptance of the technology in the clinical world is under way, since it is already approved for use in a few countries. Despite these great achievements, there is still much to do to further improve the technology. On the technical side, higher measurement rates would allow more detailed imaging. The use of the various forms of functional OCT would be welcomed, although their implementation through an intravascular probe represents quite a challenge. Combining IVOCT with other imaging technologies through the same intravascular probe might lead to richer information and to more accurate diagnostics. On the clinical side, there is still much to do to extract all the information contained in the OCT signal, and to explore new applications of OCT in intravascular diagnosis and treatment assessment. The first step in the development of IVOCT systems usually begins with laboratory work on simple tubes or on more complex arterial phantoms,12 with a progression to excised arteries. This laboratory bench work transitions to in-vivo trials, first on animals, then on humans. There is a large gap between laboratory work and in-vivo trials; an intermediate step would be welcomed. In the current work, we report measurements performed on a beating heart setup, using a modified Langendorff perfusion system.13, 14 In this model, an excised porcine heart is suspended and allowed to beat naturally while being perfused with oxygen and nutrients. This setup provides in-situ conditions for the coronary arteries with the heart in an ex-vivo setup. It represents the needed intermediate step between laboratory work and in-vivo trials. It has some intrinsic advantages over whole-animal preparation for instrument development and testing. The greatest advantage lies in the duration over which imaging can be performed: about five hours. This allows for extensive testing and evaluation of various aspects of IVOCT components and imaging procedures during a single session. We first describe the modified Langendorff setup used in our laboratory. We then give some details about our OCT systems and our intravascular probe. With the help of a few experimental results, we discuss advantages and the main challenge of using the beating heart setup for the development of IVOCT. We conclude by identifying further development opportunities offered by IVOCT measurements on a beating heart setup. 2.Modified Langendorff SetupNear the end of the nineteenth century, Langendorff reported a detailed setup to obtain an isolated and perfused mammalian heart that can beat on its own for hours.13 In the current work, we use a modified version of the initial setup. All animal experiments conform to the guidelines set out by the Canadian Council on Animal Care regarding the care and use of experimental animals, and are approved by a local Animal Care Committee of the National Research Council of Canada. Commercial source swine are acclimatized in the animal facility for approximately a week. On the day of surgery, the animal is anesthetized and monitored while on ventilated anesthesia. The chest is opened and the heart is arrested with a bolus potassium injection. The heart and lungs are removed from the chest, rinsed in cold saline, and then put in a cold saline bath. The trachea, lungs, and pericardium are trimmed away from the heart. The first carotid branch of the aorta is cannulated for perfusion, and the cut end of the aorta is cannulated for pressure monitoring. The left atrium is opened and a vent is punched through the wall of the ventricle at the apex to drain perfusate. A purse-string suture is placed around the mitral valve and used to secure a balloon that is placed in the left ventricle to monitor ventricular function. The heart is then hung over a funnel and perfused with body temperature Krebs-Heinseleit solution flowing at per minute using a COBE roller occlusive pump. As the heart warms and shows signs of activity, it is defibrillated with through internal paddles. Once normal rhythm is established, the balloon is inflated in increments with distilled water. Perfusion pressure is monitored through the aortic pressure line and the perfusion rate adjusted to achieve a pressure of . Figure 1 shows a picture of the beating heart preparation. Figure 1 shows a schematic representation of the beating heart preparation. The red line indicates the inflow of perfusate through the first branch of the aorta. In the aorta, the oxygenated perfusate flows in the retrograde direction from normal blood flow. The perfusate is blocked at the entrance of the left ventricle by the aortic valve and forced into the coronary arteries. The perfusate delivers oxygen to the myocardium by flowing through the coronary vessels. The deoxygenated perfusate is carried by the coronary veins and empties into the right atrium through the coronary sinus. Under myocardial activity, it reaches the right ventricle to be expelled through the pulmonary artery, as indicated by the blue line in Fig. 1. The green line connected to the aorta indicates the pressure line used to monitor the perfusate pressure. The balloon inserted in the left ventricle is circled in yellow. It is used to monitor myocardial activity. Finally, the violet line in the second branch of the aorta is the entry point of the intravascular OCT probe. The probe follows a path similar to that of the perfusate and reaches the coronary arteries. 3.Optical Coherence Tomography ImagingTwo OCT systems are used in this study: a time-domain OCT system (TD-OCT) and a swept-source OCT system (SS-OCT). Both systems are presented in Fig. 2 . Both systems are used with the same intravascular probe. Fig. 2(a) TD-OCT and (b) SS-OCT setups. SLED superluminescent diode; Cir circulator; Cp coupler; PC polarization controller; and D balanced detection; NC not connected; ATU artery testing unit (pullback and rotation device). 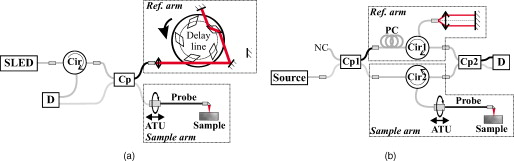 The TD-OCT system includes a delay line based on an ensemble of rotating rhombic prisms.15 This technology is commercialized by Novacam Technologies (Pointe-Claire, Canada).16 The delay line used in this work operates at a rate of 2100 A-scans/s, although the most recent version of the unit can operate at 8000 A-scans/s. The light source is a superluminescent light-emitting diode (Denselight, Singapore) centered at with a bandwidth of to provide a theoretical OCT resolution of about . The whole system is packaged as a mobile unit. The SS-OCT system is another custom-built system that operates with a commercial swept source. For this work, we use a Santec source (Aichi, Japan) operating at a sweep rate of and sweeping over around wavelength to provide a measured OCT resolution of . The SS-OCT system is configured as a Mach-Zehnder interferometer with balanced detection. The nonlinearity of the source sweep is corrected by resampling the signal prior to performing the SS-OCT Fourier transform.17 The SS-OCT system is also packaged as a mobile unit. The intravascular probe is illustrated in Fig. 3 . It is composed of a single-mode fiber contained within a flexible stainless steel tube ( in diameter) in the proximal region for at most , followed by a stainless steel spring tube ( in diameter). This combination provides resistance to torque to minimize nonuniform rotational distortion, while allowing enough flexibility to bend the catheter close to the heart, thanks to the spring tube. To obtain even more flexibility in the distal region, the single-mode fiber is contained in a flexible polymer tube over a length of about . Near the tip of the catheter, the light exiting from the fiber is focused by a gradient-index (GRIN) lens and is redirected by a right-angle prism. The GRIN lens (GrinTech, Germany) is about in length and in diameter. The prism has a side length of . The ensemble is enclosed in a stainless steel ferrule with an outer diameter of . The tip of the probe is rounded with glue to reduce friction during rotation. Robustness was the main criteria in the design of the optical probe, at the expense of possible further miniaturization. The probe assembly rotates in a liquid within a transparent polymer sheath. Various liquids can be used, including saline or mineral oil. The polymer sheath has an internal diameter of and an external diameter of . The sheath is custom made with three sections of Pebax of decreasing stiffness from the proximal region to the distal region. The tip of the sheath is thus made of a soft material to ease transit through the coronary artery tree. A hole is made to accommodate a cardiac guide wire, and thus this assembly easily integrates into current clinical practice using a rapid-exchange catheter technology. Fig. 3Intravascular probe (B balloon, F ferrule, PS polymer sheath, GRIN gradient-index lens, GW guide wire, LB light beam, OF optical fiber, PT polymer tube, RAP right-angle prism, and ST soft tip). 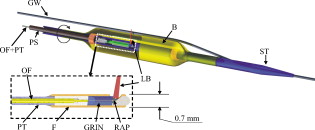 Due to the high scattering efficiency of red blood cells at a wavelength of , blood must be displaced to perform intravascular imaging. For this study, blood is temporarily displaced by occluding the artery with a compliant balloon, and OCT imaging is performed through the balloon. A compliant balloon inflates at much lower pressure (less than ) than the noncompliant balloons usually used in angioplasty. It enables occlusion of the artery without detrimental effects to the artery wall. The compliant balloon is made of silicone and is glued on the polymer sheath, as depicted in Fig. 3. The balloon is inflated with liquid flowing through holes punched in the polymer sheath. An occlusion pressure of is typically used to perform OCT measurements. A pull-back unit provides the rotation and translation of the intravascular probe. It contains a rotary joint (Princetel, Pennington, New Jersey). The pull-back unit provides pull-back speeds of . Our TD-OCT imaging is typically performed at (fps) with a pull-back speed of . SS-OCT imaging is typically performed at with a pull-back speed of . Figure 4 illustrates a recent version of the SS-OCT system along with the pull-back unit. A single-mode fiber depicted as a yellow line in Fig. 4 links the two elements. Fig. 4SS-OCT system and pull-back unit. The yellow line illustrates the single-mode fiber running from the interferometer to the pullback unit. 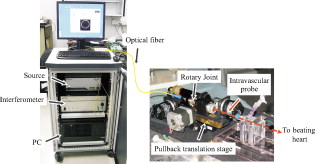 Video 1 provides a short movie illustrating the path of the intravascular probe from the pull-back unit to the beating heart. The probe location in the artery can be seen near the end of the movie as a blinking red dot on the surface of the heart; a visible light is coupled into the intravascular probe to help determine the probe location. Video 1The path of the intravascular probe from the pull-back unit to the beating heart (QuickTime 5.51 MB).  4.Optical Coherence Tomography Imaging on a Beating Heart SetupA few measurements using the beating heart setup for intravascular OCT development will highlight the advantages and the main challenge encountered using this model. A very useful feature of the Langendorff beating heart setup lies in the duration over which an intravascular catheter can be manipulated in a coronary artery during imaging; measurements can be performed over about five hours compared to over a few tens of minutes for the in-vivo case. This allows for extensive testing of the various components of the IVOCT system and of various imaging procedures during a single session. For example, all the measurements presented in this section can be performed within a single session, still leaving ample time for additional measurements. An advantage of the beating heart setup is the ability to perform measurements either with a transparent perfusate or with an opaque perfusate-blood mixture. The perfusate itself insures close to in-vivo conditions for the coronary arteries. It carries nutrients and oxygen. It flows at controlled pressure and temperature, all this with an active beating heart. The perfusate is transparent to infrared light. Thus, measurements can be performed without complications arising from the light scattering efficiency of whole blood. This allows one to concentrate on testing elements of the design not directly related to blood displacement. Video 2 shows an SS-OCT pull back at and through the perfusate. It shows a clear delineation of the artery layers and a few artery bifurcations. This pull back is of interest, since it also shows a partial dissection of the artery wall. While developing the OCT catheter, we tested different transparent polymer sheaths. This pull back was not performed with our optimized polymer sheath with a soft tip, but with a simpler one with a somewhat rigid tip. The dissection was probably caused during the probe insertion. To obtain an opaque medium similar to whole blood, one can use a mixture of perfusate and blood. One can then use the setup to test the efficiency of blood displacement techniques. One can make this switch in perfusate during an imaging session, thus ensuring good imaging performance before the introduction of blood. Many blood displacement implementations can be tested within a single beating heart session, all without the concern of inducing cardiac arrhythmias, which could occur in the in-vivo model. The three methods to displace blood are: flushing, a combination of occlusion and flushing, and imaging through a balloon.18 Flushing was used as soon as it was demonstrated that blood displacement was necessary.5 Flushing was not very efficient when used with TD-OCT due to its slow imaging speed, but is now very efficient with the higher imaging speed provided by SS-OCT.8 The combination of occlusion and flushing has been used in the first commercial time-domain IVOCT system. Imaging through a balloon might be of interest to monitor angioplasty procedures. Figure 5 illustrates TD-OCT measurements performed at without pull back through a perfusate-blood mixture to test the efficiency of blood displacement with a compliant balloon. In Fig. 5, the balloon is not inflated and only perfusate is used, providing a clear view of the artery wall. A small portion in the lower right is missing, since it is located outside the optical depth allowed by the delay line. In Fig. 5, blood is introduced to obtain a 20% blood mixture. Even at such a low concentration, scattering is efficient enough to hide a large portion of the artery wall.19 Only the left part close to the polymer sheath is visible. The concentration of blood is increased in Fig. 5 to obtain a 40% blood mixture, which further occludes the artery wall. In Fig. 5, the balloon is partially inflated, displacing a sizeable amount of blood. A larger part of the artery wall becomes visible. The balloon is inflated to about in Fig. 5 to displace all blood. All the layers of the artery wall (intima, media, and adventitia) are then clearly delineated over the whole circumference. Video 3 presents a movie where SS-OCT is used without pull back to monitor the inflation of the balloon. Fig. 5Sequence of measurements performed with TD-OCT at without pull back to illustrate blood displacement with a compliant balloon. The percentage of blood and the degree of balloon inflation are provided on the images. (a) and (b) were recorded at a first location in the artery. Images (c), (d), and (e) were recorded at a second location.  Video 2An SS-OCT pull back at and through the transparent perfusate. No compliant balloon is used for this measurement. The markers are spaced in each direction (QuickTime 4.30 MB).  Another advantage of the beating heart setup is that the location of the intravascular probe can easily be determined from the outside of the heart using an infrared viewer or by coupling the output of a red laser pointer into the optical path. This is exemplified in Fig. 1, where the bright red dot indicates the tip of the intravascular probe. The red laser output can be seen through the artery wall, and locations where intravascular measurements are taken can thus easily be marked by stitches in the heart. This is extremely useful when trying to coregister OCT cross sections and correlate OCT images with histological sections. The beating heart setup is an ideal configuration to perform multimodal imaging, including OCT. Again, the long duration provides enough time to use various imaging techniques, whether sequentially or concurrently. One can thus compare their outcome or evaluate improvements resulting from their combined use. These additional imaging techniques are not limited to optical techniques, but could include, for example, ultrasound imaging or magnetic resonance imaging. The beating heart setup also allows for unique combinations of imaging capabilities. Since the heart wall is exposed, OCT can be combined with imaging techniques that look at the heart from the outside. Figure 6 provides an example of such a combination. Near-infrared (NIR) imaging is used to study the reduction of tissue oxygenation levels20, 21 due to compromised tissue perfusion resulting from the introduction of the OCT catheter into the coronary arteries and from the temporary occlusion of blood flow, which is required. An oxygenation image, which effectively measures the relative concentration of oxyhemoglobin to total hemoglobin present in the heart tissue, is determined based on the reflectance spectrum acquired under white-light illumination for each pixel of a charge-coupled device (CCD) detector. Regions in red in Fig. 6 are well oxygenated, while regions in blue are ischemic. Figure 6 provides a baseline for NIR imaging; the heart wall is well oxygenated, showing no signs of ischemia. Figure 6 shows the ischemic condition resulting after a occlusion. The occlusion is obtained, with the compliant balloon usually used for OCT imaging. The occlusion point is located just above the ischemic region. In Fig. 6, the occluding balloon has been deflated and the image shows the NIR result a few minutes after reperfusion. The heart is again well oxygenated, showing no apparent damage resulting from the ischemia. SS-OCT imaging at was also performed during the experiment, with a specially designed polymer sheath allowing imaging distal to the occlusion point. The OCT probe is introduced deep in the left anterior descending artery. Figure 6 shows the OCT image of a normal artery wall before occlusion. Since only the perfusate is used for this experiment, OCT provides a clear view of the artery wall. During occlusion, Fig. 6 shows that the artery is contracted over the polymer sheath. In Fig. 6, the artery is again distended after reperfusion. This type of measurement is of high clinical relevance, providing valuable information about the side effects of occlusion. For the current work, a long occluding time was chosen to accommodate the time to acquire reflectance images at 40 discrete wavelengths across the near-infrared . Nevertheless, the occlusion time was longer than what would be done in a normal treatment, be it OCT imaging or angioplasty, and the heart fully recovered from the induced ischemia. A study of the ischemia on shorter time scales is in progress, still using NIR but monitoring over a smaller region. Similar experiments are also planned to study the side effects of blood displacement with a flushing approach. Fig. 6Images obtained using (a), (b), and (c) near-infrared reflectometry and (d), (e), (f) SS-OCT at to monitor ischemia resulting from an occlusion. (a) and (d): baseline. (b) and (e): after occlusion. (c) and (f): few minutes after reperfusion.  The main challenge encountered when performing OCT measurements on a beating heart setup relates to catheter insertion. In our first experiments, the catheter was guided to the coronary arteries by pinching it between fingers to determine its location while advancing the catheter. With this approach, catheter exchange was always a challenging process. A better approach was used in later experiments. While preparing the beating heart setup, an introducer (Cook Flexor Check-Flo, Cook Medical, Bloomington, Indiana) was inserted into the coronary artery to provide easy access to the vessel throughout the experiment. The catheter could then be inserted and replaced rapidly. Figure 1 illustrates the introducer inserted in the beating heart. Care must be taken when using an introducer. If misplaced, it can occlude the artery and reduce the flow of perfusate. 5.ConclusionWe report the first OCT measurements performed on a beating heart setup. This setup provides in-vivo conditions without the many complications related to in-vivo, whole-animal experiments. Its main advantage is the stability of the model, allowing for IVOCT measurements over many hours where many tests can be performed successively. The beating heart setup provides an excellent platform for the development of IVOCT, since various components and procedures of an IVOCT system can be optimized under realistic conditions. For example, various blood displacement techniques can be tested, be it occlusion, a combination of occlusion and flushing, or flushing alone. The beating heart setup allows for simple direct and continuous assessment of heart function in response to the intervention or imaging procedure. For example, we were able to determine the ischemic load on the heart during balloon occlusion and IVOCT imaging protocols. The model facilitates testing the utility of using IVOCT for monitoring percutaneous intravascular interventions (PCI) and evaluating the performance of PCI products under realistic conditions. PCI procedures are simple to carry out in this model without the need for x-ray fluorescence guidance. The beating heart model has been a valuable tool in the development of our IVOCT capabilities. The model spans the gap between bench experiments performed on phantoms and excised arteries to in-vivo measurements. AcknowledgmentsThe authors would like to thank Bo Xiang and Lori Gregorash for their surgical expertise in the beating heart preparation. The authors also want to thank Christian Padioleau, Christian Degrandpré, Michael Smith, Frédéric D’Amours, and Jeri Friesen for their technical support. The authors also acknowledge the financial support of the National Research Council Canada through the Genomics and Health Initiative. ReferencesD. Huang, E. A. Swanson, C. P. Lin, J. S. Schuman, W. G. Stinson, W. Chang, M. R. Hee, T. Flotte, K. Gregory, C. A. Puliafito, and J. G. Fujimoto,
“Optical coherence tomography,”
Science, 254
(5035), 1178
–1181
(1991). https://doi.org/10.1126/science.1957169 0036-8075 Google Scholar
M. E. Brezinski, G. J. Tearney, B. E. Bouma, S. A. Boppart, M. R. Hee, E. A. Swanson, J. F. Southern, and J. G. Fujimoto,
“Imaging of coronary artery microstructure (in vitro) with optical coherence tomography,”
Am. J. Cardiol., 77
(1), 92
–93
(1996). https://doi.org/10.1016/S0002-9149(97)89143-6 0002-9149 Google Scholar
M. E. Brezinski, G. J. Tearney, B. E. Bouma, J. A. Izatt, M. R. Hee, E. A. Swanson, J. F. Southern, and J. G. Fujimoto,
“Optical coherence tomography for optical biopsy. Properties and demonstration of vascular pathology,”
Circulation, 93
(6), 1206
–1213
(1996). 0009-7322 Google Scholar
G. J. Tearney, M. E. Brezinski, S. A. Boppart, B. E. Bouma, N. Weissman, J. F. Southern, E. A. Swanson, and J. G. Fujimoto,
“Images in cardiovascular medicine. Catheter-based optical imaging of a human coronary artery,”
Circulation, 94
(11), 3013
(1996). 0009-7322 Google Scholar
G. Fujimoto, S. A. Boppart, G. J. Tearney, B. E. Bouma, C. Pitris, and M. E. Brezinski,
“High resolution in vivo intra-arterial imaging with optical coherence tomography,”
Heart, 82
(2), 128
–133
(1999). 1355-6037 Google Scholar
G. J. Tearney, I. K. Jang, D. H. Kang, H. T. Aretz, S. L. Houser, T. J. Brady, K. Schlendorf, M. Shishkov, and B. E. Bouma,
“Porcine coronary imaging in vivo by optical coherence tomography,”
Acta Cardiol., 55
(4), 233
–237
(2000). https://doi.org/10.2143/AC.55.4.2005745 0001-5385 Google Scholar
K. Jang, G. Tearney, and B. Bouma,
“Visualization of tissue prolapse between coronary stent struts by optical coherence tomography: comparison with intravascular ultrasound,”
Circulation, 104
(22), 2754
(2001). https://doi.org/10.1161/hc4701.098069 0009-7322 Google Scholar
G. J. Tearney, S. Waxman, M. Shishkov, B. J. Vakoc, M. J. Suter, M. I. Freilich, A. E. Desjardins, W. Y. Oh, L. A. Bartlett, M. Rosenberg, and B. E. Bouma,
“Three-dimensional coronary artery microscopy by intracoronary optical frequency domain imaging,”
J. Am. Coll. Cardiol. Cardio. Imag., 1
(6), 752
–761
(2008). Google Scholar
G. J. Tearney, I. K. Jang, and B. E. Bouma,
“Optical coherence tomography for imaging the vulnerable plaque,”
J. Biomed. Opt., 11
(2), 021002
–021010
(2006). https://doi.org/10.1117/1.2192697 1083-3668 Google Scholar
E. Regar, P. W. Serruys, and Ton G. Van Leeuwen, Optical Coherence Tomography in Cardiovascular Research, Informa Healthcare, London (UK)
(2007). Google Scholar
H. G. Bezerra, M. A. Costa, G. Guagliumi, A. M. Rollins, and D. I. Simon,
“Intracoronary optical coherence tomography: a comprehensive review: clinical and research applications,”
J. Am. Coll. Cardiol. Cardio. Interventions, 2
(11), 1035
–1046
(2009). Google Scholar
C. É. Bisaillon, M. M. Lanthier, M. L. Dufour, and G. Lamouche,
“Durable coronary artery phantoms for optical coherence tomography,”
Proc. SPIE, 7161 71612E
(2009). https://doi.org/10.1117/12.809086 0277-786X Google Scholar
O. Langendorff,
“Untersuchungen am überlebenden säugethierherzen,”
Pflügers Archiv. Euro. J. Physiol., 70
(9), 473
–486
(1898). https://doi.org/10.1007/BF01662056 Google Scholar
V. V. Kupriyanov, B. Xiang, K. W. Butler, M. St. Jean, and R. Deslauriers,
“Energy metabolism, intracellular and contractile function in isolated pig and rat hearts during cardioplegic ischemia and reperfusion: - and -NMR studies,”
Basic Res. Cardiol., 90
(3), 220
–233
(1995). https://doi.org/10.1007/BF00805665 0300-8428 Google Scholar
G. Lamouche, M. Dufour, B. Gauthier, V. Bartulovic, M. Hewko, and J. P. Monchalin,
“Optical delay line using rotating rhombic prisms,”
Proc. SPIE, 6429 64292G
(2007). https://doi.org/10.1117/12.701047 0277-786X Google Scholar
S. Vergnole, D. Lévesque, and G. Lamouche,
“Experimental validation of an optimized signal processing method to handle non-linearity in swept-source optical coherence tomography,”
Opt. Express, 18
(10), 10446
–10461
(2010). https://doi.org/10.1364/OE.18.010446 1094-4087 Google Scholar
J. M. Schmitt, D. Kolstad, and C. Petersen,
“Intravascular optical coherence tomography opens a window onto coronary artery disease,”
Opt. Photonics News, 15
(2), 20
–25
(2004). 1047-6938 Google Scholar
D. P. Popescu and M. G. Sowa,
“Characteristics of time-domain optical coherence tomography profiles generated from bloodsaline mixtures,”
Phys. Med. Biol., 54
(15), 475975
(2009). https://doi.org/10.1088/0031-9155/54/15/008 0031-9155 Google Scholar
M. G. Sowa, J. R. Payette, M. D. Hewko, and H. H. Mantsch,
“Visible-near infrared multispectral imaging of the rat dorsal skin flap,”
J. Biomed. Opt., 4
(4), 474
–481
(1999). https://doi.org/10.1117/1.429957 1083-3668 Google Scholar
S. P. Nighswander-Rempel, R. A. Shaw, J. R. Mansfield, M. Hewko, V. V. Kupriyanov, and H. H. Mantsch,
“Regional variations in myocardial tissue oxygenation mapped by near-infrared spectroscopic imaging,”
J. Mol. Cell. Cardiol., 34
(9), 1195
–1203
(2002). https://doi.org/10.1006/jmcc.2002.2058 0022-2828 Google Scholar
|


