|
|
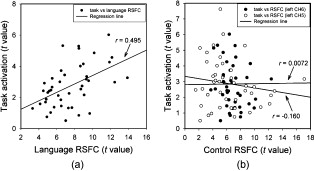
1.IntroductionFunctional connectivity has become one of the important approaches to understanding the organization of the human brain.1 Resting-state functional connectivity (RSFC), which refers to the synchrony of spatially remote spontaneous neural activity in the absence of external stimuli, has recently become a promising method for studying functional connectivity. It is currently believed that RSFC reflects the neural interactions among distant brain regions during the resting state, and implies the intrinsic functional architecture of the human brain.2, 3, 4, 5 On the basis of the resting-state blood oxygen level-dependent (BOLD) signal of the functional magnetic resonance imaging (fMRI) technique, RSFC has emerged as a powerful research approach to investigate brain integration,6 especially to characterize the neural disconnection of diverse neurological and psychiatric disorders.1, 7 Functional near-infrared spectroscopy (fNIRS) is another noninvasive brain imaging technique that monitors brain hemodynamic activity by measuring changes in the concentration of cerebral hemoglobin.8, 9, 10 It has a similar physiological basis as BOLD-fMRI.8 Inspired by fMRI-based RSFC, Lu (2010) and White (2009) independently investigated the feasibility of assessing RSFC with the fNIRS technique, and both successfully utilized RSFC for fNIRS.11, 12 Specifically, using their locally developed diffuse optical tomography system, White found stable RSFC between the bilateral motor and visual areas at an individual-subject level by calculating the correlation coefficient between measurement signals in a seed region and every other channel in the field of view, referred to as the seed-channel correlation (SCC) method.12 Our group, using an ETG-4000 optical topography system, found the interhemispheric RSFC in the motor and auditory areas in a large sample of subjects by using both SCC and automatic clustering approaches.11 Both studies convergently suggest that fNIRS-based RSFC is a feasible approach for exploring brain functional integration in the primary sensory and motor systems. However, whether fNIRS-based RSFC, established in the primary sensory and motor systems, can be used to investigate and study high-level functional systems with more complex functional architecture remains unknown. In this study, the language system was chosen as an example to address this issue because the neural substrates of language have been well documented in the literature. Meanwhile, the related brain areas, e.g., the inferior frontal cortex (IFC) and superior temporal cortex (STC), located in the outer cortex, were easily accessed by fNIRS. In addition, the lateralization characteristic of the language system was found to be helpful in excluding the potential confounding effect of the symmetrical blood supply routes in the cerebral cortex and scalp, which is crucial to understanding the physiological mechanism of fNIRS-based RSFC. 2.Methods2.1.Subjects30 young adults (15 females, age ) with no history of neurological diseases were recruited from Beijing Normal University. All subjects were right handed as assessed by the Edinburgh Handedness Inventory.13 Before the experiment, informed consent was obtained according to the procedure approved by the Review Board at the State Key Laboratory of Cognitive Neuroscience and Learning of Beijing Normal University. 2.2.Functional Near-Infrared Spectroscopy MeasurementThe experiment consisted of an resting-state measurement session followed by a localizer task measurement session. To avoid the confounding effect of the task on the resting-state measurement, subjects did not know the task prior to the experiment. During the resting-state measurement session, subjects were instructed to remain still with their eyes closed, staying as motionless as much as possible, and to perform no specific cognitive exercise. During the task measurement session, a blocked design task was performed to induce task-related signal changes and help locate language cortices. In brief, subjects were instructed to overtly generate verbs immediately after hearing auditorily presented concrete nouns in eight task periods alternating with of rest (viewing a fixed “+”). The concrete nouns were matched in aspects of conceptual familiarity, word frequency, and verb-generation difficulty as assessed by another 29 subjects who were not involved in the present study. The stimuli were presented and synchronized with the fNIRS equipment using E-prime software (v.1.2, Psychological Software Tools, Pittsburgh, Pennsylvania). During fNIRS measurement, subjects were seated in a chair in a silent room with dim lighting. fNIRS measurements were conducted using an ETG-4000 optical topography system (Hitachi Medical Company, Tokyo, Japan). The absorption of near-infrared light at two wavelengths (695 and ) was measured with a sampling rate of . Based on the modified Beer-Lambert law,14 the concentration changes in oxygenated hemoglobin (oxy-Hb) and deoxygenated hemoglobin (deoxy-Hb) for each channel were obtained. Because the previous studies by Hoshi10 and our group11 both showed that oxy-Hb was the most sensitive indicator of changes in regional cerebral blood flow in fNIRS measurements, this study focused on the concentration changes of oxy-Hb. Two optode probe sets (eight emitters and seven detector probes, 22 measurement channels, and optode separation) were used in this study. The probe holders were placed over the bilateral frontal and temporal area, with the left channel 21 (left CH 21) above T3 and the right channel 3 (right CH 3) above T4 [Fig. 1 ] in accordance with the international 10–20 system.15 Moreover, an additional structural MR image was scanned from one subject to assist in anatomical localization of the fNIRS measurements. In Fig. 1, all of the measurement channels marked by vitamin E capsules are visible. After the MR image was normalized into the Montreal Neurological Institute (MNI) standard brain space using SPM5 software (see http://www.fil.ion.ucl.ac.uk/spm), a balloon-inflation model16 was used to project the measurement channels (i.e., marked by the vitamin E capsules) onto the cortical surface. The estimated locations were then labeled according to the widely adopted automated anatomical labeling (AAL) template17 and marked in color, as shown in Fig. 1. Fig. 1Anatomical positions of the fNIRS measurements and the activation/RSFC map. (a) The structural MRI image with the probe holder. All of the measurement channels are marked by vitamin E capsules. (b) Anatomical position of each measurement channel. Red represents the channels covering the regions of interest (i.e., the IFC and STC). (c) Group-level maps of the language localizer task. (d) Group-level RSFC map from the language seed channel. (e) and (f) Group-level RSFC maps from both control seed channels (CH6 and CH5). Blue circles indicate the seed channels. (Color online only.) 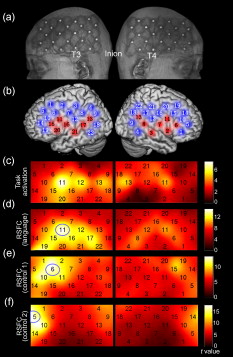 2.3.Data AnalysisDuring data preprocessing, five subjects were excluded from any further analysis because they either showed large head movements, or the data were too noisy due to hair obstruction. The following analysis was performed using Matlab (Mathworks version 7.1, Natick, Massachusetts) and NIRS-SPM software.18 2.3.1.Localizer task analysisFor the localizer task measurement data, the initial of baseline data were excluded for the signal to reach a steady state. A temporal high-pass filter 19, 20 was applied to remove the low frequency noise fluctuations but retain the task-related frequency components. The evoked response of the oxy-Hb signal was estimated by using the general linear model (GLM) approach with consideration of time series autocorrelation, using the precoloring method.18, 21, 22 Thereafter, a group-level random effect analysis was performed on individual responses (i.e., the images) to infer which channels were statistically significantly activated by the localizer task. Finally, the channel with peak activation within the dominant language areas (i.e., the left IFC and STC) was selected as the seed channel in the language system for the following RSFC analysis. 2.3.2.Resting-state functional connectivity analysisFor measurement of resting-state data, the first and the last were discarded for steady-state control. The data were then bandpass filtered to extract the low frequency fluctuation (LFF) signals .23 Individual RSFC estimation was then performed using the GLM approach, in which the time course of the seed channel was used as the independent variable. The autocorrelation of the time course was taken into consideration as mentioned before. The estimated regression parameter (i.e., ) indicated to what extent the LFFs of each channel correlated to that of the seed channel. Finally, a group-level random effect analysis was conducted on the individual images to identify the RSFC map of the language system. To quantitatively compare the RSFC strength inside the language areas with that outside, a region of interest (ROI) analysis was further conducted. Four ROIs were selected based on their anatomical localization [see Figs. 1 and Fig. 2 ], with two inside and two outside the language system. The two language ROIs (L-ROIs) were the left IFC (L-ROI-IFC, left CH 15, 16, and 20) and STC (L-ROI-STC, left CH 13, 17, and 21), respectively. The two ROIs outside of the language system (OL-ROIs) were located in the left middle frontal cortex (MFC). One OL-ROI (OL-ROI-adj, left CH 6 and 10) was adjacent to the dominant language areas, while the other OL-ROI (OL-ROI-rem, left CH 1 and 5) was spatially remote from the dominant language areas [ , see Fig. 2]. For each subject, the connectivity strength of each ROI to the seed channel was defined as the maximum value in corresponding ROI.24 Finally, one-way ANOVA analysis and post hoc tests were performed to detect differences in connectivity strength between these ROIs (SPSS v15, Incorporated, Chicago, Illinois). Fig. 2ROI analysis results. (a) Schematic position of each ROI. (b) The RSFC strengths of each ROI across all subjects. The RSFC strengths of these four ROIs were significantly different [ , ]. Error bar indicates standard error. (c) Post hoc tests between each pair of ROIs. For (c), gray color, , and dark gray, (Bonferroni corrected). 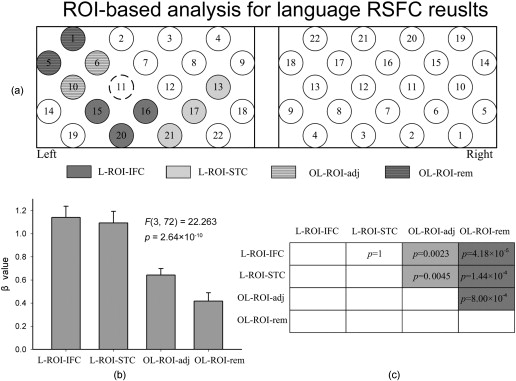 2.3.3.Lateralization analysisLeft hemispheric dominance is assumed for the language function and has been reported in task-related neuroimaging studies.25, 26, 27 Thus, we examined whether the resulting language RSFC map could show the left lateralization to further validate the RSFC results. First, the individual language image was converted into an individual-level image to represent the statistical significance of RSFC in each subject. Next, a threshold was defined for each subject as 50% of the maximum value among all measurement channels (except for the seed channel), and the sum of the values above this threshold was computed. Then, a lateralization index (LI) for each individual subject was defined as , ,28, 29, 30 where is the sum of values in the left hemisphere, and is the sum of values in the right hemisphere. 2.3.4.Validity and reliability assessmentFor validation purposes, two channels (left CH 5 and CH 6) were also selected outside the language area as the control seed channels. Based on the control seed channels, two additional RSFC maps were computed as control RSFC maps. To assess the reliability of RSFC results, two tests were performed. First, to estimate the potential influence of individual variation on the RSFC results, all subjects were randomly divided into two equally sized subgroups, and the language RSFC map was computed for each half-group. The consistency between the two generated group-level RSFC results was estimated by Pearson’s correlation analysis. Second, to evaluate the temporal stability of the RSFC pattern, the full length of the time courses of the fNIRS signals was evenly segmented into two parts. Then, the correlation between the two resulting RSFC maps was computed to evaluate their consistency. 3.Results3.1.Localizer Task ResultsThe activation map of the language localizer task is shown in Fig. 1. From the figure, the strongest foci of activation were found in the IFC and STC of the left hemisphere. The right homologous areas also showed activations. Because the left CH 11 within the left IFC showed the peak activation, it was defined as the seed channel for the RSFC analysis in the language system. 3.2.Resting-State Functional Connectivity ResultsFigure 1 shows the resulting RSFC map of the language system. A significant correlation was found between the RSFC map and the language task-induced activation map, as shown in Fig. 1 [ , , see Fig. 3 ], suggesting the similar functional anatomy of both the spontaneous and evoked brain activity related to the language system. ROI analysis results are shown in Figs. 2 and 2. The RSFC strengths of the four ROIs to seed channel were significantly different [ , ]. Specifically, the RSFC strengths of the two L-ROIs were significantly stronger than that of the two OL-ROIs ( , between the L-ROI-IFC and OL-ROI-adj; , between the L-ROI-IFC and OL-ROI-rem; , between the L-ROI-STC and OL-ROI-adj; and , for the L-ROI-STC and OL-ROI-rem, Bonferroni corrected). 3.3.Lateralization Index ResultsAs shown in Fig. 4 (left), the average LI of the language RSFC across subjects was , indicating a relatively strong left side lateralization. Because the left seed channel can bias the resulting language RSFC map toward the left hemisphere due to spatial correlation, the LI was also computed for the RSFC map derived using left CH 5 (outside the language system) as the control seed channel. Although the average control LI showed a weak left side lateralization, as shown in Fig. 4 (right), the language RSFC LI was significantly stronger than that of the control RSFC map (paired -test, , ). 3.4.Validity and Reliability of the Language Resting-State Functional ConnectivityAs shown in Figs. 1 and 1, the RSFC maps from both control seed channels (i.e., left CH 6 and left CH 5) showed different patterns from the language RSFC map ( and for left CH 6, and and for left CH 5). These control RSFC maps were also significantly different from the language task activation map ( and for left CH 6, and and for left CH 5) [see Fig. 3]. These results indicated that the revealed fNIRS-based RSFC is specific to the language system rather than a general phenomenon. The RSFC results based on the two randomly generated subgroups of subjects are shown in Fig. 5 . The resulting group-level RSFC maps were fairly similar to each other (Pearson correlation: and ). Similarly, the RSFC results generated from the first and second half of the fNIRS time courses are shown in Fig. 6 . They were also similar to each other (Pearson correlation: and ), and both are similar to the map computed from the full length time course (Pearson correlation: and for the first half; and for the second half). Moreover, these consistencies also existed at the individual subject level, as shown Fig. 6. Thus, all of these results indicated a high level of reliability of the fNIRS-based RSFC results. Fig. 5Consistency between the RSFC results derived from two randomly generated subgroups of subjects, evaluated by (a) group-level RSFC maps and (b) linear regression analysis. Blue circle indicates the seed channel. A dot in the scatter plot indicates a measurement channel, and the solid line is the linear regression line. (Color online only.) 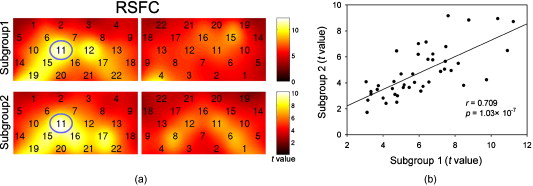 Fig. 6Temporal reliability of the language system RSFC map. The RSFC maps are computed from (a) the two split-half datasets, and (b) the group- and (c) subject-level linear regressions between the two results. Blue circles indicate the seed channel. A dot in the scatter plot indicates a measurement channel, and the solid lines are the linear regression lines. (Color online only.) 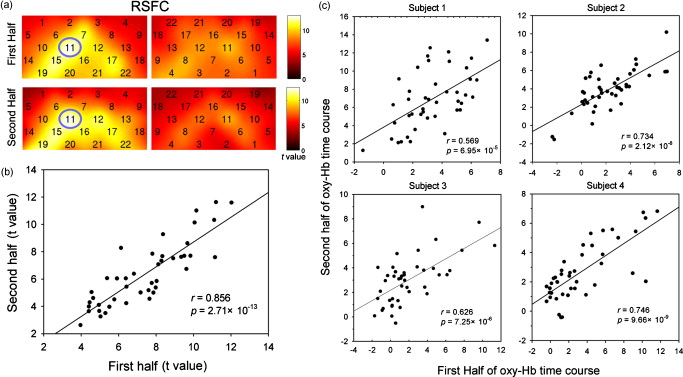 4.Discussion4.1.Feasibility of Investigating Language Resting-State Functional Connectivity by the Functional Near-Infrared Spectroscopy TechniqueAlthough fNIRS has been shown to be able to detect RSFC in the primary sensory and motor systems,11, 12 whether this technique can be used to detect RSFC in high-level neural systems remains unclear. The present study, for the first time, demonstrated the feasibility of investigating RSFC by fNIRS in a high-level neural system (i.e., the language system). 4.1.1.Characteristics of the language resting-state functional connectivityOur results showed that language-related brain regions could be identified by using the RSFC approach with a language seed channel. First, the RSFC map was significantly correlated with the task activation map. Second, the RSFC strengths in the two language ROIs (i.e., L-ROIs) were statistically significantly stronger than those in the two ROIs outside the language area (i.e., OL-ROIs). This finding is consistent with previous fMRI-based RSFC results31 and is supported by previous anatomical evidence that the perisylvian language network (i.e., the Brocas and Wernicke areas) is directly connected by the arcuate fasciculus.32, 33 Third, the language RSFC map was significantly lateralized to the left hemisphere. This effect replicated the well-known left lateralization phenomenon of language function,34, 35 and was consistent with previous fMRI-based RSFC results.1, 23, 36, 37, 38 Collectively, our results showed that fNIRS-based RSFC can be used to describe the functional architecture in the language system. 4.1.2.Validity and reliabilityWhen control seed channels were selected from outside the language areas, distinct RSFC maps were identified [see Figs. 1 and 1]. This indicated that the aforementioned fNIRS-based RSFC is specific to a particular neural system (i.e., the language system) rather than a general phenomenon. Thus, this conclusion proved the validity of fNIRS-based RSFC detection. In addition, the reliability of fNIRS-based RSFC in the language system was also examined. First, for the two randomly divided subgroups, the resultant RSFC maps showed statistically significant correlation, indicating reliability of fNIRS-based RSFC results across subjects (see Fig. 5). Second, for the first-half, second-half, and entire time course, the resultant RSFC maps were quite similar and significantly correlated to each other (see Fig. 6). This finding suggests temporal stability of the RSFC pattern. Thus, these results convincingly indicate the high reliability of fNIRS-based RSFC in the language system. 4.1.3.IssuesWe are well aware that physiological interference and the limited spatial resolution of fNIRS measurement can have confounding effects on fNIRS-based RSFC results. Physiological fluctuations (e.g., cardiac pulsations, respiration, and blood pressure variations) appear as interfering signals in fNIRS studies. White reported that such physiological interferences can obscure or even overwhelm the resting-state functional connectivity.12 However, the RSFC in the language system was successively detected in the present study. Moreover, the sensorimotor and auditory system RSFCs were also found in our previous study.11 These inconsistencies concerning the impact of physiological interference on RSFC results might be related to the different imaging systems, and further research on this issue is expected. The limited spatial resolution of fNIRS measurement (e.g., ) may cause partial volume effects, especially near the boundary of different functional systems, and thus affect the RSFC results. Here, ROI analysis results, as shown in Fig 2, were used to evaluate this effect. Although the OL-ROI-adj ( from the seed channel) and the OL-ROI-rem ( from the seed channel) were both outside of the language area, the RSFC strength of the OL-ROI-adj was significantly stronger than that of the OL-ROI-rem ( and , Bonferroni corrected). One possible reason is that the OL-ROI-adj shared some information from the language system due to the partial volume effect and thus correlated with the seed channel in the language system more than the OL-ROI-rem did. However, the RSFC strength of the OL-ROI-adj was significantly lower ( and , Bonferroni corrected) than that of the L-ROI-STC, which was from the seed channel and thus partial volume effects hardly contributed to the RSFC result. These comparisons suggested that although the limited spatial resolution of fNIRS measurement can, to some degree, confound the RSFC results, the language system RSFC can still be successfully detected. 4.2.Strengths and Limitations of the Functional Near-Infrared Spectroscopy Technique for Investigating Resting-State Functional ConnectivityThe use of fNIRS has several advantages over fMRI for RSFC studies, especially for developmental and clinical studies. First, fNIRS is safe, tolerant of movement, and can accommodate a realistic environment. These attributes make fNIRS an ideal choice for repeated, short-interval measurement and lengthy continuous recording on special populations such as neonates, infants, and intensive care patients who are not amenable to fMRI. Second, fNIRS can be conducted in silence, which makes fNIRS more suitable for resting-state measurements during RSFC studies. Third, fNIRS has a high temporal sampling rate . It further prevents aliasing of higher frequency physiological interferences into LFFs and makes a more reliable RSFC estimation. Moreover, it provides information about more specific physiological variables (e.g., oxy-Hb, deoxy-Hb, and total-Hb). This attribute allows fNIRS to provide a more comprehensive understanding of RSFC than fMRI. Finally, the optical signal does not interfere with electrical or magnetic fields. Thus, fNIRS is ideally compatible with other technologies, such as EEG and TMS. This attribute makes it possible to provide multiple indices of RSFC in neurological and physiological aspects. fNIRS also has several potential limitations. First, the measurement area of fNIRS is limited to the outer cortex, because the typical depth sensitivity of most fNIRS systems is about below the scalp due to the diffusion of photons. Thus, fNIRS is unsuited for investigating brain activation in deeper regions, such as the basal ganglia and amygdale. This constrains functional integration studies related to these deeper structures using the fNIRS-based RSFC approach. Second, most currently available fNIRS systems can only cover part of the brain, even with a multichannel fNIRS system. This makes it difficult to explore the complex connectivity pattern among all of the cortical neural systems. Third, fNIRS has a spatial resolution on the order of , which is larger than fMRI . The limited resolution may hinder the specificity of fNIRS-based RSFC results. Finally, the detected fNIRS signals contain significant noise that is related to systemic physiological hemodynamic fluctuations, such as cardiac pulsation, respiratory signals, and blood pressure changes. Eliminating the adverse effect of instrumental noise and physiological interferences on fNIRS-based RSFC is still a challenge. 4.3.Future WorksAs mentioned before, the resting-state fNIRS measurements reflect not only the cerebral hemodynamic fluctuations related to spontaneous brain activity but also hemodynamic changes of systemic origin. Thus, reducing the influence of physiology interference and improving the specificity of fNIRS-based RSFC is an important direction for future fNIRS studies. Moreover, only the language system RSFC was investigated in the present study. Additional experiments are needed to understand other high-level functional systems and further extend the application fields of fNIRS-based RSFC. 5.ConclusionIn this study, we reveal for the first time the RSFC in the language system using the fNIRS technique. This result validates the feasibility of fNIRS-based RSFC and extends fNIRS-based RSFC from the primary sensory and motor systems to high-level functional systems. This research will broaden the potential applications of the fNIRS-based RSFC approach for developmental and clinical neuroscience, especially investigations related to language function. AcknowledgmentsThis work was supported by the National Key Basic Research and Development Program (973) grant number 2003CB716101 and the Natural Science Foundation of China (NSFC) (30970773) and (30900393). ReferencesD. P. Auer,
“Spontaneous low-frequency blood oxygenation level-dependent fluctuations and functional connectivity analysis of the ‘resting’ brain,”
Magn. Reson. Imaging, 26
(7), 1055
–1064
(2008). https://doi.org/10.1016/j.mri.2008.05.008 0730-725X Google Scholar
A. Shmuel and D. A. Leopold,
“Neuronal correlates of spontaneous fluctuations in fMRI signals in monkey visual cortex: Implications for functional connectivity at rest,”
Hum. Brain Mapp, 29
(7), 751
–761
(2008). https://doi.org/10.1002/hbm.20580 1065-9471 Google Scholar
B. J. He, A. Z. Snyder, J. M. Zempel, M. D. Smyth, and M. E. Raichle,
“Electrophysiological correlates of the brain’s intrinsic large-scale functional architecture,”
Proc. Natl. Acad. Sci. U.S.A., 105
(41), 16039
–16044
(2008). https://doi.org/10.1073/pnas.0807010105 0027-8424 Google Scholar
M. P. van den Heuvel, R. C. Mandl, R. S. Kahn, and H. E. Hulshoff Pol,
“Functionally linked resting-state networks reflect the underlying structural connectivity architecture of the human brain,”
Hum. Brain Mapp, 30
(10), 3127
–3141
(2009). https://doi.org/10.1002/hbm.20737 1065-9471 Google Scholar
C. J. Honey, O. Sporns, L. Cammoun, X. Gigandet, J. P. Thiran, R. Meuli, and P. Hagmann,
“Predicting human resting-state functional connectivity from structural connectivity,”
Proc. Natl. Acad. Sci. U.S.A., 106
(6), 2035
–2040
(2009). https://doi.org/10.1073/pnas.0811168106 0027-8424 Google Scholar
M. D. Fox and M. E. Raichle,
“Spontaneous fluctuations in brain activity observed with functional magnetic resonance imaging,”
Nat. Rev. Neurosci., 8
(9), 700
–711
(2007). https://doi.org/10.1038/nrn2201 1471-003X Google Scholar
M. Greicius,
“Resting-state functional connectivity in neuropsychiatric disorders,”
Curr. Opin. Neurol., 21
(4), 424
–430
(2008). https://doi.org/10.1097/WCO.0b013e328306f2c5 1350-7540 Google Scholar
S. C. Bunce, M. Izzetoglu, K. Izzetoglu, B. Onaral, and K. Pourrezaei,
“Functional near-infrared spectroscopy,”
IEEE Eng. Med. Biol. Mag., 25
(4), 54
–62
(2006). https://doi.org/10.1109/MEMB.2006.1657788 0739-5175 Google Scholar
F. F. Jöbsis,
“Noninvasive, infrared monitoring of cerebral and myocardial oxygen sufficiency and circulatory parameters,”
Science, 198
(4323), 1264
–1267
(1977). https://doi.org/10.1126/science.929199 0036-8075 Google Scholar
Y. Hoshi,
“Functional near-infrared spectroscopy: current status and future prospects,”
J. Biomed. Opt., 12
(6), 062106
(2007). https://doi.org/10.1117/1.2804911 1083-3668 Google Scholar
C. M. Lu, Y. J. Zhang, B. B. Biswal, Y. F. Zang, D. L. Peng, and C. Z. Zhu,
“Use of fNIRS to assess resting state functional connectivity,”
J. Neurosci. Methods, 186
(2), 242
–249
(2010). https://doi.org/10.1016/j.jneumeth.2009.11.010 0165-0270 Google Scholar
B. R. White, A. Z. Snyder, A. L. Cohen, S. E. Petersen, M. E. Raichle, B. L. Schlaggar, and J. P. Culver,
“Resting-state functional connectivity in the human brain revealed with diffuse optical tomography,”
Neuroimage, 47
(1), 148
–156
(2009). https://doi.org/10.1016/j.neuroimage.2009.03.058 1053-8119 Google Scholar
R. C. Oldfield,
“The assessment and analysis of handedness: the Edinburgh inventory,”
Neurophysiology, 9
(1), 97
–113
(1971). 0090-2977 Google Scholar
M. Cope and D. T. Delpy,
“System for long-term measurement of cerebral blood and tissue oxygenation on newborn infants by near infra-red transillumination,”
Med. Biol. Eng. Comput., 26
(3), 289
–294
(1988). https://doi.org/10.1007/BF02447083 0140-0118 Google Scholar
H. H. Jasper,
“The ten–twenty electrode system of the International Federation. Electroencephalogr.,”
Clin. Neurophysiol., 10 367
–380
(1958). 1388-2457 Google Scholar
M. Okamoto and I. Dan,
“Automated cortical projection of head-surface locations for transcranial functional brain mapping,”
Neuroimage, 26
(1), 18
–28
(2005). https://doi.org/10.1016/j.neuroimage.2005.01.018 1053-8119 Google Scholar
N. Tzourio-Mazoyer, B. Landeau, D. Papathanassiou, F. Crivello, O. Etard, N. Delcroix, B. Mazoyer, and M. Joliot,
“Automated anatomical labeling of activations in SPM using a macroscopic anatomical parcellation of the MNI MRI single-subject brain,”
Neuroimage, 15
(1), 273
–289
(2002). https://doi.org/10.1006/nimg.2001.0978 1053-8119 Google Scholar
J. C. Ye, S. Tak, K. E. Jang, J. Jung, and J. Jang,
“NIRS-SPM: statistical parametric mapping for near-infrared spectroscopy,”
Neuroimage, 44
(2), 428
–447
(2009). https://doi.org/10.1016/j.neuroimage.2008.08.036 1053-8119 Google Scholar
A. Smith, N. Cotillon-Williams, and A. Williams,
“Attentional modulation in the human visual cortex: the time-course of the BOLD response and its implications,”
Neuroimage, 29
(1), 328
–334
(2006). https://doi.org/10.1016/j.neuroimage.2005.07.003 1053-8119 Google Scholar
M. Brass, J. Derrfuss, and D. von Cramon,
“The inhibition of imitative and overlearned responses: A functional double dissociation,”
Neurophysiology, 43
(1), 89
–98
(2005). 0090-2977 Google Scholar
M. L. Schroeter, M. M. Bucheler, K. Muller, K. Uludag, H. Obrig, G. Lohmann, M. Tittgemeyer, A. Villringer, and D. Y. von Cramon,
“Towards a standard analysis for functional near-infrared imaging,”
Neuroimage, 21
(1), 283
–290
(2004). https://doi.org/10.1016/j.neuroimage.2003.09.054 1053-8119 Google Scholar
K. J. Worsley and K. J. Friston,
“Analysis of fMRI time-series revisited—again,”
Neuroimage, 2
(3), 173
–181
(1995). https://doi.org/10.1006/nimg.1995.1023 1053-8119 Google Scholar
B. Biswal, F. Z. Yetkin, V. M. Haughton, and J. S. Hyde,
“Functional connectivity in the motor cortex of resting human brain using echo-planar MRI,”
Magn. Reson. Med., 34
(4), 537
–541
(1995). https://doi.org/10.1002/mrm.1910340409 0740-3194 Google Scholar
H. D. Xiang, H. M. Fonteijn, D. G. Norris, and P. Hagoort,
“Topographical functional connectivity pattern in the perisylvian language networks,”
Cereb. Cortex, 20
(3), 549
–560
(2010). https://doi.org/10.1093/cercor/bhp119 1047-3211 Google Scholar
J. E. Adcock, R. G. Wise, J. M. Oxbury, S. M. Oxbury, and P. M. Matthews,
“Quantitative fMRI assessment of the differences in lateralization of language-related brain activation in patients with temporal lobe epilepsy,”
Neuroimage, 18
(2), 423
–438
(2003). https://doi.org/10.1016/S1053-8119(02)00013-7 1053-8119 Google Scholar
J. P. Szaflarski, S. K. Holland, V. J. Schmithorst, and A. W. Byars,
“fMRI study of language lateralization in children and adults,”
Hum. Brain Mapp, 27
(3), 202
–212
(2006). https://doi.org/10.1002/hbm.20177 1065-9471 Google Scholar
D. P. Anderson, A. S. Harvey, M. M. Saling, V. Anderson, M. Kean, D. F. Abbott, R. M. Wellard, and G. D. Jackson,
“FMRI lateralization of expressive language in children with cerebral lesions,”
Epilepsia, 47
(6), 998
–1008
(2006). https://doi.org/10.1111/j.1528-1167.2006.00572.x 0013-9580 Google Scholar
M. L. Seghier,
“Laterality index in functional MRI: methodological issues,”
Magn. Reson. Imaging, 26
(5), 594
–601
(2008). https://doi.org/10.1016/j.mri.2007.10.010 0730-725X Google Scholar
G. Fernandez, A. de Greiff, J. von Oertzen, M. Reuber, S. Lun, P. Klaver, J. Ruhlmann, J. Reul, and C. E. Elger,
“Language mapping in less than : real-time functional MRI during routine clinical investigation,”
Neuroimage, 14
(3), 585
–594
(2001). https://doi.org/10.1006/nimg.2001.0854 1053-8119 Google Scholar
A. Jansen, R. Menke, J. Sommer, A. F. Forster, S. Bruchmann, J. Hempleman, B. Weber, and S. Knecht,
“The assessment of hemispheric lateralization in functional MRI—robustness and reproducibility,”
Neuroimage, 33
(1), 204
–217
(2006). https://doi.org/10.1016/j.neuroimage.2006.06.019 1053-8119 Google Scholar
M. Hampson, B. S. Peterson, P. Skudlarski, J. C. Gatenby, and J. C. Gore,
“Detection of functional connectivity using temporal correlations in MR images,”
Hum. Brain Mapp, 15
(4), 247
–262
(2002). https://doi.org/10.1002/hbm.10022 1065-9471 Google Scholar
M. Catani, D. K. Jones, and D. H. ffytche,
“Perisylvian language networks of the human brain,”
Ann. Neurol., 57
(1), 8
–16
(2005). https://doi.org/10.1002/ana.20319 0364-5134 Google Scholar
C. Lebel and C. Beaulieu,
“Lateralization of the arcuate fasciculus from childhood to adulthood and its relation to cognitive abilities in children,”
Hum. Brain Mapp, 30
(11), 3563
–3573
(2009). https://doi.org/10.1002/hbm.20779 1065-9471 Google Scholar
P. Broca,
“Remarques sur le siege de la faculté du langage articulé, suivies d’une observation d’aphemie (Perte de la Parole),”
Bulletin de la Société Anatomique, 330
–357
(1861). Google Scholar
C. Wernicke, Der Aphasische Symptomencomplex: eine Psychologische Studie auf Anatomischer Basis,
(1874) Google Scholar
D. Cordes, V. M. Haughton, K. Arfanakis, G. J. Wendt, P. A. Turski, C. H. Moritz, M. A. Quigley, and M. E. Meyerand,
“Mapping functionally related regions of brain with functional connectivity MR imaging,”
AJNR Am. J. Neuroradiol., 21
(9), 1636
–1644
(2000). 0195-6108 Google Scholar
M. J. Lowe, B. J. Mock, and J. A. Sorenson,
“Functional connectivity in single and multislice echoplanar imaging using resting-state fluctuations,”
Neuroimage, 7
(2), 119
–132
(1998). https://doi.org/10.1006/nimg.1997.0315 1053-8119 Google Scholar
T. Stein, C. Moritz, M. Quigley, D. Cordes, V. Haughton, and E. Meyerand,
“Functional connectivity in the thalamus and hippocampus studied with functional MR imaging,”
AJNR Am. J. Neuroradiol., 21
(8), 1397
–1401
(2000). 0195-6108 Google Scholar
|