|
|
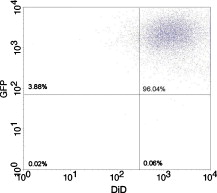
1.IntroductionCurrent research on cancer metastasis is investigating the key role played by various types of circulating tumor cells (CTCs).1, 2 It has been reported that the presence of CTCs in the bloodstream correlates strongly with cancer metastasis and progression.3 As CTCs are detected even at early stages of cancer without overt metastasis,4 quantitative detection of CTCs can help clinicians to assess patients’ responses to therapy and can aid in prognosis, diagnosis, and detection of disease recurrence.2, 5, 6 Therefore, there is great interest in developing techniques to detect the presence of cancer cells in the bloodstream. As the presence of CTCs in the circulation is quite rare, several in vitro CTC-enrichment techniques have been developed for a number of tumor types and disease stages, incorporating sensitive immunocytochemical and molecular assays that detect tumor cell–or epithelial cell–specific markers.7, 8, 9 Recent studies have demonstrated the applicability of techniques such as automated enrichment and immunodetection,10, 11 or microfluidic platform-based “CTC-Chip” immuno-capture system12 for CTC quantification. The study of CTC dynamics and the potential clinical application of real-time CTC monitoring would benefit from a simpler approach not requiring isolation and enrichment of the CTC population. One approach could be the adaptation of conventional flow cytometry. Attempts to detect CTCs using isolated blood samples has been reported;13 however, the method is limited by the low detection efficiency primarily due to the low volume of blood that can be tested. Moreover, because of the stable hydrodynamic flow stream required to perform quantitative cell characterization, cytometry must usually be performed in vitro or ex vivo. Blood samples need to be extracted from patients or animals, followed by ex vivo labeling and detection. The removal of cells from their native environment and the additional processing before the measurements can introduce potential artifacts. In addition, the extracted blood samples contain different cell populations each time, which cannot reflect the evolving situation in the living body. Consequently, it is desirable to enumerate cells in vivo in real time to monitor the progress of the disease.6, 14 To detect circulating cells noninvasively in vivo, two major approaches have been developed. One is using microscope-based one-photon or multiphoton-induced fluorescence detection.6, 14, 15, 16 The other is based on photothermal or photoacoustic detection techniques.17, 18, 19 Although these methods have shown promise to detect circulating cells in the vasculature, only peripheral blood vessels can be accessed by free-space detection techniques due to the scattering and absorption of biological tissues. The blood volume sampled by these techniques is always less than (consider a blood vessel of in diameter with an average flow velocity of ).20 However, the concentration of CTCs in the bloodstream is less than 1 cell per milliliter in the early stage of the disease. It is therefore necessary to sample a large volume of blood; hence, long-term monitoring is necessary. For free-space monitoring techniques, the focus of the laser beam must be maintained in the blood vessel, requiring the subject to be immobilized or anesthetized, and this severely limits the acquisition time. The sampled blood volume is thus too small to practically identify rare CTCs in clinical applications. We propose to use a sensitive fiber-optic probe as a minimally invasive technique to access large blood vessels deep inside the body to increase the sampled blood volume. We have previously developed a two-photon optical fiber fluorescence (TPOFF) probe based on a single-mode fiber and have used the probe to quantify fluorescence in solid tumors in live mice on a real-time basis.21, 22 Using a double-clad fiber (DCF) as the probe, we demonstrated more than one order of magnitude increase in the detected two-photon excited fluorescence signals.23, 24, 25 Here, we demonstrate the use of this DCF-TPOFF probe to conduct two-wavelength-channel cell detection, first in whole blood in vitro, and subsequently in vivo. Fiber-based detection has several distinct advantages. First, we demonstrate that, since the detection of fluorescence from the tip of a fiber inserted into whole blood circumvents the usual problems associated with light scattering and absorption, a substantially higher sensitivity and detection efficiency are obtained relative to free-space techniques. Specifically, we find significantly higher detection efficiency for green fluorescent protein (GFP)–expressing cells in whole blood and in vivo, despite the fact that the fluorescence spectrum strongly overlaps the blood absorption. Second, since the scattering and absorption are essentially eliminated, the fiber can be inserted into tissue or large blood vessels, so cell monitoring is no longer limited to peripheral vessels as with free-space detection. Hence, long-term monitoring of a much larger blood volume will be possible. Last, as tumors are very heterogeneous and there are no single markers that are universally expressed in all tumors, it is essential to develop methods to simultaneously detect multiple tumor markers on CTC’s.8 The TPOFF method described allows the simultaneous detection of multiple tumor markers using a single excitation laser beam (unpublished data). Thus, the TPOFF probe provides a promising way of conducting long-term, real-time monitoring of circulating cells in animal models or in patients to advance the understanding of cancer biology or post-therapy response surveillance. 2.Materials and Methods2.1.Two-Channel Two-Photon Optical-Fiber Fluorescence Probe SetupThe experimental setup is shown in Fig. 1 . The Ti:sapphire oscillator (Coherent, Inc., Mira 900) produced pulses at a repetition rate of . The pulses were dispersion precompensated with a grating pair to optimize the intensity at the output of the fiber. The fluorescence signal was collected back by the same fiber and separated from the excitation beam by a dichroic mirror (cutoff at ). The fluorescence signal was further separated into two wavelength channels by another dichroic mirror (cutoff ). The fluorescence signals were filtered by bandpass filters (short-wavelength channel: bandwidth centered at ; long-wavelength channel: bandwidth centered at ) before detection by photomultiplier tubes (PMTs, Hamamatsu, H7422-40). The PMT signals were labeled in a router and then processed in a time-correlated single photon counting (TCSPC) module (SPC630, Becker and Hickl, GmbH). The DCF used in this study had an inner core diameter of with an NA of 0.15 and a inner cladding diameter with an NA of 0.46 (P6/123DC, Liekki Corp.). The length of the fiber was about 1 m. The excitation power at the sample was with pulse duration of . The two-photon excitation volume was calibrated by fluorescence correlation spectroscopy technique to be about (Ref. 24). 2.2.In Vitro StudiesThe cells used in this study were from the mouse sarcoma MCA-207 cell line. Untransfected cells and GFP-transfected cells were maintained in the facility of the Michigan Nanotechnology Institute for Medical and Biological Sciences at the University of Michigan. The stably GFP-transfected cells were labeled with the membrane-binding lipophilic dye -dioctadecyl- -tetramethylindoldicarbocyanine, 4-chlorobenzenesulfonate (DiD) (Invitrogen, emission maximum: ) according to manufacturer’s protocol to produce dual-labeled GFP-DiD cells. The cells were then washed by phosphate-buffered saline (PBS) and resuspended in either PBS or 50% bovine whole blood and 50% PBS mixture at a concentration of cells per milliliter. The cells were flowed through transparent plastic microtubes (Tygon, Microbore). The cells were injected into one end of the tube through a syringe needle, and the flow rate was controlled with a syringe pump (KDS-100, KDS Scientific). The steady flow with a flow rate of was used to simulate the blood flow in the vein.26 The fiber probe was inserted into the other (distal) end of the tube with its position controlled by a translation stage. 2.3.Animals for In Vivo StudiesMale specific-pathogen-free CD1 30-32 mice were purchased from Charles River Laboratories (F38989, Portage, Michigan) and housed in a pathogen-free animal facility at the University of Michigan Medical Center. The handling of the mice was in accordance with the regulations of the University’s Committee on the Use and Care of Animals as well as with federal guidelines, including the principles of Laboratory Animal Care. The mice were anesthetized by inhalation of isoflurane before and during the measurements. DiD-labeled, untransfected MCA-207 cells or DiD-labeled, GFP-transfected MCA-207 cells were injected into the mice to monitor the circulating and depletion dynamics of the cells. The mice were euthanized at the end of the experiments. 2.4.In Vivo Fiber-Optic Two-Photon Flow Cytometry MeasurementsTo conduct in vivo two-photon flow cytometry studies, we inserted the fiber probe into the left liver lobe of mice; the liver was chosen for the proof-of-principle experiments because of its high density of blood vessels and abundant blood flow. In order to insert the fiber into the organ, the fiber was inserted through a syringe needle and fixed with a homemade holder. The fiber probe was stably controlled by a translation stage. The location of the fiber probe was chosen by real-time monitoring of the fluorescence intensity of the cell events together with visual inspection. Before the injection of the labeled cells, the background signals in both the short and long channels were recorded as control. The laser power was at the fiber probe, and no photodamage to the tissue was observed after the experiments. For measurements of the dynamics of circulating fluorescent cells, or of DiD-labeled MCA-207 normal cells with a concentration of were injected into the tail vein or spleen of the mouse, respectively. The cell suspensions were prepared by the same procedure as mentioned in Sec. 2.2. Immediately after the injection, the two-photon fluorescence signal of the long (DiD) channel was recorded for at least . Each experiment was repeated four times. To demonstrate the ability of monitoring circulating GFP-expressing cells in vivo, the GFP-transfected MCA-207 cells were dual-labeled with DiD and injected into the mice through multiple locations. When an event was present in both channels simultaneously, the detection of a GFP-expressing cell was confirmed. Because of the difference of injection routes and the sizes of the organs, the injected volumes of the cell suspensions were different: we injected into the tail vein, into the right lobe of the liver, into the spleen, and into the heart. Immediately after the injection, two-photon fluorescence signals in both channels were recorded for at least and repeated at least three times subject to the condition of the mice except for the heart injection. The heart injection was performed only before the euthanasia. The recorded time traces were then analyzed by a MATLAB program using an algorithm similar to that described in Ref. 27. 3.Results and Discussions3.1.In Vitro StudiesRepresentative photon-counting traces of dual-channel detection on dual-labeled cells flowing in vitro are shown in Figs. 2 and 2 . The long-wavelength (“long”) channel corresponds to the emission wavelength range of DiD. The short-wavelength (“short”) channel corresponds to the emission wavelength of GFP. Each peak in the photon-counting traces represents an event in the corresponding channel. Figure 2 is the magnified view of the photon-counting traces in Fig. 2 to illustrate the individual fluorescence peaks. Temporal overlap of peaks in the two channels indicates simultaneous detection of dual-labeled cells in the two wavelength channels. The ability to count thousands of cells per minute has been confirmed. In addition, the ability to resolve cells at the single-cell level is demonstrated. (Single-cell detection is effectively guaranteed, since the two-photon excitation volume at the tip of the fiber nearly matches the volume of a single cell.) For this particular measurement, the cells flowed through a inner diameter plastic tube at a flow rate of . The estimated average flow speed in the tube was . Assuming a cell diameter of and the lateral diameter of the two-photon excitation region at the fiber tip of , we can estimate the detection rate from the cell concentration and the aspect ratio between the size of the tube and the fiber core to be about 0.01. The expected number of detected DiD events per minute is therefore 1000 , which agrees with the measured number of . It is thus reasonable to assume that all of the DiD-labeled cells passing through the excitation region were detected. Fig. 2(a) Representative two-channel detection photon counting traces of dual-labeled GFP-DiD cells flowing in a tube. The blue line represents photons collected in the “long” channel ( , corresponding to DiD emission wavelength), and the green line represents photons collected in the “short” channel ( , GFP). (b) Magnified view of the dual-channel detection raw data. The upper panel shows the peaks detected in the short channel (GFP), and the lower panel shows the peaks detected in the long channel (DiD). (c) Number of cells detected per minute for flowing dual-labeled GFP-DiD cells in PBS and (d) in blood. Control (yellow bars): events detected in the long-wavelength channel for flowing nonlabeled untransfected MCA-207 cells. For the GFP-DiD cell suspension in PBS, the detected number of events in the GFP corresponding channel (green bar) is 49.5% of the total detected events in the DiD channel (blue bar), while 96.2% of the detected GFP cells have corresponding DiD events within a interval (green bar with blue stripes). For the cell suspension in 50% whole blood, the detected number of GFP events are 33.3% of that of the DiD events, while 90.0% of the events in the GFP channel have corresponding DiD events in the long channel. (Color online only.) 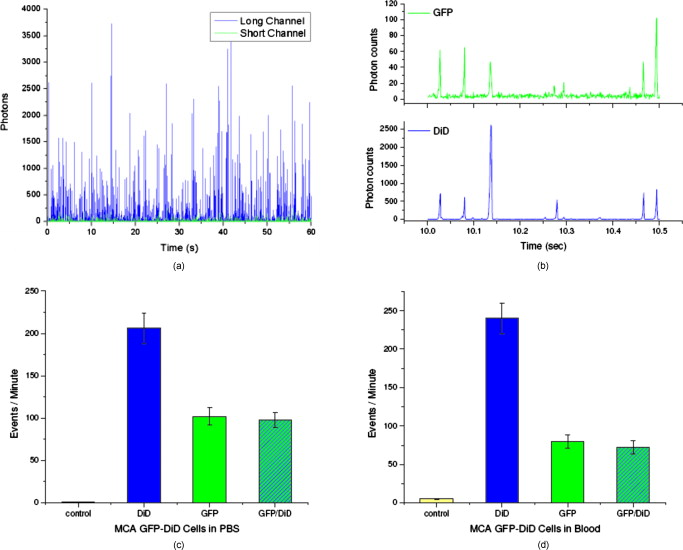 Figure 3 shows the scatter plot of the two-photon fluorescence (TPF) photon counts for correlated events in the short and long channels. We find that the measured peak energy distribution has a wider distribution than the conventional flow cytometry (Fig. 4 ). This is because when the cells flow through the core of the fiber, the distance between the cell and the fiber tip can vary in a large range. However, in conventional flow cytometry, the flow of cells is perfectly controlled, so the variation factor is only the fluorescence signal intensity of the cells, and thus smaller. In our random flow condition, as long as the number of collected photons is higher than the detection threshold when the cell passes though the excitation volume, the cell is “detected” as an event. Therefore, because DiD has relatively higher TPF brightness, the effective probe volume for DiD is larger, which also results in the wider energy distribution and wider peak width. Fig. 3Scatter plot of the peak energy (number of photons in a peak) of correlated events in the short and long channels.  Figures 2 and 2 show the average numbers of events detected when flowing dual-labeled GFP-DiD cells in PBS and in 50% whole blood. The cells flowed in a inner diameter plastic tube for this study. The larger inner diameter tube was used to diminish the chance of blood clogging. The detected numbers of events in the DiD channel in PBS and in blood were about the same and agreed with the expected values calculated by the method described earlier. The signal strengths (photon counts per event) for cell suspensions in PBS and in blood were almost identical, as illustrated in Fig. 5 (long channel) and Fig. 6 (short channel). For DiD events, the numbers of photons per peak (mean fluorescence) were and , respectively, for cell suspensions in PBS and in blood. The higher photon counts in blood might be due to its higher viscosity, which increases the dwell time of cells in the probe volume at the fiber tip. The detected peak fluorescence is not affected by the corpuscular nature of blood, which is in dramatic contrast to the objective-lens-based free-space detection scheme. In free-space measurements, about one order of magnitude reduction in the detected event photon counts was observed when flowing cell suspensions in whole blood versus PBS.27, 28 This is due to the scattering and absorption by the heterogeneous components in whole blood, such as red blood cells. Fig. 5Distribution of the total photon counts in each peak detected in the long channel. (a) Cell suspensions in PBS. (b) Cell suspensions in 50% whole blood.  Fig. 6Distribution of the total photon counts in each peak detected in the short channel. (a) Cell suspensions in PBS. (b) Cell suspensions in 50% whole blood.  Scattering and absorption cause an even larger reduction in signal levels when attempting to detect GFP-expressing cells in blood using free-space optics. Hemoglobin absorbs strongly at the emission wavelength of GFP, which is centered at around (Ref. 29). Moreover, the autofluorescence of human blood also peaks at about , which increases the fluorescence background and makes the detection of GFP-expressing cell in whole blood more difficult.27 Besides, the fluorescence from impurities or nonlinear scattering in the fiber also contribute in this wavelength range. Despite the difficulty of detection in whole blood or in vivo, there is great interest in detecting GFP-expressing cells in the bloodstream due to their importance in biomedical science.16, 29 Using free-space optical detection, a typical detection rate for GFP-expressing cells in blood has been observed to be below 5% (Ref. 27, 28), even when the signal-to-noise ratio in the DiD channel of cell measurements in PBS is similar to that in Fig. 2. The data in Fig. 2 show, however, that use of the TPOFF probe enables a significant increase in event detection efficiency. The combination of two-photon excitation and fiber-optic detection circumvents the scattering and absorption problems of cell detection in whole blood. Because all the excitation and collection happen only in close proximity to the fiber core, the two-photon-excited fluorescence photons can be collected directly before suffering multiple scattering as in free-space detection schemes. If we assume that all cells passing through the excitation volume at the fiber tip are detected in the DiD channel, 50% of the total cells are also detected in the GFP channel for cell suspensions in PBS [Fig. 2]. 96% of the detected GFP events in the short channel have a corresponding DiD event in the long channel within a interval [striped green bar in Fig. 2]. This result matches the conventional flow measurement, as shown in Fig. 4. For the cell suspensions in 50% whole blood [Fig. 2], 33.3% of the GFP-DiD cells are detected in the GFP channel, while 90.0% of the GFP events in the short channel are correlated with DiD events in the long channel. The fact that in all cases more than 90% of GFP events have corresponding DiD events in the long channel supports the assumption that all of the cells passing through the probe volume at the fiber tip are detected in the DiD channel. The average peak photon counts of the detected GFP events are and , respectively, for cell suspensions in PBS and in 50% whole blood. The scattering and absorption in blood has no apparent effect on the detected signal strength, as we have seen in the DiD channel. The reduced number of events detected in the GFP channel compared to the DiD channel for the cell suspensions in PBS can be simply explained by the smaller two-photon-fluorescence brightness of the GFP compared to DiD. (This assumes that all the DiD-labeled cells express GFP. This was confirmed using standard flow cytometry; see Fig. 4.) However, the number of GFP events detected in 50% whole blood is only about two-thirds of that in PBS. This can be explained by the larger background photon counts from blood autofluorescence. The mean photon count of the background for the blood in the short-wavelength channel is 14 photons with a standard deviation of about 4 photons. The detection threshold defining a cell detection event is set to be the background photon count plus three standard deviations, corresponding to 26 photons for blood. On the other hand, the mean photon count of the background for PBS is 2.5 photons, with a standard deviation of 1.6 photons. Therefore, the peak detection threshold for the cell suspension in PBS is 7.3 photons. By investigating the peak maximum distribution of the events, as shown in Fig. 7 , we find that the fraction of total events with a peak maximum lower than 26 photons for cells flowing in PBS is about 30%, which accounts for the reduced detection rate in whole blood. In summary, although the higher background of blood makes the detection of GFP cells in whole blood more difficult, the TPOFF probe enables a detection sensitivity one order of magnitude higher than that with free-space techniques due to the elimination of the scattering and absorption. Fig. 7Peak maximum distribution of GFP events for cells flowing in (a) blood and (b) PBS. The mean photon count for the background of blood was 14 photons, with a standard deviation of about 4 counts. The event detection threshold for the peaks in blood was 26 photons. The mean photon count for the background of PBS was 2.5 photons, with a standard deviation of 1.6 photons. The peak detection threshold for the cell suspension in PBS was 9 photons. 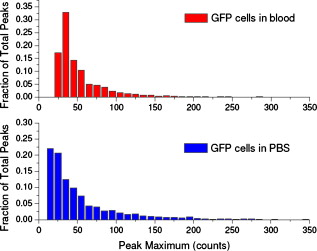 3.2.In Vivo StudiesFollowing the demonstration of enhanced in vitro detection of cells, and particularly GFP-expressing cells, in 50% whole blood, we demonstrate the applicability of the TPOFF probe to measure circulating cells in live mice. Although the future goal is to monitor circulating cells in a large vein, and such experiments may require the use of larger animal models, we can demonstrate the feasibility of in vivo detection by inserting the TPOFF probe into appropriate organs. The fiber probe was inserted in the left lobe of the liver using the method described in Sec. 2.4. Before the injection of labeled cells, the background signals in both the short and long channels were recorded as the control. The control traces are shown in Fig. 8 . The background trace in the long-wavelength channel was flat; no photon counts higher than 20 were recorded during an acquisition time of about . The mean photon count was 2.7 with a standard deviation of 2 photons. However, in the short-wavelength channel, we noticed periodic spiking with a period of about . The periodicity was the same as the respiration rate of the mice and was believed to be due to the breathing movement. The fluctuations in the short channel make the identification of GFP cells in vivo more difficult. Many kinds of intrinsic fluorophores in the blood or tissue have high autofluorescence that overlaps the emission wavelength of GFP. Fortunately, because of the capability of conducting dual-channel detection under two-photon excitation, we can use the long channel as a reference to confirm the arrival of a cell in the probe volume and then look for a coincident signal in the short channel. Using the long channel signal as a reference to indicate the existence of a cell in the probe volume makes it possible for us to perform quantitative cytometry in vivo, even in the presence of a high background in the short channel.14 Fig. 8(a) Control traces of dual-channel two-photon in vivo fiber-optic flow cytometry when inserting the fiber probe into the liver of a mouse without injecting labeled cells. Each time point represents the total number of photons detected in . (b) Representative photon counting traces after injecting DiD-stained untransfected MCA-207 cells into the mouse. (c) Detected event time course in the long channel after injecting DiD-labeled MCA-207 cells into the tail vein. (d) The number of detected events in the long channel (red bars, DiD) and in both channels (green bars, GFP-DiD) per minute in the in vivo measurements. The fiber probe was put on the left lobe of the liver, and the dual-labeled cells were injected through different places: tail vein, right lobe of the liver, spleen, and heart. (Color online only.)  To demonstrate the ability of using the TPOFF probe to conduct cytometry in vivo, of DiD-labeled MCA-207 normal cells with a concentration of were injected into the tail vein or spleen of the mouse. A representative time trace is shown in Fig. 8. The cells injected through the tail vein entered the circulation system immediately. However, because the externally injected cancer cells were not intrinsic to the mouse, they were quickly depleted from the circulation, consistent with previous in vivo observations.30 Figure 8 is the observed depletion time course for tail vein–injected cells. The depletion dynamics occur on a similar time scale to the depletion of similar cells, as has been reported in the literature. 14, 31 3.3.Monitoring GFP-Expressing Cells In VivoDual-labeled GFP-DiD cells were injected into the mice through multiple locations. The energy distribution of the correlated events is shown in Fig. 9 . The energy distribution scatter plot is similar to what we have seen in the in vitro measurements. The average numbers of detected events per minute in the two channels are illustrated in Fig. 8. The red bars represent the number of cells detected in the long channel, and the green bars are the number of coincident events detected in both channels. Because of the sizes of the organs, the injected volumes of the cell suspensions were different: we injected into the tail vein, into the right lobe of the liver, into the spleen, and into the heart. The values plotted in the figure are the numbers normalized to an injection volume of . The number of events detected for cells injected into the tail vein and heart are similar, as they both enter the circulation directly. The number of events detected for cells injected into the spleen is the fewest since the cells need to be absorbed into the circulation before they can reach the liver, and they may do so with low efficiency. The in vivo experiments show that the overall detection efficiency for identifiable events that occur simultaneously in both channels is . This value is consistent with the in vitro measurements in whole blood and confirms the applicability of the TPOFF probe for the efficient detection of GFP-expressing cells circulating in vivo. 3.4.Limitation of In Vivo Long-Term MeasurementsThe fiber-optic probe provides a minimally invasive way for conducting in vivo measurements deep inside the native environment of the body. Our two-photon fluorescence probe configuration is based on one single-mode fiber (SMF). The fiber probe is thus tiny and virtually weightless. We can insert the fiber into large blood vessel through the help of a syringe needle. We have demonstrated the technique by inserting the fiber through a needle and placing the fiber probe into experimental tumors or organs. Because of its light weight, the fiber-needle complex can be easily fixed on the animal, as in the intravenous injection. Therefore, this technique is very suitable for long-term in vivo measurements. However, the movement of the animals needs to be limited appropriately to avoid dragging or damaging of the fiber probe due to acute animal actions. Nevertheless, anesthesia, which limits the maximum runtime in animal experiments, is not needed throughout the course of the experiment. Therefore, it is feasible to perform long-term monitoring over an extended period using the proposed methodology. 4.ConclusionsIn summary, a fiber-optic-based two-photon excitation flow cytometry system has been developed. A double-clad optical fiber is used as a probe inserted into a flow channel or an organ to achieve an intrinsic signal collection efficiency comparable to a long working distance objective lens in free space. The use of a single inserted fiber to excite and detect multiphoton fluorescence, however, circumvents scattering and absorption problems and leads to a significantly enhanced event detection efficiency in blood relative to free-space optics. The corpuscular nature of whole blood has negligible effect on the detected signal strength. A high detection efficiency of GFP-expressing cells in 50% whole blood and in vivo is demonstrated, despite the strong spectral overlap of the GFP emission with blood absorption and autofluorescence. The ability to conduct multichannel detection with multiphoton excitation makes it possible to efficiently detect GFP-expressing cells in vivo despite the presence of a noisy autofluorescence background in the corresponding wavelength channel. The ability to efficiently detect GFP-expressing cells in vivo may advance the understanding of caner metastasis in preclinical animal models. The capability to access large blood vessels may make this technique a practical solution for long-term, real-time monitoring of rare circulating cells in disease diagnosis. For future clinic applications, with the developments of human CTC-specific fluorescently tagged markers such as the Herceptin antibody for the detection of HER2-expressing breast tumor cells,32 or folic acid (FA)–conjugated fluorescent nanoparticles5, 25 for the detection of FA receptor-expressing CTC such as that originating from an ovarian tumor, and further engineering of the probe to increase the detection efficiency, this might be possible when these CTC-specific agents are administered appropriately into the body. AcknowledgmentsThe authors would like to express thanks for the support of federal funds from the National Cancer Institute, National Institutes of Health, under Awards Nos. 1 R33 CA112141 and 1 R21 RR021893. ReferencesK. Pantel, R. H. Brakenhoff, and B. Brandt,
“Detection, clinical relevance, and specific biological properties of disseminating tumour cells,”
Nat. Rev. Cancer, 8
(5), 329
–340
(2008). https://doi.org/10.1038/nrc2375 1474-175X Google Scholar
R. Weissleder and M. J. Pittet,
“Imaging in the era of molecular oncology,”
Nature (London), 452
(7187), 580
–589
(2008). https://doi.org/10.1038/nature06917 0028-0836 Google Scholar
M. Cristofanilli, G. T. Budd, M. J. Ellis, A. Stopeck, J. Matera, M. C. Miller, J. M. Reuben, G. V. Doyle, W. J. Allard, L. W. Terstappen, and D. F. Hayes,
“Circulating tumor cells, disease progression, and survival in metastatic breast cancer,”
N. Engl. J. Med., 351
(8), 781
–791
(2004). https://doi.org/10.1056/NEJMoa040766 0028-4793 Google Scholar
M. Ignatiadis, N. Xenidis, M. Perraki, S. Apostolaki, E. Politaki, M. Kafousi, E. N. Stathopoulos, A. Stathopoulou, E. Lianidou, G. Chlouverakis, C. Sotiriou, V. Georgoulias, and D. Mavroudis,
“Different prognostic value of cytokeratin-19 mRNA-positive circulating tumor cells according to estrogen receptor and HER2 status in early-stage breast cancer,”
J. Clin. Oncol., 25
(33), 5194
–5202
(2007). https://doi.org/10.1200/JCO.2007.11.7762 0732-183X Google Scholar
W. He, H. F. Wang, L. C. Hartmann, J. X. Cheng, and P. S. Low,
“In vivo quantitation of rare circulating tumor cells by multiphoton intravital flow cytometry,”
Proc. Natl. Acad. Sci. U.S.A., 104
(28), 11760
–11765
(2007). https://doi.org/10.1073/pnas.0703875104 0027-8424 Google Scholar
E. R. Tkaczyk, C. F. Zhong, J. Y. Ye, A. Myc, T. Thomas, Z. Cao, R. Duran-Struuck, K. E. Luker, G. D. Luker, T. B. Norris, and J. R. Baker,
“In vivo monitoring of multiple circulating cell populations using two-photon flow cytometry,”
Opt. Commun., 281
(4), 888
–894
(2008). https://doi.org/10.1016/j.optcom.2007.10.106 0030-4018 Google Scholar
P. Paterlini-Brechot and N. L. Benali,
“Circulating tumor cells (CTC) detection: clinical impact and future directions,”
Cancer Lett., 253
(2), 180
–204
(2007). https://doi.org/10.1016/j.canlet.2006.12.014 0304-3835 Google Scholar
S. Sleijfer, J. W. Gratama, A. M. Sieuwerts, J. Kraan, J. W. Martens, and J. A. Foekens,
“Circulating tumour cell detection on its way to routine diagnostic implementation?,”
Eur. J. Cancer, 43
(18), 2645
–2650
(2007). 0959-8049 Google Scholar
T. G. Ntouroupi, S. Q. Ashraf, S. B. McGregor, B. W. Turney, A. Seppo, Y. Kim, X. Wang, M. W. Kilpatrick, P. Tsipouras, T. Tafas, and W. F. Bodmer,
“Detection of circulating tumour cells in peripheral blood with an automated scanning fluorescence microscope,”
Br. J. Cancer, 99
(5), 789
–795
(2008). https://doi.org/10.1038/sj.bjc.6604545 0007-0920 Google Scholar
S. Riethdorf, H. Fritsche, V. Muller, T. Rau, C. Schindibeck, B. Rack, W. Janni, C. Coith, K. Beck, F. Janicke, S. Jackson, T. Gornet, M. Cristofanilli, and K. Pantel,
“Detection of circulating tumor cells in peripheral blood of patients with metastatic breast cancer: a validation study of the CellSearch system,”
Clin. Cancer Res., 13
(3), 920
–928
(2007). https://doi.org/10.1158/1078-0432.CCR-06-1695 1078-0432 Google Scholar
J. Sastre, M. L. Maestro, J. Puente, S. Veganzones, R. Alfonso, S. Rafael, J. A. Garcia-Saenz, M. Vidaurreta, M. Martin, M. Arroyo, M. T. Sanz-Casla, and E. Diaz-Rubio,
“Circulating tumor cells in colorectal cancer: correlation with clinical and pathological variables,”
Ann. Oncol., 19
(5), 935
–938
(2008). https://doi.org/10.1093/annonc/mdm583 0923-7534 Google Scholar
S. Nagrath, L. V. Sequist, S. Maheswaran, D. W. Bell, D. Irimia, L. Ulkus, M. R. Smith, E. L. Kwak, S. Digumarthy, A. Muzikansky, P. Ryan, U. J. Balis, R. G. Tompkins, D. A. Haber, and M. Toner,
“Isolation of rare circulating tumor cells in cancer patients by microchip technology,”
Nature (London), 450
(7173), 1235
–1239
(2007). https://doi.org/10.1038/nature06385 0028-0836 Google Scholar
J. A. Garcia, J. E. Rosenberg, V. Weinberg, J. Scott, M. Frohlich, J. W. Park, and E. J. Small,
“Evaluation and significance of circulating epithelial cells in patients with hormone-refractory prostate cancer,”
BJU Int., 99
(3), 519
–524
(2007). https://doi.org/10.1111/j.1464-410X.2007.06659.x 1464-4096 Google Scholar
C. F. Zhong, E. R. Tkaczyk, T. Thomas, J. Y. Ye, A. Myc, A. U. Bielinska, Z. Cao, I. Majoros, B. Keszler, J. R. Baker, and T. B. Norris,
“Quantitative two-photon flow cytometry—in vitro and in vivo,”
J. Biomed. Opt., 13
(3), 034008
(2008). https://doi.org/10.1117/1.2931077 1083-3668 Google Scholar
J. Novak, I. Georgakoudi, X. Wei, A. Prossin, and C. P. Lin,
“In vivo flow cytometer for real-time detection and quantification of circulating cells,”
Opt. Lett., 29
(1), 77
–79
(2004). https://doi.org/10.1364/OL.29.000077 0146-9592 Google Scholar
S. Boutrus, C. Greiner, D. Hwu, M. Chan, C. Kuperwasser, C. P. Lin, and I. Georgakoudi,
“Portable two-color in vivo flow cytometer for real-time detection of fluorescently labeled circulating cells,”
J. Biomed. Opt., 12
(2), 020507
(2007). https://doi.org/10.1117/1.2722733 1083-3668 Google Scholar
E. I. Galanzha, E. V. Shashkov, V. V. Tuchin, and V. P. Zharov,
“In vivo multispectral, multiparameter, photoacoustic lymph flow cytometry with natural cell focusing, label-free detection and multicolor nanoparticle probes,”
Cytometry, 73
(10), 884
–894
(2008). https://doi.org/10.1002/cyto.a.20587 0196-4763 Google Scholar
V. P. Zharov, E. I. Galanzha, and V. V. Tuchin,
“Photothermal image flow cytometry in vivo,”
Opt. Lett., 30
(6), 628
–630
(2005). https://doi.org/10.1364/OL.30.000628 0146-9592 Google Scholar
V. P. Zharov, E. I. Galanzha, and V. V. Tuchin,
“Photothermal flow cytometry in vitro for detection and imaging of individual moving cells,”
Cytometry, 71
(4), 191
–206
(2007). https://doi.org/10.1002/cyto.a.20384 0196-4763 Google Scholar
C. Alt, I. Veilleux, H. Lee, C. M. Pitsillides, D. Cote, and C. P. Lin,
“Retinal flow cytometer,”
Opt. Lett., 32
(23), 3450
–3452
(2007). https://doi.org/10.1364/OL.32.003450 0146-9592 Google Scholar
J. Y. Ye, M. T. Myaing, T. B. Norris, T. Thomas, and J. Baker,
“Biosensing based on two-photon fluorescence measurements through optical fibers,”
Opt. Lett., 27
(16), 1412
–1414
(2002). https://doi.org/10.1364/OL.27.001412 0146-9592 Google Scholar
T. P. Thomas, M. T. Myaing, J. Y. Ye, K. Candido, A. Kotlyar, J. Beals, P. Cao, B. Keszler, A. K. Patri, T. B. Norris, and J. R. Baker Jr.,
“Detection and analysis of tumor fluorescence using a two-photon optical fiber probe,”
Biophys. J., 86
(6), 3959
–3965
(2004). https://doi.org/10.1529/biophysj.103.034462 0006-3495 Google Scholar
M. T. Myaing, J. Y. Ye, T. B. Norris, T. Thomas, J. R. Baker, W. J. Wadsworth, G. Bouwmans, J. C. Knight, and P. S. J. Russell,
“Enhanced two-photon biosensing with double-clad photonic crystal fibers,”
Opt. Lett., 28
(14), 1224
–1226
(2003). https://doi.org/10.1364/OL.28.001224 0146-9592 Google Scholar
Y. C. Chang, J. Y. Ye, T. Thomas, Y. Chen, J. R. Baker, and T. B. Norris,
“Two-photon fluorescence correlation spectroscopy through a dual-clad optical fiber,”
Opt. Express, 16
(17), 12640
–12649
(2008). 1094-4087 Google Scholar
T. P. Thomas, J. Y. Ye, Y. C. Chang, A. Kotlyar, Z. Cao, I. J. Majoros, T. B. Norris, and J. R. Baker,
“Investigation of tumor cell targeting of a dendrimer nanoparticle using a double-clad optical fiber probe,”
J. Biomed. Opt., 13
(1), 014024
(2008). https://doi.org/10.1117/1.2870105 1083-3668 Google Scholar
A. C. Guyton and J. E. Hall, Textbook of Medical Physiology, Saunders, Singapore
(2005). Google Scholar
E. R. Tkaczyk, A. H. Tkaczyk, S. Katnik, J. Y. Ye, K. E. Luker, G. D. Luker, A. Myc, J. R. Baker Jr., T. B. Norris,
“Extended cavity laser enhanced two-photon flow cytometry,”
J. Biomed. Opt., 13
(4), 041319
(2008). https://doi.org/10.1117/1.2967983 1083-3668 Google Scholar
C. F. Zhong,
“Quantitative two-photon flow cytometry—in vitro and in vivo,”
Univ. of Michigan,
(2006). Google Scholar
R. Weissleder and V. Ntziachristos,
“Shedding light onto live molecular targets,”
Nat. Med. (N.Y.), 9
(1), 123
–128
(2003). 1078-8956 Google Scholar
E. R. Tkaczyk, C. F. Zhong, J. Y. Ye, S. Katnik, A. Myc, T. Thomas, K. E. Luker, G. D. Luker, J. R. Baker, and T. B. Norris,
“Two-photon, two-color in vivo flow cytometry to noninvasively monitor multiple circulating cell lines,”
Conf. Novel Optical Instrumentation for Biomedical Applications III, 66310T SPIE, Piscataway, NJ
(2007). Google Scholar
I. Georgakoudi, N. Solban, J. Novak, W. L. Rice, X. Wei, T. Hasan, and C. P. Lin,
“In vivo flow cytometry: a new method for enumerating circulating cancer cells,”
Cancer Res., 64
(15), 5044
–5047
(2004). https://doi.org/10.1158/0008-5472.CAN-04-1058 0008-5472 Google Scholar
R. Shukla, T. P. Thomas, A. M. Desai, A. Kotlyar, S. J. Park, and J. R. Baker,
“HER2 specific delivery of methotrexate by dendrimer conjugated anti-HER2 mAb,”
Nanotechnology, 19
(29), 295102
(2008). https://doi.org/10.1088/0957-4484/19/29/295102 0957-4484 Google Scholar
|