

|
|
1.IntroductionCardiovascular disease is the number one cause of death with an estimated 17.5 million deaths worldwide each year, accounting for some 30% of all deaths.1 Myocardial infarction (commonly referred to as heart attack) is the leading cause of cardiovascular disease-related death with an estimated 7.5 million deaths each year, accounting for some 12% of all deaths.1 Most often a myocardial infarction is caused by an occlusion (blockage) of a coronary artery as a consequence of atherosclerotic plaque. The resulting ischemia causes necrosis of the affected myocardial cells and formation of fibrotic scar tissue. The infarction leads to remodeling of the myocardium, specifically expansion of the infarct, ventricular dilation, thinning of the ventricular wall, and scar formation, which in turn cause disruption of normal cardiac function. The potential for stem cells to form any differentiated cell type in the body has led to investigation of use for a variety of degenerative diseases.2, 3 The use of stem cells for myocardial regenerative therapy in particular has been actively pursued, as it has been shown in some clinical trials to improve cardiac function.4, 5 A wide variety of donor stem cell types have been investigated for use in the myocardium, including skeletal myoblasts, mesenchymal stem cells, bone marrow stem cells, and adult cardiac stem cells.6 While debate continues as to the primary mechanisms for the improvement in function, it is generally attributed to the reduction in deleterious remodeling.7 This remodeling involves changes in the myocardial content and structure, particularly necrosis of cardiomyocytes and an increase in collagen associated with scar formation.8 As stem cell therapy alters this remodeling, a decrease in the collagen content and an increase in cardiac muscle has been measured in regenerating infarcted myocardium.9 The structural organization of the myocardium also changes significantly with infarction and stem-cell-derived regeneration. Healthy heart tissue is comprised primarily of well-organized aligned arrays of cardiomyocytes, while the collagen in the infarcted scar tissue is largely disorganized. The anisotropic nature of fibrous tissues, such as healthy myocardium, results in a directionally varying optical refractive index (different refractive indices along the length of the fibers versus perpendicular to the fibers) referred to as linear birefringence. The infarcted scar tissue, on the other hand, is largely isotropic with its chaotic orientation of collagen stands, and accordingly should exhibit lower values of linear birefringence compared to healthy tissue. Polarimetry may thus be a useful approach to quantify these microstructural tissue anisotropies, and in particular to monitor changes in their values following regenerative (stem-cell-based) therapies, thus providing potential functional feedback on their effectiveness. We have recently reported polarimetric initial measurements on rat myocardial tissues with induced infarction and regenerative treatment.10, 11 Here, we expand on this initial study by performing polarization imaging in addition to point measurements; we also use nonlinear optical microscopy to provide additional insight into the causes of the observed polarization signals and the meaning of the observed trends. Birefringence is a measure of structural anisotropy, and causes light polarized along the different refractive indices in the medium to propagate at different speeds, resulting in a change in relative phase, referred to as the retardance . The retardance is related to the underlying birefringence by , where is the birefringence (difference in refractive indices), is the wavelength of the light, and is the distance the light has propagated through the medium (optical path length). This change in phase leads to a net change in the overall polarization of the light, specifically a transfer between linear and circular polarization states, which can be measured as part of the overall polarization properties of the sample and used to calculate the retardance. To calculate the intrinsic birefringence of the sample, one must know the distance the light has propagated, a value often not known a priori, particularly in highly scattering media such as tissue; however, the retardance can be used as a measure of tissue anisotropy if the propagation distance is constant between measurements, as any difference in retardance will be due to birefringence only. Differences in optical properties of healthly versus infarcted myocardial can alter the optical path length; however, large magnitude changes in birefringence will still dominate the measured retardance. Multiple elastic scattering of light in tissue rapidly depolarizes a polarized input beam. However, sufficient polarization is maintained in diffuse transmission through thin tissue layers , or in diffuse reflection geometries from tissues of any thickness, to enable quantitative polarimetery.10, 11, 12, 13 We thus hypothesize that polarized light birefringence measurements can be used to characterize the structural anisotropy of heart tissue and differentiate between healthy, infarcted, and regenerating myocardium, with further potential for monitoring regenerative treatments. This study is part of our initial investigations10, 11 employing fixed and sectioned myocardial tissue, moving toward potentially applying this approach on bulk (unsectioned) samples, and ultimately in vivo. The ability to monitor the structural anisotropy of the myocardium would be useful through fiber optic devices in assessing longitudinally the structural remodeling that occurs with infarction and regenerative treatments, particularly with regards to a specific treatment’s ability to alter these remodeling processes. Previous studies involving polarized light microscopy14 and polarization-sensitive optical coherence tomography (PS-OCT)15, 16 have investigated the utility of polarized light to characterize the myocardium and its response to infarction. In these studies, a reduction of birefringence was measured in the infarction. The PS-OCT studies are of particular interest with regards to potential application in vivo, as they offer depth resolution (though limited to less than in depth) and can be catheterized. However, no studies to date have used polarized light to characterize myocardial response to regenerative therapies. A variety of optical methods are being proposed and investigated for monitoring various aspects of stem cell cardiac therapy.17 These include bioluminescence imaging for cell tracking,18 near-infrared spectroscopy for monitoring perfusion,19 and laminar optical tomography for monitoring electrophysiology,20 among others.17 Currently, however, no optical method exists—apart from polarized-light-based techniques—for assessing the structure of myocardium, particularly with regards to the structural remodeling that occurs with infarction and regeneration, with the potential to be employed in vivo on bulk tissues. Other nonoptical modalities such as ultrasound elastography21 and electrical impedance mapping22 do provide information on the structural state of the myocardium. However, neither of these techniques provides information on the organizational structure of the tissue, but rather on the elastic and conductive properties, respectively. Diffusion tensor magnetic resonance imaging provides information regarding fiber organization and orientation,23 but currently is limited to ex vivo tissues and suffers from lower spatial resolution than optical methods. Thus, polarized-light-based birefringence measurements, if successful, may enable previously unavailable assessment of myocardial organization. In this work, we expand on previous findings involving the use of polarization measurements in myocardial characterization;10, 11 in particular, we investigate polarization retardance imaging in addition to point measurements, and employ statistical significance testing. The outline of this work is as follows. An overview of the point measurement and imaging polarimetry systems used in this study is given, along with the polar decomposition methods for analyzing the measured polarimetry data. Nonlinear microscopy was used to complement the polarimetry results and to understand the causes of the measured birefringence signals, and is described next. Specifics of the animal model used for myocardial infarction and stem cell regeneration are reviewed. Finally, the birefringence point measurements and imaging results, and the nonlinear microcopy findings, are then presented, interpreted, and discussed. The work concludes with a summary of the findings and an outline of future research directions. 2.Methods and Materials2.1.Polarimetry SystemsPoint and imaging polarimetry systems were employed in this study. The former provides a high signal-to-noise ratio (SNR) polarimetric signal, while the imaging system, although having a lower SNR, allows spatial mapping of polarization values. Both systems measure the polarization of the light that has interacted with a sample, yielding results in the form of a Stokes vector, a description of the polarization state of the light. In addition, the polarization properties of the sample, described by its polarization transfer function in the form of a Mueller matrix, can also be measured by varying the input polarizations and measuring the respective outputs.24 Specifically, a Stokes vector is a four-element vector describing the polarization of a beam of light. Its element represents the overall intensity of the beam, gives the intensity of linear polarization along horizontal and vertical axes (with respect to an arbitrary reference frame), gives the intensity of linear polarization at , and gives the intensity of light that is circularly polarized. Analogously, a Mueller matrix is a matrix describing the effects a particular optical element has on the polarization of the input light. The two descriptors are linked in the so-called Mueller calculus: given a beam with a Stokes vector impinging on an optical element with a Mueller matrix , the light output from that element will have its polarization described by a Stokes vector as . A schematic of the point measurement system is shown in Fig. 1 . The beam from a HeNe laser at passes through a mechanical chopper operating at for intensity modulation, then through a linear polarizer and quarter wave plate to control the polarization of the light incident on the sample by adjustment of their orientations. After interacting with the sample, light in the forward ( solid angle) direction is collected with a lens and passes through a removable quarter waveplate oriented at . The collected beam then passes through a photoelastic modulator (PEM, IS-90, Hinds Instruments, Hillsboro, Oregon), a linearly birefringent resonant device operating at . The optical axis of the PEM is oriented at and its magnitude of retardation is modulated according to the sinusoidal function , where , and is the user-specified amplitude of maximum retardation. When the removable quarter wave plate is in place, the Stokes vector parameters and (linear polarization) are modulated; when removed, the Stokes vector parameter (circular polarization) is modulated. Finally, the beam passes through a linear analyzer oriented at , converting the polarization-modulated light into intensity modulated light at (and its harmonic at ), and is detected with an avalanche photodiode (APD C5460, Hamamatsu, Hamamatsu City, Japan). The resulting photocurrent is then sent to a lock-in amplifier for high SNR synchronous detection, with the reference signal toggled between , , and . Fig. 1Schematic of point measurement polarimetry system. C, mechanical chopper; , , polarizers; , , quarter wave plates ( is removable); A, aperture; , , lenses; PEM, photoelastic modulator; D, avalanche photodiode; and , , modulation frequencies of mechanical chopper and PEM, respectively.  The specifics of the signal analysis can be found in previous publications.25, 26 Briefly, the normalized Stokes parameters ( , , and ) of the light that is collected from the sample are calculated from the synchronously detected lock-in amplifier signals at the first harmonic of the chopper frequency , and the first and second harmonics of the signal at the PEM frequency and (50 and , respectively). When the detection quarter wave plate is in place, the normalized Stokes parameters and are calculated from andwhere and are the first- and second-order Bessel functions evaluated at the user-selected PEM amplitude of maximum retardation. When the detection quarter wave plate is removed, the normalized Stokes parameter can then be calculated asBy cycling through four different input polarization states, specifically linear polarizations at 0, 45, and , and circularly polarized light (either right or left) denoted as , , , and , respectively, and measuring the corresponding output polarization states, the Mueller matrix of the sample can be calculated. Specifically, the measured outputs states for the four subscripted input states are combined to calculate the 16 elements of the sample Mueller matrix as where the indices and denote the rows and columns, respectively. From this experimentally determined Mueller matrix, the sample polarizing properties, including birefringence, can be calculated, as shown in the later section on Mueller matrix decomposition.A polarimetry imaging system was also developed for spatial mapping of polarization parameters, as shown in Fig. 2 . The input beam from a diode laser at (Thorlabs, Newton, New Jersey) first passes through a linear polarizer, removable quarter wave plate, and an aperture to control the beam polarization and width (approximately diam) before being incident on the sample. A diode laser was employed rather than the HeNe used for point measurements, as additional power was required for a wide beam. After interacting with the sample, the light passes through a pair of lenses to collect and focus the beam, as well as a removable quarter wave plate and a linear analyzer to allow for intensity detection of the output linear polarizations by a charge-coupled camera (CCD) camera (CoolSNAP K4, Photometrics, Tucson, Arizona) with , pixel size, and field of view approximately . The input beam was angled slightly off axis to avoid any directly transmitted light saturating the CCD. This imaging system does not employ synchronous lock-in detection, so the SNR of this system is reduced compared to the point measurements. Work is currently underway to incorporate synchronous measurements. Fig. 2Schematic of imaging polarimetry system. , , polarizers; , , removable quarter waveplates; , , apertures; and , , lenses.  By using this imaging system, full Stokes parameters can be measured. By rotating the analyzing polarizer and inserting the quarter wave plate, the Stokes parameters and can be measured from the detected intensities as, andwhere the subscripts indicate the orientation of the analyzer, and QW in the subscript indicates that the detection quarter wave plate is in place. The measured Stokes parameters for each appropriate input state can then be used to construct the Mueller matrix, although the necessary Mueller matrix elements to determine retardance can be obtained from the top left matrix.272.2.Mueller Matrix DecompositionThe Mueller matrix measured with either system describes the combined effects of all the polarizing properties of the sample. In the case of biological tissues, these effects are depolarization (due to scattering), optical activity, and birefringence. These effects occur simultaneously in tissue, making their unique quantification nontrivial, particularly as tissue is a turbid depolarizing medium. To quantify each of the effects separately (in this case, we are specifically interested in linear birefringence), it is possible to decompose the measured matrix into the product of three basis constituent matrices,28, 29 where the effects of depolarization are accounted for in the depolarizing matrix , the effects of linear birefringence and optical activity (circular birefringence) are described by the retarder matrix , and the effects of linear and circular dichrosim are described in the diattenuator matrix . can be decomposed through a series of algebraic operations into these three basis matrices, using the method first described for clear media by Lu and Chipman.28 We have adapted this approach for optically turbid media with simultaneously occurring polarization effects.29 While the multiplication order in Eq. 7 appears ambiguous (matrices in general do not commute under multiplication, so that ), it has been shown that this product or its reverse order always leads to a physically realizable Mueller matrix.28, 30, 31 The validity and accuracy of this approach in turbid media has been previously demonstrated with both simulated and experimental data.26 In addition, the use of the top left submatrix in the decomposition process for determining sample birefringence properties has also been previously demonstrated.27The measurable effect of birefringence, linear retardance , is contained in and can be calculated from its elements as28 where are the elements of . The decomposed values for linear retardance were recorded for the myocardial samples in this study for both point and imaging measurements. If the optical path length is known, the measured retardance can be used to calculate the sample birefringence, as is possible with PS-OCT measurements. However, in our case is not known due to scattering. Although we have used a polarization-sensitive Monte Carlo model to estimate the effective path lengths in various geometries and with different sample optical properties,32, 33 we chose here to report the retardance values in this study and did not attempt to deduce the underlying birefringence, as optical scattering and absorption properties of the myocardial tissue are not known. To compare retardance measurements, the propagation distance was held constant by performing measurements through samples sectioned to uniform thicknesses.2.3.Multiphoton MicroscopyTo determine the underlying microstructural, morphological, and compositional causes for the observed polarization signals, multiphoton microscopy was performed on the cardiac samples. Second harmonic generation (SHG) was used to image the extracellular collagen matrix, while two-photon excited fluorescence (TPEF) was used to image cardiomyocytes. This label-free microscopic and nondestructive approach yields inherently coregistered images of the collagen and the cardiomyocyte compartments, thus giving useful information on cardiac tissue microstructure and composition, including the infarction and regeneration processes. Images were acquired with a confocal microscope (Zeiss, LSM 510 META NLO, Oberkochen, Germany) using a dry objective. The excitation wavelength was set to using a tunable Ti:sapphire laser (Chameleon, Coherent Incorporated, Santa Clara, California). The SHG signal is emitted at half the excitation wavelength, , while the TPEF signal is emitted at longer wavelengths above about . Two wavelength filters were used to spectrally separate the signals: for SHG, and for TPEF. While fluorescence is also emitted at wavelengths greater than 463, this narrow wavelength range was chosen so that the TPEF signal would have approximately the same intensity as the SHG signal. Both SHG and TPEF signals were recorded in the back-scattered direction with a spectral detector. In all figures, the SHG signal is shown in green pseudocolor and the TPEF signal is shown in red pseudocolor. The imaging resolution was per pixel with a field of view of . The images were taken at a depth of approximately from the surface of the sample, with the depth of focus being . 2.4.Myocardial TissuesTo investigate the utility of birefringence measurements for monitoring regenerative treatments, samples from a rat model of myocardial infarction and regeneration were used. All animal studies were carried out under institutional approval (University Health Network, Toronto, Canada). Myocardial infarctions were induced in adult Lewis rats by coronary artery ligation. One group of animals was used as a control , while mesenchymal stem cells were administered to a treatment group by intramyocardial injection into the site of infarction, two weeks postligation. Both control and treatment groups were sacrificed four weeks postinfarction ( post-stem-cell injection for the treatment group), at which time the hearts were removed, fixed in 10% formalin, and sectioned by a vibratome to -thick axial sections, as shown in Fig. 3 . This sectioning was done to reduce the effects of excessive depolarization by multiple scattering in thick tissues. These sections were also used for multiphoton microscopy. We chose transmission geometry for this initial study for ease of measurement and interpretation; polarization measurements in thick tissues (in reflection geometry) are being initiated. It should also be noted that the tissue fixation process may alter the birefringence properties of tissue through protein cross-linking, so that the absolute values derived in this study can have a systematic offset. However, this should not affect the observed relative changes in birefringence and trends therein. The effects of formalin fixation on tissue birefringence are currently being investigated. To perform the measurements, the sections were mounted on a glass microscope slide and placed horizontally in the beam path. To ensure that the tissues did not dry out, the measurements were performed quickly (less than ). All measurements were performed at room temperature . As the field of view for the multiphoton microscopy images is small relative to the size of the samples, whole slice histology was also conducted. One sample from each group was embedded in paraffin, stained with Masson’s trichrome, and sectioned to for histological examination. This enabled whole slice comparison between polarization and histology with regards to myocardial composition. 3.Results and Discussion3.1.Point Retardance MeasurementsResults from point retardance measurement on the control and treated tissues are shown in Fig. 4 . For each sample, measurements were performed in the healthy (region distal to the induced infarct), marginal (region adjacent to the induced infarct), and infarcted scar region. Cardiology experts identified these regions based on ventricular wall thinning; the infarction can also be clearly identified by the histology images in Fig. 5 based on collagen content. In each of these regions, five measurements were made at different positions. The results are the mean of all measurements in that region for all samples within each group. Fig. 4Results of point measurements; error bars are ± one standard deviation. Results are for control and stem-cell-treated animals. denotes statistical significance with respect to the corresponding control. Note the increase in retardance (birefringence) with stem cell treatment.  Fig. 5Representative retardance images for (a) control and (b) stem-cell-treated sections with corresponding Masson’s trichrome stained histology images (collagen in blue, muscle in red). Retardance values are given in radians. (Color online only.)  As expected, the myocardium exhibits significant birefringence, particularly in the healthy regions where retardance values of up to were measured. If one assumes the light propagation distance to be at least the tissue thickness , this corresponds to a birefringence value of , which is comparable to other organized tissues.34 A large reduction in retardance was measured in the infarcted regions compared to the healthy tissue values, indicating a loss of tissue anisotropy and organization most likely due to the loss of cardiomyocyte fibers and their replacement with collagen-rich scar tissue. The normal myocardial tissue is comprised of highly organized cardiomyocytes surrounded with a fibrotic extracellular matrix, which results in a highly anisotropic structure; conversely, the infarction is primarily disorganized scar tissue comprised of randomly oriented, and thus optically isotropic, collagen fibers. The marginal regions represent a mixture of organized myocytes and disorganized collagen scar compartments, resulting in reduced retardance, although not as low as the scar tissue. These tentative interpretations are tested and confirmed by histology in Fig. 5 and the findings of nonlinear microscopy, as discussed in Sec. 3.3. The tissue response to regenerative treatment is seen as a statistically significant rise ( , calculated using a two-tailed Student’s t-test) in the measured retardance in the infarcted regions, as well as an apparent rise (although not statistically significant) in the marginal region. The addition of stem cells to the infarcted regions results in remodeling of the scar tissue, specifically a reduction in collagen and regrowth of myocytes leading to an improvement in cardiac function. This remodeling results in increased tissue anisoptropy and organization, manifesting as an increase in the retardance but without complete recovery to the normal tissue value. This is consistent with typical myocardial regenerative treatments, as full functional recovery is generally not achieved.6 These results are consistent with our previous point measurements where a reduction in birefringence was measured with infarction, and an increase was also measured with regenerative treatment.10 3.2.Retardance ImagingPoint polarimetry measurements, sampling approximately volumes of tissues,32, 33 likely suffer from sampling bias in the heterogeneous, spatially varying tissues. To better understand how the birefringence values vary spatially in myocardial samples, 2-D retardance images were taken of all samples from the control and treatment groups. A retardance image from each group is shown in Fig. 5, together with Masson’s trichrome stained histology from the respective sample for comparison. The retardance images show similar trends, as seen in the point measurement results, although some variation was seen as expected (difference in measurement geometry and spatial heterogeneity in tissue optical properties). The retardance is significantly reduced in the region of infarction and increases through the marginal region to higher levels in healthy tissues. In addition, the birefringence in the region of infarct increases with treatment. A reduction in ventricular thickness in the infarct and an increase in thickness with treatment are also visible. The histology images show the healthy myocardium to be nearly entirely composed of muscle (stained red) and little to no collagen (stained blue). This is in sharp contrast to the infarct, which is almost entirely comprised of scar collagen. Some muscle tissue can be seen in the infarct region of the treatment sample, likely as a result of stem-cell-induced regeneration. These imaging results are similar to our previous imaging study,11 where a decrease in retardance with infarction and increase with treatment were also measured. Considerable spatial variation is seen in the birefringence images; not only do the values change from infarct to normal, but also within each region as well. In general, higher values are measured in the middle of the myocardial wall, with lower values toward the edges. This is likely due to the change in orientation of the myocyte fibers through the wall, which undergo a rotation from the outside of the ventricle to the inside35: on the inside and outside of the ventricle, the fibers are oriented perpendicular to our imaging plane, while in the center of the ventricular wall the fibers are parallel to the imaging plane. Hence, the retardance values are generally lower on the outside and inside walls, since the axis of birefringence (direction of the fibers) is along the direction of light propagation, and greater in the center where the axis of birefringence is perpendicular the direction of propagation. To investigate this further, we are currently examining the effects of birefringence axis orientation, and its spatial variation throughout the samples. The spatial variations in the samples could be compounded by retardance phase wrap-around. Since retardance is a measure of the phase difference between two orthogonal polarizations states, once these states have gone out of phase by more than radians, the retardance will wrap-around and decrease. However, a wrap-around correction algorithm36 was employed to detect and appropriately modify any retardance values that have undergone wrap-around. Details on the algorithm can be found in the reference. Additional intersample variations can arise from the uncertainty in the angle at which the samples were sectioned. As mentioned previously, higher retardance values are measured when the fibers are oriented parallel to the measurement plane than when the fibers are perpendicular. Overall statistics from the images are shown in Fig. 6 . Values are the mean and standard deviation of pixel retardance values from the entire healthy, marginal, and infarcted regions of all images for each group. The mean measured retardance values in the images are generally higher than the point measurements, most likely due to the difference in measurement geometry (input imaging beam is off-axis) and the use of wrap-around correction. Reassuringly, the overall trend is similar to that of the point measurements. A statistically significant ( , calculated using a two-tailed Student’s t-test) increase in the retardance was measured in the infarction relative to the control in stem-cell-treated samples, again indicating reorganization of the tissue through remodeling. The margin values remain fairly constant from group to group, while the retardance values in healthy regions increase from the control to the treated samples, although this increase was not found to be significant . The difference in retardance values between infarcted and healthy regions is somewhat lower than for the point measurements, likely due to the point measurements from the healthy regions being made in the center of the myocardial wall, where the retardance is the highest, while the image statistics are calculated from pixels averaged across the whole thickness of the myocardium. Also, differences in SNR can contribute to these discrepancies. Fig. 6Mean ± one standard deviation retardance pixel values from retardance images from health, marginal, and infracted regions. Results are for control and stem-cell-treated animals. denotes statistical significance with respect to the corresponding control. 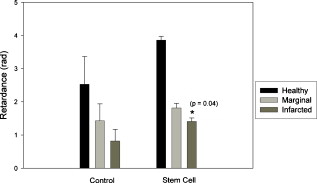 As considerable spatial variation is seen across the sections in the retardance images, the location of point measurement even within a specific region (i.e., healthy region, marginal zone, or infarcted tissue) can greatly influence the results. Thus, care must be taken when interpreting point measurements, as a single value may not be representative of the region. We are currently conducting further studies of the retardance variations, specifically by measuring the orientation of the birefringent axis and relating this to fiber orientations, as previously mentioned. 3.3.Nonlinear MicroscopyThe underlying morphological, microstructural, and compositional changes responsible for the measured changes in birefringence were investigated using nonlinear microscopy, specifically SHG for collagen and TPEF for cardiomyocyte imaging.20 Representative images from healthy and infarcted regions of a control sample are shown in Figs. 7 and 7 , respectively, while a region of regenerating infarction is shown in Fig. 7. Fig. 7Representative nonlinear microscopy images from (a) healthy, (b) infracted, and (c) regenerating regions of myocardial samples. The TPEF signal from cardiomyocytes is shown in red pseudocolor, and the SHG from collagen is shown in green pseudocolor. (Color online only.)  The normal region of the control sample shows primarily highly organized cardiac muscle fibers and occasional collagen fibers, as expected, since collagen comprises less than 2% of healthy myocardial dry weight.37 This correlates well with the histology shown in Fig. 5, where healthy myocardium contains little collagen. Thus, the healthy tissue can be considered to consist primarily of the cardiomyocytes, with interspersed small amounts of collagen, as seen in Fig. 5. This is in sharp contrast to the infarcted region where the opposite is true—the tissue is comprised primarily of scar collagen with decreasing amounts of surviving cardiomyocytes present. This again correlates well with histology shown in Fig. 5, where in contrast to the healthly myocardium, the infarction is nearly entirely composed of collagen. Regions in the infarction image where no signals (neither SHG nor TPEF) were measured likely correspond to regions of myocyte necrosis. The cardiomyocyte compartment has been largely replaced by the collagen compartment due to myocyte death and the resulting collagen scar formation throughout the necrosed tissues. While the collagen fibers in the infarcted region do exhibit some local organization, the overall structure of the tissue is disorganized compared to the healthy tissue. The difference in measured retardance from these two regions is as expected due to the necrosis of the highly organized muscle fibers with high anisotropy, and the partial replacement of these fibers with scar collagen, which overall is relatively isotropic with accordingly low birefringence. The regenerating infarcted tissue from the treatment sample shows collagenous scar tissue and reorganized collagen fibers, as well as muscle fibers that have likely regrown in the region. As the tissue is more organized than the scar tissue in the control infarction region, the higher retardance measured in these regions correspond to the reorganization of the tissue through remodeling (regrowth of myocytes and reduction in collagen), as reflected in the corresponding trend toward increasing anisotropy. Both cardiomyocyte and collagen compartments are present in the regenerating tissue; this is shown by the histology in Fig. 5 as well, where the regenerating scar tissue does contain some muscle. The cardiomyocyte compartment has infiltrated the scar collagen compartment due to the growth of the injected stem cells into cardiac muscle, and has possibly stimulated regrowth of cardiac muscle cells from the surrounding tissues. While the sampling volumes for the microscopy and polarimetry measurements are quite different, the fact that these morphological changes can be observed through polarimetry measurements demonstrates the potential of this technique to monitor regenerative treatments. 4.Conclusions and Future WorkWe demonstrate the ability to characterize myocardial tissue using birefringence measurements, both in point sensing and large-area imaging modes. Specifically, changes in birefringence associated with structural remodeling due to myocardial infarction and regenerative treatments are successfully measured, showing potential for this technique to monitor these regenerative treatments. A decrease in birefringence is measured from healthy to infarcted myocardium; subsequently, an increase in birefringence is measured in the infarctions that had undergone stem cell treatments. As the structural state and organization of the myocardium can be indicative of its functional state, the measurements of structural anisotropy via birefringence can be useful for monitoring of stem cell regenerative treatments. Conventional histology and label-free nonlinear microscopy are used to understand the underlying causes of the birefringence signals and aid in interpreting the signal trends. Work is currently underway in adapting these techniques to bulk tissues where transmission measurements are no longer feasible. This will require the use of diffuse reflectance polarization measurements and likely multiple spatially resolved measurements or polarimetry images to quantify tissue retardance. To aid these studies, work is underway in developing an imaging system with a SNR comparable to the point measurement system. Additional work is also planned for monitoring the retardance in strained ex vivo myocardial tissue, simulating a contracting heart, as the birefringence will likely change under strain. This may provide additional structural and elastographic information concerning the myocardium, as different tissue states (i.e., healthy, marginal, infarcted, and regenerating) will respond differently to applied strain. Extending these techniques to in vivo measurements will involve a number of challenges, including cardiac motion, spatial localization, and delivery of the probe to the myocardial wall (most likely via a catheter). We are currently developing a rigid probe suitable for limited in vivo measurements (e.g., externalized heart), with further probe development currently in the planning stages. To our knowledge, this and our previous work13 are the first studies of polarization birefringence measurements for differentiating healthy, infarcted, and regenerating myocardial tissue. AcknowledgmentsFinancial support from the Natural Sciences and Engineering Research Council of Canada, the Canadian Institutes of Health Sciences, the Canadian Foundation for Innovation, and the Ontario Graduate Scholarship Program is gratefully acknowledged. ReferencesK. R. Chien,
“Regenerative medicine and human models of human disease,”
Nature, 453 302
–305
(2008). https://doi.org/10.1038/nature07037 0028-0836 Google Scholar
T. Reya, S. J. Morrison, M. F. Clarke, and I. L. Weissman,
“Stem cells, cancer, and cancer stem cells,”
Nature, 414 105
–111
(2001). https://doi.org/10.1038/35102167 0028-0836 Google Scholar
M. Jain, H. DerSimonian, D. A. Brenner, S. Ngoy, P. Teller, A. S. B. Edge, A. Zawadzka, K. Wetzel, D. B. Sawyer, W. S. Colucci, C. S. Apstein, and R. Liao,
“Cell therapy attenuates deleterious ventricular remodeling and improves cardiac performance after myocardial infarction,”
Circulation, 103 1920
–1927
(2001). 0009-7322 Google Scholar
D. Orlic, J. Kajstura, S. Chimenti, I. Jackoniuk, S. M. Anderson, B. Li, J. Pickel, K. MacKay, B. Nadal-Ginard, D. M. Bodine, A. Leri, and P. Anversa,
“Bone marrow cells regenerate infarcted myocardium,”
Nature, 410 701
–705
(2001). https://doi.org/10.1038/35070587 0028-0836 Google Scholar
R. Passier, L. W. van Laake, and C. L. Mummery,
“Stem-cell-based therapy and lessons from the heart,”
Nature, 453 322
–329
(2008). https://doi.org/10.1038/nature07040 0028-0836 Google Scholar
N. Christoforou and J. D. Gearhart,
“Stem cells and their potential in cell-based cardiac therapies,”
Prog. Cardiovasc. Dis., 49 396
–413
(2007). https://doi.org/10.1016/j.pcad.2007.02.006 0033-0620 Google Scholar
Y. Sun, J. Q. Zhang, J. Zhang, and S. Lamparter,
“Cardiac remodeling by fibrous tissue after infarction,”
J. Lab. Clin. Med., 135 316
–323
(2000). https://doi.org/10.1067/mlc.2000.105971 0022-2143 Google Scholar
X. Xu, Z. Xu, Y. Xu, and C. Cui,
“Selective down-regulation of extracellular matrix gene expression by bone marrow derived stem cell transplantation into infarcted myocardium,”
Circ. J., 69 1275
–1283
(2005). https://doi.org/10.1253/circj.69.1275 Google Scholar
N. Ghosh, M. F. G. Wood, S. Li, R. D. Weisel, B. C. Wilson, R. Li, and I. A. Vitkin,
“Mueller matrix decomposition for polarized light assessment of biological tissues,”
J. Biophoton., 2 145
–156
(2008). https://doi.org/10.1002/jbio.200810040 Google Scholar
M. F. G. Wood, N. Ghosh, S. Li, R. D. Weisel, B. C. Wilson, R. Li, and A. Vitkin,
“Polarized light based birefringence measurements for monitoring myocardial regeneration,”
Proc. SPIE, 7179 717908
(2009). https://doi.org/10.1117/12.809151 0277-786X Google Scholar
V. V. Tuchin, L. Wang, and D. À. Zimnyakov, Optical Polarization in Biomedical Applications, Springer-Verlag, Berlin
(2006). Google Scholar
R. S. Gurjar, V. Backman, L. T. Perelman, I. Georgakoudi, K. Badizadegan, I. Itzkan, R. R. Dasari, and M. S. Feld,
“Imaging human epithelial properties with polarized light scattering spectroscopy,”
Nat. Med., 7 1245
–1249
(2001). https://doi.org/10.1038/nm1101-1245 1078-8956 Google Scholar
P. Whittaker, D. R. Boughner, and R. A. Kloner,
“Analysis of healing after myocardial infarction using polarized light microscopy,”
Am. J. Pathol., 134 879
–893
(1989). 0002-9440 Google Scholar
M. J. Everett, K. Schoenenberger, B. W. Colston, and L. B. Da Silva,
“Birefringence characterization of biological tissue by use of optical coherence tomography,”
Opt. Lett., 23 228
–230
(1998). https://doi.org/10.1364/OL.23.000228 0146-9592 Google Scholar
C. Sun, Y. Wang, L. Lu, C. Lu, I. Hsu, M. Tsai, C. Yang, Y. Kiang, and C. Wu,
“Myocardial tissue characterization based on a polarization-sensitive optical coherence tomography system with an ultrashort pulsed laser,”
J. Biomed. Opt., 11 054016
(2006). https://doi.org/10.1117/1.2363358 1083-3668 Google Scholar
B. C. Wilson, I. A. Vitkin, and D. L. Matthews,
“The potential of biophotonic techniques in stem cell tracking and monitoring of tissue regeneration applied to cardiac stem cell therapy,”
J. Biophoton., 2 669
–681
(2009). https://doi.org/10.1002/jbio.200910079 Google Scholar
N. Nyolczas, S. Charwat, A. Posa, R. Hemesberger, N. Pavo, H. Hemetsberger, I. J. Pavo, D. Glogar, G. Maurer, and M. Gyöngyösi,
“Tracking the migration of cardially delivered therapeutic stem cells in vivo: state of the art,”
Regen. Med., 4 407
–422
(2009). https://doi.org/10.2217/rme.09.14 Google Scholar
S. P. Nighswander-Rempel, V. V. Kupriyanov, and R. A. Shaw,
“Regional cardiac tissue oxygenation as a function of blood flow and : a near-infrared spectroscopic imaging study,”
J. Biomed. Opt., 11 054004
(2006). https://doi.org/10.1117/1.2357601 1083-3668 Google Scholar
E. M. C. Hillman, O. Bernus, E. Pease, M. B. Bouchard, and A. Pertsov,
“Depth-resolved optical imaging of transmural electrical propagation in perfused heart,”
Opt. Express, 15 17827
–17841
(2007). https://doi.org/10.1364/OE.15.017827 1094-4087 Google Scholar
E. E. Konofaguo, J. D’hooge, and J. Ophir,
“Myocardial elastography—a feasibility study in vivo,”
Ultrasound Med. Biol., 28 475
–482
(2002). https://doi.org/10.1016/S0301-5629(02)00488-X 0301-5629 Google Scholar
M. A. Fallert, M. S. Mirotznik, S. W. Downing, E. B. Savage, K. R. Foster, M. E. Josephson, and D. K. Bogen,
“Myocardial electrical impedance mapping of ischemic sheep hearts and healing aneurysms,”
Circulation, 87 199
–207
(1993). 0009-7322 Google Scholar
E. X. Wu, Y. Wu, J. M. Nicholls, J. Wang, S. Liao, S. Zhu, C. Lau, and H. Tse,
“MR diffusion tensor imaging study of postinfarct myocardium structural remodeling in a porcine model,”
Magn. Reson. Med., 58 687
–695
(2007). https://doi.org/10.1002/mrm.21350 0740-3194 Google Scholar
C. Brosseau, Fundamentals of Polarized Light: A Statistical Optics Approach, John Wiley and Sons, NewYork
(1998). Google Scholar
X. Guo, M. F. G. Wood, and I. A. Vitkin,
“Angularly resolved linear Stokes polarimeter measurements of light scattered by turbid chiral media,”
J. Biomed. Opt., 11 041105
(2006). https://doi.org/10.1117/1.2339134 1083-3668 Google Scholar
M. F. G. Wood, X. Guo, and I. A. Vitkin,
“Polarized light propagation in multiply scattering media exhibiting both linear birefringence and optical activity: Monte Carlo model and experimental methodology,”
J. Biomed. Opt., 12
(1), 014029
(2007). https://doi.org/10.1117/1.2434980 1083-3668 Google Scholar
M. K. Swami, S. Manhas, P. Buddhiwant, N. Ghosh, A. Uppal, and P. K. Gupta,
“Polar decomposition of Mueller matrix: a tool for quantitative tissue polarimetry,”
Opt. Express, 14 9324
–9337
(2006). https://doi.org/10.1364/OE.14.009324 1094-4087 Google Scholar
S. Y. Lu and R. A. Chipman,
“Interpretation of Mueller matrices based on polar decomposition,”
J. Opt. Soc. Am. A, 13 1106
–1113
(1996). https://doi.org/10.1364/JOSAA.13.001106 0740-3232 Google Scholar
N. Ghosh, M. F. G. Wood, and I. A. Vitkin,
“Mueller matrix decomposition for extraction of individual polarization parameters from complex turbid media exhibiting multiple scattering, optical activity, and linear birefringence,”
J. Biomed. Opt., 13 044036
(2008). https://doi.org/10.1117/1.2960934 1083-3668 Google Scholar
N. Ghosh, M. F. G. Wood, and I. A. Vitkin,
“Polarimetry in turbid, birefringent, optically active media: a Monte Carlo study of Mueller matrix decomposition in the backscattering geometry,”
J. Appl. Phys., 105 102023
(2009). https://doi.org/10.1063/1.3116129 0021-8979 Google Scholar
N. Ghosh, M. F. G. Wood, and I. A. Vitkin,
“Influcence of the order of the constituent basis matrices on the Mueller matrix decomposition-derived polarization parameters in complex turbid media such as biological tissue,”
Opt. Commun., 283 1200
–1208
(2010). https://doi.org/10.1016/j.optcom.2009.10.111 0030-4018 Google Scholar
X. Guo, M. F. G. Wood, and I. A. Vitkin,
“Monte Carlo study of pathlength distribution of polarized light in turbid chrial media,”
Opt. Express, 23 2348
–1360
(2007). 1094-4087 Google Scholar
X. Guo, M. F. G. Wood, and I. A. Vitkin,
“A Monte Carlo study of penetration depth and sampling volume of polarized light in turbid media,”
Opt. Commun., 281 380
–386
(2008). https://doi.org/10.1016/j.optcom.2007.09.043 0030-4018 Google Scholar
X. Wang and L. V. Wang,
“Propagation of polarized light in birefringent turbid media: A Monte Carlo study,”
J. Biomed. Opt., 7 350
–358
(2002). https://doi.org/10.1117/1.1483878 1083-3668 Google Scholar
P. P. Sengupta, V. K. Krishnamoorthy, J. Korinek, J. Narula, M. A. Vannan, S. J. Lester, J. A. Tajik, J. B. Seward, B. K. Khandheria, and M. Belohlavek,
“Left ventricular form and function revisited: applied translation science to cardiovascular ultrasound imaging,”
J. Am. Soc. Echocardiogr, 20 539
–551
(2007). https://doi.org/10.1016/j.echo.2006.10.013 0894-7317 Google Scholar
M. A. Wallenburg, M. F. G. Wood, N. Ghosh, M. Pop, G. Wright, and I. A. Vitkin,
“Comparison of optical polarimetry and diffusion tensor MR imaging for assessing myocardial anisotropy,”
J. Innov. Opt. Health Sci., 3 109
–121
(2010). https://doi.org/10.1142/S1793545810000976 Google Scholar
R. A. Kloner, M. C. Fishbein, C. M. Hare, and P. R. Maroko,
“Early ischemic ultrastructural and histochemical alterations in the myocardium of rat following coronary artery occlusion,”
Exp. Mol. Pathol., 30 129
–143
(1979). https://doi.org/10.1016/0014-4800(79)90050-9 0014-4800 Google Scholar
|


