|
|
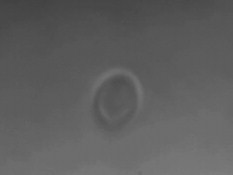
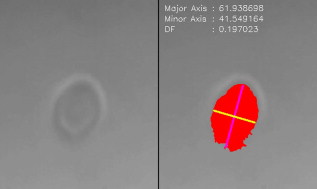
1.IntroductionCellular elastic properties are primarily related to their membrane composition and cytoskeletal architecture, which is remodeled by physiological and pathological events during the life cycle. The forces required to observe deformation range from , depending on the cell type and the area of its application. Accordingly, measured values of cell elasticity vary over orders of magnitude depending on the cell type, health, and technique employed for measurement. For example, malignant fibroblasts have been found with half the elasticity of normal cells as determined by micropipette aspiration,1 whereas malignant epithelial cells have a 10-fold lower elastic modulus than normal cells as measured via scanning force microscopy.2, 3 Furthermore, metastatic cells taken from patients with suspected lung, breast, and pancreas cancer show 70% reduction in the elastic modulus as measured by atomic force microscopy (AFM).4 This study also found that the distribution of cell stiffness for the metastatic cells is much narrower than for healthy cells. Parasitic infection also influences cell mechanics—for example, red blood cells (RBCs) infected by Plasmodium falciparum are observed to be significantly stiffer than normal RBCs, as malaria parasites express proteins that stiffen the cell membrane.5, 6 Differences in the elastic modulus of normal RBCs and those infected with parasites at different growth stages have shown, in some cases, 10-fold increases in the elastic modulus.7, 8 These examples of disease-cell mechanics correlations suggest that cellular mechanical properties may provide a direct route to detecting disease or assessing its progression and motivates the development of a cytometry-based technique for measuring the distribution of elastic parameters. Traditional bulk methods that subject cell suspensions to shear forces and extract a mean deformability with light scattering9, 10 provide average information for large numbers of cells but cannot resolve single-cell properties. In contrast, a range of methods including AFM,11, 12 micro-needles,13, 14 cell stretching between plates,15 micropipette aspiration,16 magnetic microbeads,17 intracellular methods,18, 19 and microfluidic flow-based methods,20, 21 can probe the mechanics of small numbers of individual cells. Most recently, optical trapping techniques have been used to manipulate cells in various ways, both with and without attached micro-beads.22, 23, 24, 25, 26, 27 In an approach closely related to the method presented here, cells trapped by divergent counterpropagating light sources28 have been elongated along the beam axis.28, 29 In this technique, however, each cell is sequentially trapped and then stretched, resulting in very low throughput; efforts to increase speed and perform measurements in microfluidic systems have attained to date.30, 31 However, because both fluid drag on trapped cells and measurement rate are proportional to fluid velocity, extension of this method to flowing systems29 to increase throughput would require increasing laser power to optical intensities that result in cell damage.32, 33 To achieve single-cell resolved measurements for large numbers ( or more) of cells at data acquisition rates comparable to current cell cytometers, we have developed a different approach in which an anisotropic optical trap from a single emitter diode laser probes individual cells in a continuous microfluidic flow. In earlier work with linear traps from single-emitter diodes, we demonstrated that these compact light sources can impart significant forces34 appropriate for actuating flowing cells. Here, we present both experimental and computational results on simplified new geometries for high-throughput cell-mechanics measurements and first demonstrate that a single anisotropic trap can deform static cells. We then extend this approach to cells in microfluidic flow using long diode bars in a format whose throughput is limited only by the time scale of the cell elastic response. To illustrate the mechanism of force generation and to obtain the cell elastic parameters, we model the cell deformation as a function of applied optical trap power using the immersed boundary method (IBM)35 coupled with ray-optics. The IBM has been used extensively to simulate cell–fluid interactions35, 36, 37, 38 and cell interactions with ligand-coated surfaces37 and can be used to model the deformation in both optical and hydrodynamic force fields. In our studies, the diode laser induces optical forces on the cell surface due to the refractive index mismatch and refraction at the fluid/cell interface. This interaction deforms the cell until its elasticity balances the applied optical forces. In addition, the deformation causes fluid flow that leads to viscous stresses that influence the characteristic times for the induced stretch and its relaxation to equilibrium. This combination of experiment and simulation demonstrates that a single linear diode optical trap provides a convenient geometry for inducing deformation and obtaining the shear modulus of each cell from the observed equilibrium deformation at rates . 2.Materials and Methods2.1.Experimental MethodThe experimental design is illustrated in Fig. 1 . Rectangular microfluidic channels deep and wide were fabricated in polydimethyl-siloxane (PDMS) using standard soft lithography techniques39 and bonded to glass using plasma surface activation. A pair of (NA 0.25) objectives was used to image the diode laser into the microfluidic channel. A , single-mode, , laser diode was used for measurements on stationary cells, and a , multimode, , single-emitter laser was used for measurements in flow. Applied laser power was measured at the system input. Fig. 1Experimental setup, including flowing microfluidic geometry. Measurements made within the trap (near the end) and after exiting the trap are used to determine cell shape and orientation.  For this initial study, we employ swollen RBCs because they lack internal structure and their elastic properties have been well characterized. In addition and because only the thin, outer phospholipid membrane contributes to the overall cell elasticity, they can be numerically modeled as a simple spherical elastic shell filled with a homogeneous fluid. Experimentally, samples consisted of heparinized bovine RBCs obtained from a slaughterhouse and used within of acquisition. Samples were centrifuged at for , decanted, and diluted in tris buffered saline at to induce swelling. Measurements on spherical cells simplify simulation of the applied optical forces40 and eliminate rotation of RBCs in the trap.41 RBCs were imaged using Koehler illumination though a Carl Ziess objective and a CCD camera operating at . Images were stored and analyzed by first normalizing and subtracting a background frame, smoothing with a Gaussian kernel, and applying a threshold. Contours were then found using OpenCV,42 which was also used to determine spatial moments, the centroid, an equivalent ellipse, the ellipse orientation relative to the trapping bar, and the major and minor axes magnitudes corresponding to that ellipse. The changes in the minor and major axis width during and after stretch relaxation were used to calculate the percentage of minor stretch as and of major stretch as . Image analysis of stored video was performed on a computer with a quad core processor. Image analysis times are equivalent to video length at and could be done in real time with straightforward program modification. 2.2.Numerical MethodIn the IBM, a finite element model of the cell membrane is used to relate local membrane forces to local membrane deformation. Details of the numerical implementation and validation of the model can be found in previous work.36 Here, we modify the IBM to simulate cell deformation due to diode bar optical traps by imposing external optical forces from a ray-optics model of the light source. We apply these optical forces to find the equilibrium deformation and then remove the forces to simulate the relaxation process. For swollen RBCs, we model the cell as a sphere of initial radius with an infinitely thin, hyperelastic, neo-Hookean membrane of negligible bending resistance, characterized solely by the membrane shear modulus . In this model, the strain energy is given by , where and are the planar principal strains. In our simulations, an unstressed spherical cell is first placed in an incompressible Newtonian fluid with the same density and viscosity as the cytoplasmic fluid. The index of refraction is 1.37 for the fluid inside the cell43 and 1.33 outside the cell. The fluid domain is a cube with a side that is 8 times the cell radius with periodic boundary conditions. The uniform grid used in our simulations has nodes, with a grid spacing of , while the finite element cell grid has 20,480 triangular elements. A time step of was used to ensure numerical stability. To compare the magnitude of the simulated and measured deformations, we characterize the deformed cell with the Taylor deformation parameter , where and are the lengths of the major and minor axes of elongated cells. Defined here for the plane (Fig. 1), describes the geometrical deformation from perfect spheres to highly elongated morphologies. To extract the cell shear modulus from experimental data, we simulate the equilibrium deformation as a function of dimensionless force for several different applied laser powers, thereby generating a standard curve that is used with measurements of to extract a corresponding and . In this, the dimensionless force is defined as , where , with the laser power incident on the cell, the speed of light in a vacuum, the refractive index of the surrounding medium, and a factor describing the amount of momentum transferred, calculated following Ref. 28 for spherical model systems but adapted here for linear optical sources.44 is independent of the power applied and depends only on object geometry and reflectance of the medium. In our simulations and under small deformation, we assume constant forces with a constant calculated as 0.011. 3.Results and Discussion3.1.Experimental Results/Static MeasurementsWe first show in Fig. 2 that a single, anisotropic beam can be used to elongate individual RBCs trapped with a laser diode under static, no-flow conditions. Laser powers up to consistently lead to stretching on the order of 5 to 15%, where, at lower applied powers, a clear linear trend is observed. The change in slope and the large error bars at higher applied powers demonstrate a limit to the amount of power an RBC can experience before permanent deformation in a static optical trap if exposed for long times.33 If, however, stretching times are kept short, repeated measurements can be made on a single RBC at higher powers, as demonstrated in Fig. 3 and Video 1 . In these measurements, the undeformed RBCs are not spherical; thus, the laser induces both alignment and stretch along the long axis of the laser beam. The major stretch axis of the cell and the laser axis are not perfectly aligned because the “long” axis of the laser is significantly shorter than the RBC diameter . Figure 4 and Video 2 quantify both the measured cell stretch and relaxation as the laser is repeatedly switched on and off. No deviation of measured stretch was seen in . A fit of the measured stretch relaxation to a decaying exponential over multiple measurements indicates that the time scales for the stretching and cell relaxation are on the order of , as observed in previous studies.45, 46 Fig. 2Measured RBC minor axis stretch as a function of applied power under static conditions. Insets show images of cells at three different applied powers: (a) ; (b) ; (c) . RBCs were individually trapped and stretched during a ramping of applied power for a total time of approximately . A linear fit to the low-power regime finds that . 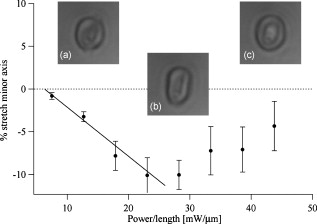 Fig. 3Sequential images of an RBC repeatedly stretched with a laser diode at applied power. (a) Trap on; (b) then off; (c) then on again (Video 1). Unlike the slower ramping experiments of Fig. 2, higher powers can be employed for repeated, rapid measurement where we have seen no alteration of cell behavior after 50 pulses. Scale .  Fig. 4Cell relaxation in the repeated stretches of Fig. 3 and Video 1 with deformation (raw data inset) relative to the unstretched size as the laser is removed. Simple exponential fit to the cell relaxation after removal of the stretching laser gives .  3.2.Experimental Results/Dynamic MeasurementsHere, we present measurements of RBC stretching in rectangular microfluidic channels at flow speeds of with a emitter operated at measured at the imaging plane outside the medium (Fig. 5 ). By comparing the cell size before and after exiting the trap, the average stretch was found to be 2 to 3%. Due to conservation of mass, stretch along the minor axis is negative, while stretch along the major axis (parallel to the laser axis) is positive [Fig. 5], and as expected, cells tend to orient along the axis of the trap [Fig. 5]. Simple geometric considerations assuming a constant ellipsoidal volume indicate an average cell deformation along the beam axis of 1.6%. Although this value is reasonable, validation of the constant volume assumption and direct measurement of cell deformation along this axis was not possible with the current experimental setup. One can also recast this data in terms of , as shown in Fig. 6 , where the stretch within the optical trap is seen as a cluster of data above the line. In this single experiment, data for 1275 RBCs were taken in under at a rate of . This measurement rate is significantly faster than previous single-cell measurement demonstrations.29 Fig. 5Dot plot of deformations for 1275 optically stretched RBCs measured in microfluidic flow in . (a) Major axis versus minor axis stretch. The median stretch along the minor axis is , while the median stretch along the major axis is 1.7%. (b) Angle of stretched cell within the diode-bar optical trap in a flowing microfluidic environment. Cells clearly tend to align along the linear trap axis.  3.3.Computational ResultsNext, we present computational results describing the force profiles and deformations generated by the trap laser. The prediction of net optical forces on cells and colloids has been described in the literature;47, 48 however, modeling of cell optical stretching forces has only recently been discussed.45, 49 In these models, a ray optics approach used to determine the optical forces on large spherical systems is extended to calculation of local stress profiles across the front and back sphere surfaces as a function of refractive index and incident laser beam profile. This approach is valid when the size of the object is much larger than the wavelength of the light,50 which is true here as the diameter of the erythrocytes ranges from . As the input light rays refract, a change in path leads to a change in the momentum carried by the light that is transferred to the interface through conservation. When the interface is an object, its surface absorbs this momentum, and a force proportional to the laser power is created by Newton’s second law. In our calculations, the parallel ray hits the front surface of sphere, and the refracted angle is found using Snell’s law, as detailed in Ref. 28. Multiple reflections are neglected. To integrate the forces imposed by optical stretching into the IBM, the optical forces are first calculated on the nodes of the 3-D membrane finite element grid. As the cell deforms, the applied optical forces are assumed to remain constant but move with the membrane nodes, an approximation valid for small deformations. If the front surface of the cell were significantly deformed, the changing refraction would broaden the stretching profile on the back side of the cell, leading to significant asymmetry in the force distribution. Although simulations that take this into account are certainly feasible, our experiments are performed at lower applied optical powers with smaller induced deformations, where the difference in cell optical forces on the cell is negligible. Our simulations show that a single diode bar induces stretching forces on both the front and back sides of the cell, with an equilibrium deformation dependent on the applied power. In addition to the steady state deformation induced by the optical stretcher, we observe that a single diode bar produces a net translating force in the direction, pushing the cell away from the light source. This motion is apparent over the time scale of the applied stretching forces. In an unconfined system, one can estimate the expected translation away from the optical trap with . Using typical parameters, we estimate for applied powers, leading to a translation of in the measurement times necessary; however, in our highly confined systems, significant movement in the direction was not observed. In this case, translation out of the image plane was likely prevented by the presence of the wall, where, with a corresponding , any influence of the physical confinement on deformation is expected to be relatively small. 3.4.Cell Elasticity CytometryTo prepare a general relation between measured deformation and applied laser power, a set of simulations was performed at varying applied forces [Fig. 7 ] with a characteristic time for deformation of and for stretch relaxation. These results demonstrate that cells rapidly stretch but reach a maximum deformation at longer times. Upon removal of the applied forces, the cell relaxes back to initial shape, where as expected, the equilibrium deformation increases with the applied force, as does the response time needed to reach equilibrium. We have tested this approach by simulating the deformation of model cells of different size and elastic modulus and found that the resulting deformations fall on the same master curve. Figure 7 shows the dimensionless force as a function of , a plot (curve fit) that allows for determination of the cell shear modulus from the experimental laser diode measurements. In this, cells are stretched until equilibrium at a given power and the corresponding found from the measured deformation, as illustrated in Fig. 7. is then obtained from . Figure 8 demonstrates this approach on the data presented in Figs. 5 and 6 under high-throughput conditions, where the resulting scatter in is apparent in the population of stretched cells and a median value of is measured. This value falls within the range of values reported for the shear modulus of human RBCs of 22, 26, 28 measured under varying osmotic conditions. Note that for the individual measurements in which is negative, our approach results in a negative cell stiffness. Despite the inaccuracy inherent in each individual measurement using bright-field imaging of the cells, we obtain results that cluster around a physically reasonable median value. Higher contrast methods that resolve the cell sizes more precisely would eliminate these points. Furthermore, the reasonable agreement between our median value and published values of implies that even relatively simple instrumentation with low-precision size measurements could be used to create practical devices. Fig. 7(a) Dynamics of cell deformation for different applied forces where a maximum value is reached before the applied forces are removed and relaxation is observed. Note that different time scales are used for the stretching and relaxation processes. (b) Variation of the equilibrium stretch as a function of applied force, where is fitted to a simple polynomial. The mean experimental value measured in Fig. 5 is  Fig. 8The measured shear modulus extracted for each cell in the dynamic cell stretcher. Because of large variations in the outlying data, median values are used and determined as .  The theoretical maximum measurement rate for stretching in flow is set by the response time of the cells. In particular, the cells must remain stretched for times within the trap on the order of the relaxation time constant , for which we use the value of determined in the static measurements of Fig. 4. Defining a characteristic cell dimension that includes average spacing between cells allows prediction of maximum theoretical device throughput . With a diode bar of length and using a characteristic spacing of , measurements of are achievable given the current system and experimental parameters. Significantly higher throughput will be achievable with stiffer cells, which have faster relaxation times, and by parallelizing the design, which is a desirable and achievable goal with the microfluidic platform used in this study. 4.ConclusionsIn conclusion, we demonstrate that a simple asymmetric optical trap created by an inexpensive diode laser can be used to optically stretch blood cells in both static and dynamic, flowing environments. This approach is both practical and scalable, making it a useful technology for rapid measurements of cell deformability. Of particular advantage is that the method is optically based and is therefore inherently compatible with current optical cell-characterization technologies. In addition, we simulate the transient cell deformation induced by a single linear diode bar optical stretcher and compare the deformation and relaxation by varying laser power on cells with neo-Hookean membrane properties. Our simulations show that the forces imposed by a single diode bar optical stretcher can be used to both deform and translate cells and that a dimensionless single master curve relating laser power to cell deformation enables one to determine the cell elasticity of significant numbers of individual cells. AcknowledgmentsThe authors gratefully acknowledge support from the National Science Foundation under Grant No. DBI-045468, the National Institutes of Health under Grant No. RO1-AI063366, and from the Butcher Foundation. RJ is a staff member in the Quantum Physics Division of NIST. ReferencesK. A. Ward, W. I. Li, S. Zimmer, and T. Davis,
“Viscoelastic properties of transformed-cells—role in tumor-cell progression and metastasis formation,”
Biorheology, 28
(3–4), 301
–313
(1991). 0006-355X Google Scholar
M. Lekka, P. Laidler, D. Gil, J. Lekki, Z. Stachura, and A. Z. Hrynkiewicz,
“Elasticity of normal and cancerous human bladder cells studied by scanning force microscopy,”
Eur. Biophys. J., 28 312
–316
(1999). https://doi.org/10.1007/s002490050213 0175-7571 Google Scholar
S. Park, D. Koch, R. Cardenas, J. Kas, and C. K. Shih,
“Cell motility and local viscoelasticity of fibroblasts,”
Biophys. J., 89
(6), 4330
–4342
(2005). https://doi.org/10.1529/biophysj.104.053462 0006-3495 Google Scholar
Q. S. Li, G. Y. H. Lee, C. N. Ong, and C. T. Lim,
“AFM indentation study of breast cancer cells,”
Biochem. Biophys. Res. Commun., 374
(4), 609
–613
(2008). https://doi.org/10.1016/j.bbrc.2008.07.078 0006-291X Google Scholar
G. Y. H. Lee and C. T. Lim,
“Biomechanics approaches to studying human diseases,”
Trends Biotechnol., 25
(3), 111
–118
(2007). https://doi.org/10.1016/j.tibtech.2007.01.005 0167-7799 Google Scholar
S. Suresh, J. Spatz, J. P. Mills, A. Micoulet, M. Dao, C. T. Lim, M. Beil, and T. Seufferlein,
“Connections between single-cell biomechanics and human disease states: gastrointestinal cancer and malaria,”
Acta Biomater., 1 15
–30
(2005). https://doi.org/10.1016/j.actbio.2004.09.001 1742-7061 Google Scholar
J. P. Mills, M. Diez-Silva, D. J. Quinn, M. Dao, M. J. Lang, K. S. Tan, C. T. Lim, G. Milon, P. H. David, O. Mercereau-Puijalon, S. Bonnefoy, and S. Suresh,
“Effect of plasmodial RESA protein on deformability of human red blood cells harboring Plasmodium falciparum,”
Proc. Natl. Acad. Sci. U.S.A., 104
(22), 9213
–9217
(2007). https://doi.org/10.1073/pnas.0703433104 0027-8424 Google Scholar
S. Suresh,
“Mechanical response of human red blood cells in health and disease: some structure-property-function relationships,”
J. Mater. Res., 8 1871
–1877
(2006). https://doi.org/10.1557/jmr.2006.0260 0884-2914 Google Scholar
W. Groner, N. Mohandas, and M. Bessis,
“New optical technique for measuring erythrocyte deformability with the ektacytometer,”
Clin. Chem., 26 1435
–1442
(1980). 0009-9147 Google Scholar
Y. R. Kim and L. Ornstein,
“Isovolumetric sphering of erythrocytes for more accurate and precise cell volume measurement by flow cytometry,”
Cytometry, 3 419
–427
(1983). https://doi.org/10.1002/cyto.990030606 0196-4763 Google Scholar
A. L. Weisenhorn, M. Khorsandi, S. Kasas, V. Gotzos, and H. J. Butt,
“Deformation and height anomaly of soft surfaces studied with an AFM,”
Nanotechnology, 4 106
–113
(1993). https://doi.org/10.1088/0957-4484/4/2/006 0957-4484 Google Scholar
M. Radmacher, M. Fritz, C. M. Kacher, J. P. Cleveland, and P. K. Hansma,
“Measuring the viscoelastic properties of human platelets with the atomic force microscope,”
Biophys. J., 70 556
–567
(1996). https://doi.org/10.1016/S0006-3495(96)79602-9 0006-3495 Google Scholar
B. Daily, E. L. Elson, and G. I. Zahalak,
“Cell poking: determination of the elastic area compressibility modulus of the erythrocyte membrane,”
Biophys. J., 45 671
–682
(1986). https://doi.org/10.1016/S0006-3495(84)84209-5 0006-3495 Google Scholar
S. Felder and E. L. Elson,
“Mechanics of fibroblast locomotion: quantitative analysis of forces and motions at the leading lamellas of fibroblasts,”
J. Cell Biol., 111 2513
–2526
(1990). https://doi.org/10.1083/jcb.111.6.2513 0021-9525 Google Scholar
O. Thoumine and A. Ott,
“Time scale dependent viscoelastic and contractile regimes in fibroblasts probed by microplate manipulation,”
J. Cell. Sci., 110 2109
–2116
(1997). 0021-9533 Google Scholar
R. M. Hochmuth,
“Micropipette aspiration of living cells,”
J. Biomech., 33
(1), 15
–22
(2000). https://doi.org/10.1016/S0021-9290(99)00175-X 0021-9290 Google Scholar
R. C. Spero, L. Vicci, J. Cribb, D. Bober, V. Swaminathan, E. T. O’Brien, S. L. Rogers, and R. Superfine,
“High throughput system for magnetic manipulation of cells, polymers, and biomaterials,”
Rev. Sci. Instrum., 79 083707
(2008). https://doi.org/10.1063/1.2976156 0034-6748 Google Scholar
S. Kumar, I. Z. Maxwell, A. Heisterkamp, T. R. Polte, T. P. Lele, M. Salanga, E. Mazur, and D. E. Ingber,
“Viscoelastic retraction of single living stress fibers and its impact on cell shape, cytoskeletal organization, and extracellular matrix mechanics,”
Biophys. J., 90
(10), 3762
–3773
(2006). https://doi.org/10.1529/biophysj.105.071506 0006-3495 Google Scholar
Y. Tseng, T. P. Kole, and D. Wirtz,
“Micromechanical mapping of live cells by multiple-particle-tracking microrheology,”
Biophys. J., 83
(6), 3162
–3176
(2002). https://doi.org/10.1016/S0006-3495(02)75319-8 0006-3495 Google Scholar
S. C. Gifford, M. G. Frank, J. Derganc, C. Gabel, R. H. Austin, T. Yoshida, and M. W. Bitensky,
“Parallel microchannel-based measurements of individual erythrocyte areas and volumes,”
Biophys. J., 84 623
–633
(2003). https://doi.org/10.1016/S0006-3495(03)74882-6 0006-3495 Google Scholar
J. P. Shelby, J. White, K. Ganesan, P. K. Rathod, and D. T. Chiu,
“A microfluidic model for single-cell capillary obstruction by Plasmodium falciparum–infected erythrocytes,”
Proc. Natl. Acad. Sci. U.S.A., 100 14618
–14622
(2003). https://doi.org/10.1073/pnas.2433968100 0027-8424 Google Scholar
P. B. Bareil, Y. Sheng, Y. Q. Chen, and A. Chiou,
“Calculation of spherical red blood cell deformation in a dual-beam optical stretcher,”
Opt. Express, 15
(24), 16029
–16034
(2007). https://doi.org/10.1364/OE.15.016029 1094-4087 Google Scholar
P. B. Bareil, Y. L. Sheng, and A. Chiou,
“Local stress distribution on the surface of a spherical cell in an optical stretcher,”
Opt. Express, 14
(25), 12503
–12509
(2006). https://doi.org/10.1364/OE.14.012503 1094-4087 Google Scholar
P. J. H. Bronkhorst, G. J. Streekstra, J. Grimbergen, E. J. Nijhof, J. J. Sixma, and G. J. Brakenhoff,
“A new method to dtudy dhape recovery of ted blood vells using multiple optical trapping,”
Biophys. J., 69 1666
–1673
(1995). https://doi.org/10.1016/S0006-3495(95)80084-6 0006-3495 Google Scholar
R. R. Haruta, M. L. Barjas-Castro, S. T. O. Saad, F. F. Costa, A. Fontes, L. C. Barbosa, and C. L. Cesar,
“Mechanical properties of stored red blood cells using optical tweezers,”
Blood, 92 2975
–2977
(1998). 0006-4971 Google Scholar
S. Hénon, G. Lenormand, A. Richert, and F. Gallet,
“A new determination of the shear modulus of the human erythrocyte membrane using optical tweezers,”
Biophys. J., 76 1145
–1151
(1999). https://doi.org/10.1016/S0006-3495(99)77279-6 0006-3495 Google Scholar
G. B. Liao, P. B. Bareil, Y. Sheng, and A. Chiou,
“One-dimensional jumping optical tweezers for optical stretching of bi-concave human red blood cells,”
Opt. Express, 16 1996
–2004
(2008). https://doi.org/10.1364/OE.16.001996 1094-4087 Google Scholar
J. Guck, R. Ananthakrishnan, H. Mahmood, T. J. Moon, C. C. Cunningham, and J. Käs,
“The optical stretcher: a novel laser tool to micromanipulate cells,”
Biophys. J., 81 767
–784
(2001). https://doi.org/10.1016/S0006-3495(01)75740-2 0006-3495 Google Scholar
J. Guck, S. Schinkinger, B. Lincoln, F. Wottawah, S. Ebert, M. Romeyke, D. Lenz, H. M. Erickson, R. Ananthakrishnan, D. Mitchell, J. Käs, S. Ulvick, and C. Bilby,
“Optical deformability as an inherent cell marker for testing malignant transformation and metastatic competence,”
Biophys. J., 88
(5), 3689
–3698
(2005). https://doi.org/10.1529/biophysj.104.045476 0006-3495 Google Scholar
B. Lincoln, S. Schinkinger, K. Travis, F. Wottaway, S. Ebert, F. Sauer, and J. Guck,
“Reconfigurable microfluidic integration of a dual-beam laser trap with biomedical applications,”
Biomed. Microdevices, 9 703
–710
(2007). https://doi.org/10.1007/s10544-007-9079-x 1387-2176 Google Scholar
B. Lincoln, F. Wottawah, S. Schinkinger, S. Ebert, and J. Guck,
“High-throughput rheological measurements with an optical stretcher,”
Methods Cell Biol., 83 397
–423
(2007). https://doi.org/10.1016/S0091-679X(07)83017-2 0091-679X Google Scholar
Y. Liu, G. J. Sonek, M. W. Berns, and B. J. Tromberg,
“Physiological monitoring of optically trapped cells: assessing the effects of confinement by laser tweezers using microfluorometry,”
Biophys. J., 71 2158
–2167
(1996). https://doi.org/10.1016/S0006-3495(96)79417-1 0006-3495 Google Scholar
K. C. Neuman, E. H. Chadd, G. F. Liou, K. Bergman, and S. M. Block,
“Characterization of photodamage to Escherichia coli in optical traps,”
Biophys. J., 77 2856
–2863
(1999). https://doi.org/10.1016/S0006-3495(99)77117-1 0006-3495 Google Scholar
R. W. Applegate Jr., J. Squier, T. Vestad, J. Oakey, and D. W. M. Marr,
“Optical trapping, manipulation, and sorting of cells and colloids in microfluidic systems with diode laser bars,”
Opt. Express, 12 4390
–4398
(2004). https://doi.org/10.1364/OPEX.12.004390 1094-4087 Google Scholar
C. Peskin and D. McQueen,
“A three-dimensional computational method for blood flow in the heart I. Immersed elastic fibers in a viscous incompressible fluid,”
J. Comput. Phys., 81 372
–405
(1989). https://doi.org/10.1016/0021-9991(89)90213-1 0021-9991 Google Scholar
C. D. Eggleton and A. S. Popel,
“Large deformation of red blood cell ghosts in a simple shear flow,”
Phys. Fluids, 10
(8), 1834
–1845
(1998). https://doi.org/10.1063/1.869703 1070-6631 Google Scholar
P. Pawar, S. Jadhav, C. D. Eggleton, and K. Konstantopoulos,
“Roles of cell and microvillus deformation and receptor-ligand binding kinetics in cell rolling,”
Am. J. Physiol. Heart Circ. Physiol., 298 H1439
–H1450
(2008). https://doi.org/10.1152/ajpheart.91536.2007 0363-6135 Google Scholar
C. S. Peskin,
“Numerical analysis of blood flow in the heart,”
J. Comput. Phys., 25 220
–252
(1977). https://doi.org/10.1016/0021-9991(77)90100-0 0021-9991 Google Scholar
D. C. Duffy, J. C. McDonald, O. J. A. Schueller, and G. M. Whitesides,
“Rapid prototyping of microfluidic systems in poly(dimethylsiloxane),”
Anal. Chem., 70
(23), 4974
–4984
(1998). https://doi.org/10.1021/ac980656z 0003-2700 Google Scholar
J. T. Yu, J. Y. Chen, Z. F. Lin, L. Xu, P. N. Wang, and M. Gu,
“Surface stress on the erythrocyte under laser irradiation with finite-difference time-domain calculation,”
J. Biomed. Opt., 10 064013
(2005). https://doi.org/10.1117/1.2136847 1083-3668 Google Scholar
S. C. Grover, R. C. Gauthier, and A. G. Skirtach,
“Analysis of the behavior of erythrocytes in an optical trapping system,”
Opt. Express, 7 533
–539
(2000). https://doi.org/10.1364/OE.7.000533 1094-4087 Google Scholar
E. Evans and Y. C. Fung,
“Improved measurements of the erythrocyte geometry,”
Microvasc. Res., 4
(4), 335
–347
(1972). https://doi.org/10.1016/0026-2862(72)90069-6 0026-2862 Google Scholar
R. W. Applegate Jr., J. Squier, T. Vestad, J. Oakey, and D. W. M. Marr,
“Fiber-focused diode-bar optical trapping for microfluidic flow manipulation,”
Appl. Phys. Lett., 92 013904
(2008). https://doi.org/10.1063/1.2829589 0003-6951 Google Scholar
F. Wottawah, S. Schinkinger, B. Lincoln, R. Ananthakrishnan, M. Romeyke, J. Guck, and J. Käs,
“Optical rheology of biological cells,”
Phys. Rev. Lett., 94 098103
(2005). https://doi.org/10.1103/PhysRevLett.94.098103 0031-9007 Google Scholar
C. T. Lim, M. Dao, S. Suresh, C. H. Sow, and K. T. Chew,
“Large deformation of living cells using laser traps,”
Acta Mater., 52 1837
–1845
(2004). https://doi.org/10.1016/j.actamat.2003.12.028 1359-6454 Google Scholar
A. Ashkin,
“Forces of a single-beam gradient laser trap on a dielectric sphere in the ray optics regime,”
Biophys. J., 61 569
–582
(1992). https://doi.org/10.1016/S0006-3495(92)81860-X 0006-3495 Google Scholar
J. Y. Walz and D. C. Prieve,
“Prediction and measurement of the optical trapping forces on a microscopic dielectric sphere,”
Langmuir, 8 3073
–3082
(1992). https://doi.org/10.1021/la00048a037 0743-7463 Google Scholar
J. Guck, R. Ananthakrishnan, T. J. Moon, C. C. Cunningham, and J. Käs,
“Optical deformability of soft biological dielectrics,”
Phys. Rev. Lett., 84 5451
–5454
(2000). https://doi.org/10.1103/PhysRevLett.84.5451 0031-9007 Google Scholar
H. C. van de Hulst, Light Scattering by Small Particles, John Wiley and Sons, New York
(1957). Google Scholar
|