
|
|
1.IntroductionOptical transillumination was used extensively before the discovery of x-rays for the detection of dental caries. Over the past two decades, there has been continued interest in this method, especially with the availability of high intensity fiber-optic-based illumination systems for the detection of interproximal lesions.1, 2, 3, 4, 5, 6, 7 During fiber optic transillumination, a carious lesion appears dark because of decreased transmission due to increased scattering and absorption by the lesion. Several studies have been carried out using visible light transillumination, either as an adjunct to bitewing radiography or as a competing method for the detection of interproximal caries lesions.8, 9, 10, 11, 12 However, since light scattering by sound enamel is significant in the visible range, the results are mixed.8, 9 Light scattering in sound enamel decreases markedly from the visible to the NIR.13, 14 Even though light scattering for sound enamel is at a minimum near , the light scattering coefficient of enamel increases by 2 to 3 orders of magnitude on demineralization due to the formation of pores—on a similar size scale to the wavelength of the light—that act as Mie scatterers.15 Transmission measurements through demineralized tissue sections at show that demineralized enamel attenuates NIR light by a factor 20 to 50 times greater than for sound enamel.16, 17 Transillumination imaging at longer wavelengths in the NIR have been investigated in the region accessible to conventional silicon-based charge-coupled device (CCD) cameras, namely 18, 19 and at ,16, 17 where maximal transmission occurs. NIR images were acquired of natural interproximal and occlusal lesions through the transillumination of extracted human teeth.16, 17 Early enamel white spot lesions can be discriminated from sound enamel by visual observation or by visible-light diffuse reflectance imaging.20, 21 The visibility of scattering structures on highly reflective surfaces such as teeth can be enhanced by use of crossed polarizers to remove the glare from the surface due to the strong specular reflection from the enamel surface.22, 23 The contrast between sound and demineralized enamel can be further enhanced by depolarization of the scattered light in the area of demineralized enamel.24, 25 The contrast between sound and demineralized enamel is greatest in the NIR due to the minimal scattering of sound enamel, and this can be exploited for reflectance imaging of early demineralization.15 Wu and Fried26 reported the first high contrast polarized reflectance images of early demineralization on buccal and occlusal tooth surfaces measured at , and found that the contrast was significantly higher at than in the visible range. Two additional advantages were noted in our previous NIR imaging studies over visible light methods. In NIR images of the occlusal surfaces, stains were often not visible, since the organic molecules responsible for pigmentation absorb poorly in the NIR,27 making it easier to identify areas of demineralization. Mild developmental defects28 and shallow demineralization26 appeared differently from deeper, more severe demineralization due to caries, suggesting that we may be able to gauge the severity of lesions by analyzing both NIR reflective images and NIR transillumination images of these surfaces. Our previous NIR imaging studies utilized InGaAs focal plane arrays (FPAs) that were of low pixel density ( pitch) and an array size of . InGaAs FPAs are very expensive and challenging to manufacture. A new NIR imaging technology, the germanium-enhanced complementary metal-oxide semiconductor (CMOS), can potentially be less expensive and more practical for low-cost, high-volume manufacturing. Moreover, the NIR CMOS camera had a larger array size and higher pixel density ( pixel pitch). In summary, the objective of this imaging study was to determine if the area and contrast of occlusal caries lesions in NIR images can be used to estimate lesion severity, and to compare the image contrast of natural caries lesions measured using two NIR imaging technologies. 2.Materials and Methods2.1.Sample PreparationExtracted human teeth with natural occlusal caries lesions were collected from patients in the San Francisco Bay area with approval from the University of California, San Francisco (UCSF) Committee on Human Research, cleaned, sterilized with gamma radiation, and stored in a 0.1% thymol solution to preserve tissue hydration and to prevent bacterial growth. Radiographs and visible light images were acquired of each tooth. Radiographs were acquired directly on Ultra-Speed™ F-speed film (Kodak, Rochester, New York) using , , and 12 impulses. 2.2.Near-Infrared ImagingTwo different NIR imaging devices operating at were used to capture transillumination images. The first device used was a high sensitivity InGaAs FPA, model SU320KTSX from Sensors Unlimited (Princeton, New Jersey). The second device used was a Ge-enhanced CMOS image sensor, model NP-EC700M-01 evaluation camera, from NoblePeak Vision (Wakefield, Massachusetts). NIR light was provided by a superluminescent diode (SLD) with an output power of and a bandwidth, model SLED1300D20A from Optospeed (Zurich, Switzerland). NIR images were taken using the configurations shown in Fig. 1 . Two imaging configurations were used for transillumination. In the first setup, the output from a single-mode optical fiber was collimated by a -diam NIR fiber collimator from Micro Laser Systems (Garden Grove, California) and focused by a focal length cylindrical lens at a position just above the cementum-enamel junction (CEJ) of each tooth [Fig. 1]. A sheet of light was delivered to the CEJ. This light serves as a subsurface illumination source that propagates up through the tooth and through the enamel of the occulsal surface, which is imaged by the NIR imaging systems. This is the same setup that we used in previous in vitro occlusal imaging studies.27 The second setup utilized the novel arrangement that we previously used for in vivo imaging,29 incorporating two fibers with Teflon optical diffusers aimed at a position just above the CEJ of each tooth [Fig. 1]. This second setup was only used with the InGaAs FPA. Fig. 1Different NIR imaging configurations used. (a) NIR source (S) focused with a cylindrical lens on the CEJ. (b) Two sources on each side of the tooth directed at the CEJ. (c) Reflectance imaging in which the NIR light is directed at the tooth occlusal surface. (Color online only.)  NIR reflectance images were acquired using only the InGaAs FPA [Fig. 1]. For reflectance measurements, the surface was illuminated without the cylindrical lens, and crossed polarizers were used to remove the specular reflection from the tooth surface (glare). 2.3.Polarized Light MicroscopyThe teeth were mounted on orthodontic resin blocks that are used for both imaging and for histological sectioning. Sections thick were cut using a linear precision saw, the IsoMet 5000 (Buehler, Lake Buff, Illinois). Polarized light microscopy (PLM) was carried out using a Meiji Techno RZT microscope (Saitama, Japan) with an integrated digital camera, the Canon EOS Digital Rebel XT from Canon (Tokyo, Japan). The sample sections were imbibed in water and examined in the brightfield mode with cross-polarizers and a red I plate with retardation. 2.4.Transverse MicroradiographyThin sections used in PLM were also imaged using transverse microradiography (TMR). A custom-built digital TMR system was used to measure mineral loss in the different partitions of the sample.30 A high-speed motion control system with a Newport (Irvine, California) UTM150 and 850G stages, and an ESP300 controller coupled to a video microscopy and laser targeting system was used for precise positioning of the tooth samples in the field of view of the imaging system. The volume percent mineral for each sample thin section was determined by comparison with a calibration curve of x-ray intensity versus sample thickness, created using sound enamel sections of mineral varying from in thickness. The calibration curve was validated via comparison with cross sectional microhardness measurements. The volume percent mineral determined using microradiography for section thickness ranging from correlated highly with the volume percent mineral determined using microhardness .30 TMR was primarily used in this study to determine the penetration of the lesion through the dentin. It is easy to measure the extent of the lesions in enamel using PLM; however, it is much harder to differentiate lesions in dentin using PLM, and TMR was needed to confirm the depth of demineralization. 2.5.Histology and Image AnalysisLesions were examined and classified according to the lesion depth as follows: (E1) less than halfway to the dentinal-enamel junction (DEJ), (E2) more than halfway to the DEJ, (D1) penetration to the DEJ but less than halfway to the pulp chamber, and (D2) more than halfway through the dentin into the inner dentin adjacent to the pulp chamber. Line profiles with a width of five pixels were extracted from each NIR image aligned with the histological sections, and the lesion or image contrast was calculated using ; where is the mean intensity of the sound enamel, i.e., the mean of all the pixels from the sound enamel along the line profile, and is the mean intensity from the corresponding lesion portion of the line profile. The line profiles match the position of the thin sections cut for examination using PLM and TMR. The image contrast varies from 0 to 1, where 1 is very high contrast and 0 is no contrast. Figure 2 shows visible and NIR images of one of the lesions used in the study. The dotted line demarcates the position of the line profile used for calculation of the contrast, and the line matches the corresponding PLM image of the thin section that is also shown. The contrast is reversed for reflectance measurements, i.e., . The number of pixels in the lesion area was also measured using image analysis software, both in reflectance and in transmission. All image analyses were carried out using Igor Pro software from Wavemetrics (Lake Oswego, Oregon). A one-way analysis of variance (ANOVA) followed by the Tukey-Kramer posthoc multiple comparison test was used to compare the lesion contrast and lesion area for all groups for each type of lesion employing InStat software from GraphPad (San Diego, California). Only one lesion per tooth was used in the analysis. Fig. 2(a) Visible-light reflectance and (b) NIR transillumination images. The NIR image was captured with the Ge-enhanced CMOS camera using the setup of Fig. 1. (c) A PLM image of a thin section cut along the yellow dotted lines in (a) and (b) shows the position and depth of the lesion that penetrates to the dentin-enamel junction and is classified as a D1 lesion. (Color online only.) 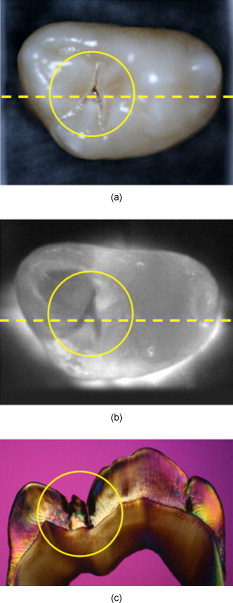 3.ResultsSeveral images of a third molar tooth with a deep lesion (D2) that were taken using visible light reflectance and NIR transillumination using two NIR imaging setups are shown in Fig. 3 , along with a radiograph and PLM images of two sections that were cut along the yellow dotted lines, as indicated in Fig. 3. The visible light reflectance image in Fig. 3 manifests staining and discoloration; however, there is no decay visible in the radiograph. Therefore, the conventional methods of examination do not reveal the severity of the occlusal decay. Typically, occlusal lesions are not visible in a radiograph unless they are very severe, and the D2 lesion in this tooth is not visible on the radiograph, nor are the less severe lesions shown in Figs. 2, 4, 5 . The histological sections of Figs. 3 and 3 indicate that the lesions penetrate into the dentin. The NIR transillumination images shown in Figs. 3 and 3 show the lesion areas with high contrast without the interference of staining and discoloration, and these areas of high contrast match the positions of deep lesion penetration indicated in the histology. Staining and discoloration can interfere with imaging in the visible region; however, the chromophores responsible for stains do not absorb NIR light and therefore do not interfere at NIR wavelengths, as can be seen by comparing the NIR images of Figs. 3 and 3 with Fig. 3. Polarized light microscopy images of the two cross sections are also shown in Figs. 3 and 3. Dark regions in the PLM images of enamel indicate areas of demineralization, and they are easy to distinguish from the transparent sound regions. However, it is more difficult to differentiate dentin lesions from sound dentin using PLM alone. For the samples that were difficult to classify by using PLM, TMR was used to verify the severity of the lesion. Fig. 3Images of one of the tooth samples with a D2 lesion. (a) Visible-light reflectance image, (b) radiograph, (c) and (d) PLM images of the sections cut along the yellow dotted lines in (a) NIR transillumination images captured with the (e) Ge-enhanced CMOS camera [setup of Fig. 1] and (f) NIR InGaAs FPA [setup of Fig. 1]. The lesion areas appear as darker areas in the NIR images. These are best resolved in (e). The lesion areas are the dark areas in the enamel in the PLM images (c) and (d). The lesion areas are harder to resolve in the dentin using PLM, and they actually appear lighter than the sound dentin. Therefore, TMR was used to confirm the lesion depth in dentin. (Color online only.)  Fig. 4Images of one of the tooth samples with an E2 lesion. (a) Visible-light reflectance image, (b) radiograph, (c) and (d) PLM images of the sections cut along the yellow dotted lines in (a). NIR transillumination images captured with the (e) Ge-enhanced CMOS camera [setup of Fig. 1] and (f) NIR InGaAs FPA [setup of Fig. 1]. (Color online only.) 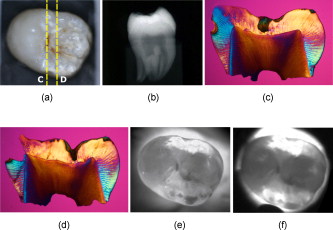 Fig. 5Images of one of the tooth samples that had a D1 lesion with extensive hypomineralization. (a) Visible-light reflectance image, (b) radiograph, (c) and (d) PLM images of the sections cut along the yellow dotted lines in (a). NIR transillumination images captured with the (e) Ge-enhanced CMOS camera [setup of Fig. 1] and (f) NIR InGaAs FPA [setup of Fig. 1]. The yellow arrows in the PLM images indicate the position of hypomineralization. (Color online only.)  Images from another tooth with less severe lesions, confined to the enamel are shown in Fig. 4. The lesions are clearly visible in the NIR images, and their position matches the PLM micrographs of the two thin sections. Figure 5 shows another tooth with lesions that penetrate to the DEJ (D1). This tooth is interesting, because in addition to the D1 lesions, large areas of the occlusal surface appear with opposite contrast, that is, they appear whiter or with higher intensity than the sound enamel areas. We have observed this phenomenon in previous transillumination images of shallow artificially demineralized areas in the occlusal surfaces,26 and from shallow developmental defects.28 The PLM micrographs show a dark (brown) band of hypomineralization near the enamel surface (see yellow arrows) with an outer layer of higher mineral content that is transparent, which is typical of mild development defects or fluorosis.28 We postulate that these areas with defects appear whiter, since the scattering of NIR photons incident at oblique angles that would normally not be emitted from those surfaces, produces an increased NIR photon flux from those surfaces. Namely, many of the NIR photons that are incident on the occlusal surface of the tooth have a high angle of incidence that would typically result in internal reflection; however, the increase in scattering at the defects localized to the enamel surface results in an increase in photon flux from those surfaces. The whiter surface also appears more opaque than the sound enamel due to that highly scattering layer. Note the difference in appearance between the outer sound part of the tooth where the sound enamel appears whiter due to directly transmitted light (saturation) and the defect areas that appear more opaque. The mean contrast values are shown for reflection and transillumination in Table 1 . These measurements were taken using the InGaAs FPA in the imaging configurations shown in Figs. 1 and 1. The lesion contrast in the NIR reflectance images did not increase significantly with lesion severity score (depth) , which was determined using PLM and TMR analysis of the histological thin sections. The lesion contrast in transillumination increased with lesion depth. The contrast of the severe D2 lesions was significantly higher than the less severe lesion groups . The mean contrast of the less severe dentinal lesions (D1) was higher than for the lesions confined to enamel (E); however, they did not break statistically . The ratio of contrast in transillumination over reflection was also calculated to determine if this value provided greater separation between the lesions. However, this parameter did not provide a significant improvement over transillumination alone. There was still a significant difference between the deep dentinal lesions (D2) and the shallower lesions , but not between enamel (E) and shallow dentinal lesions (D1) , as can be seen in Table 1. Table 1Table of values for mean contrast ratio and lesion area (transmission) ( n=47 lesions). Groups with the same depth category listed are statistically similar p> 0.05 .
The area of the lesion in both the reflectance and transillumination NIR images was also measured, and the lesion area increased with increasing lesion severity. In reflectance and transillumination, the area measurements of enamel lesions could be differentiated from those of dentinal lesions . Table 2 lists the lesion contrast values measured using the Ge-enhanced CMOS camera and the imaging setup of Fig. 1, along with those measured using the InGaAs FPA with the imaging setup of Fig. 1. The image contrast for the enamel-only lesions E1 and E2 were both significantly lower than the lesions that penetrated to dentin using the Ge-CMOS setup, although the enamel groups did not break statistically with each other. For the InGaAs FPA, E1 broke with D1 and D2, but E2 did not break statistically with either E1 or D1. However, if the enamel-only lesions are combined into one group , then group (E) does break statistically with both the D1 and D2 groups. Table 2Mean contrast ratio for Ge-CMOS and InGaAs FPA imaging systems ( n=52 lesions). Groups with the same depth category listed are statistically similar p> 0.05 . E only compared with D1 and D2. Groups sharing alphabet letters are statistically similar p> 0.05 .
A comparison of the lesion contrast measured for the two different groups of teeth using the InGaAs and Ge-CMOS imaging systems employing the same imaging setup of Fig. 1 for transmission indicates that the contrast was significantly higher for E, D1, and D2 lesions for the Ge-CMOS imaging system. A comparison between the two imaging setups for transmission, Figs. 1 and 1, indicates that the clinical imaging setup, Fig. 1, that employed two probes yielded significantly higher contrast for E, D1, and D2 lesions as well . 4.DiscussionThis study indicates that the area and contrast of occlusal lesions measured using NIR transillumination can potentially be used as an indicator of lesion severity. The decision on whether surgical intervention is necessary or more conservative chemical intervention will suffice for the treatment of occlusal lesions is a primary concern of the clinician. Penetration of the lesion deep into dentin is one key indicator for surgical intervention, and the D2 lesions are the most likely lesions to require surgical intervention, since these are the lesions least likely to be arrested by chemical intervention or fluoride treatment. The lesion contrast of the D2 lesions was significantly higher for both imaging systems than the other less severe lesions. Since lesion severity is assigned on the basis of depth, it is important to point out that in many cases there is little difference in the severity of lesions in adjoining groups. For example, a lesion that is close to the DEJ would be considered an E2 lesion, while if it touches the DEJ it is considered a D1 lesion, even if they are very similar in depth and severity. The highest contrast was achieved for the higher resolution Ge-CMOS camera with pixel pitch. It appears that the higher pixel density and larger array size of the Ge-enhanced CMOS camera provided increased contrast of the occlusal lesions. This increase in contrast was sufficient to demonstrate a significant difference in the mean contrast between the lesions confined to enamel (E) and the deeper D1 and D2 dentin lesions. Moreover, the contrast was also significantly higher for the more severe D2 lesions than the D1 lesions. The lesion contrast for the E, D1, and D2 groups also broke statistically for the lower resolution InGaAs FPA when the two-source illumination probe [Fig. 1] was used. The two-source illumination probe illuminates both facial and lingual surfaces of the tooth, producing more uniform illumination across the occlusal surface. This probe worked well in our first in vivo clinical study in which we were able to image approximal lesions from the occlusal surface using the InGaAs FPA.29 The ability to achieve uniform illumination across the occlusal surface is key for the discrimination of lesions and to avoid false positives. Another method of avoiding false positives created by the illumination geometry is to acquire images from multiple views by changing the angle of the illumination probes. In future studies we will investigate the performance of the two source probe of Fig. 1 with the Ge-CMOS camera. The Ge-CMOS camera was a prototype that was too large to be feasible for clinical use, while the InGaAs FPA system has been used for in vivo imaging. Although the NIR reflectance measurements did not exhibit higher contrast with increasing lesion depth in this study, a previous study demonstrated that NIR reflectance measurements are useful for the detection of early demineralization.26 Polarized NIR provided improved contrast over polarized visible reflectance measurements for areas of shallow demineralization on enamel surfaces. Since the contrast for transillumination is sometimes reversed for shallow demineralization or minor developmental defects (fluorosis), as demonstrated in Fig. 5, we anticipated that the combination of NIR images in transmission and reflection would provide better discrimination of lesion depth. However, that was not the case for the severe lesions investigated in this study. This approach is most likely to be successful for very shallow lesions, and we plan to further investigate this approach using different models of early demineralization. The ability to discriminate between staining and fluorosis and deeply penetrating caries lesions, as demonstrated by Fig. 5 and in prior NIR imaging studies, is an important advantage.27, 28 Most occlusal lesions are initially detected by visual staining of the fissure, and it is difficult to discriminate staining from demineralization. Previous NIR studies have demonstrated that stains are less visible in the NIR, since the organic molecules responsible for pigmentation absorb poorly in the NIR, making it easier to identify areas of demineralization.27 This should be particularly advantageous for in vivo screening for caries, since the interference from staining and hypomineralization is likely to be greatly reduced. This in vitro study demonstates that increasing lesion contrast and lesion area in NIR images corresponds with increasing depth and severity of occlusal caries lesions. The next step is to acquire in vivo NIR imaging of occlusal caries lesions, which is planned for the near future. AcknowledgmentsThe authors acknowledge the support of NIH grant R01-DE14698. The authors would like to thank Noble Peak vision for loan of the Ge-enhanced CMOS camera. ReferencesJ. Barenie, G. Leske, and L. W. Ripa,
“The use of fiber optic transillumination for the detection of proximal caries,”
Oral Surg., 36 891
–897
(1973). https://doi.org/10.1016/0030-4220(73)90342-3 Google Scholar
C. M. Pine,
“Fiber-optic transillumination (FOTI) in caries diagnosis,”
Early Detection Dental Caries, 51
–66 1996). Google Scholar
J. Peltola and J. Wolf,
“Fiber optics transillumination in caries diagnosis,”
Proc. Finn Dent. Soc., 77 240
–244
(1981). 0355-4651 Google Scholar
R. D. Holt and M. R. Azeevedo,
“Fiber Optic transillumination and radiographs in diagnosis of approximal caries in primary teeth,”
Community Dent. Health, 6 239
–247
(1989). 0265-539X Google Scholar
C. M. Mitropoulis,
“The use of fiber optic transillumination in the diagnosis of posterior approximal caries in clinical trials,”
Caries Res., 19 379
–384
(1985). https://doi.org/10.1159/000260870 0008-6568 Google Scholar
H. Hintze, A. Wenzel, B. Danielsen, and B. Nyvad,
“Reliability of visual examination, fibre-optic transillumination, and bite-wing radiography, and reproducibility of direct visual examination following tooth separation for the identification of cavitated carious lesions in contacting approximal surfaces,”
Caries Res., 32
(3), 204
–209
(1998). https://doi.org/10.1159/000016454 0008-6568 Google Scholar
A. Schneiderman, M. Elbaum, T. Schultz, S. Keem, M. Greenebaum, and J. Driller,
“Assessment of dental caries with digital imaging fiber-optic transillumination (DIFOTI): in vitro study,”
Caries Res., 31 103
–110
(1997). https://doi.org/10.1159/000262384 0008-6568 Google Scholar
M. Bin-Shuwaish, P. Yaman, J. Dennison, and G. Neiva,
“The correlation of DIFOTI to clinical and radiographic images in Class II carious lesions,”
J. Am. Dent. Assoc., 139
(10), 1374
–1381
(2008). 0002-8177 Google Scholar
D. A. Young and J. D. Featherstone,
“Digital imaging fiber-optic trans-illumination, F-speed radiographic film and depth of approximal lesions,”
J. Am. Dent. Assoc., 136
(12), 1682
–1687
(2005). 0002-8177 Google Scholar
D. A. Young,
“New caries detection technologies and modern caries management: merging the strategies,”
Gen. Dent., 50
(4), 320
–331
(2002). 0363-6771 Google Scholar
J. Yang and V. Dutra,
“Utility of radiology, laser fluorescence, and transillumination,”
Dent. Clin. North Am., 49
(4), 739
–752
(2005). https://doi.org/10.1016/j.cden.2005.05.010 0011-8532 Google Scholar
S. Keem and M. Elbaum,
“Wavelet representations for monitoring changes in teeth imaged with digital imaging fiber-optic transillumination,”
IEEE Trans. Med. Imaging, 16
(5), 653
–663
(1997). https://doi.org/10.1109/42.640756 0278-0062 Google Scholar
D. Fried, J. D. B. Featherstone, R. E. Glena, and W. Seka,
“The nature of light scattering in dental enamel and dentin at visible and near-IR wavelengths,”
Appl. Opt., 34
(7), 1278
–1285
(1995). https://doi.org/10.1364/AO.34.001278 0003-6935 Google Scholar
R. S. Jones and D. Fried,
“Attenuation of and laser light through sound dental enamel,”
Proc. SPIE, 4610 187
–190
(2002). https://doi.org/10.1117/12.469324 0277-786X Google Scholar
C. L. Darling, G. D. Huynh, and D. Fried,
“Light scattering properties of natural and artificially demineralized dental enamel at ,”
J. Biomed. Opt., 11
(3), 034023: 1
–11
(2006). https://doi.org/10.1117/1.2204603 1083-3668 Google Scholar
G. D. Huynh, C. L. Darling, and D. Fried,
“Changes in the optical properties of dental enamel at after demineralization,”
Proc. SPIE, 5313 118
–124
(2004). https://doi.org/10.1117/12.539290 0277-786X Google Scholar
C. L. Darling and D. Fried,
“Optical properties of natural caries lesions in dental enamel at ,”
Proc. SPIE, 5687 102
–110
(2005). https://doi.org/10.1117/12.604554 0277-786X Google Scholar
G. Jones, R. S. Jones, and D. Fried,
“Transillumination of interproximal caries lesions with light,”
Proc. SPIE, 5313 17
–22
(2004). https://doi.org/10.1117/12.539289 0277-786X Google Scholar
R. S. Jones, G. D. Huynh, G. C. Jones, and D. Fried,
“Near-IR transillumination at for the imaging of early dental caries,”
Opt. Express, 11
(18), 2259
–2265
(2003). https://doi.org/10.1364/OE.11.002259 1094-4087 Google Scholar
B. Angmar-Mansson and J. J. ten Bosch,
“Optical methods for the detection and quantification of caries,”
Adv. Dent. Res., 1
(1), 14
–20
(1987). 0895-9374 Google Scholar
J. J. ten Bosch, H. C. van der Mei, and P. C. F. Borsboom,
“Optical monitor of in vitro caries,”
Caries Res., 18 540
–547
(1984). https://doi.org/10.1159/000260818 0008-6568 Google Scholar
P. E. Benson, A. Ali Shah, and D. Robert Willmot,
“Polarized versus nonpolarized digital images for the measurement of demineralization surrounding orthodontic brackets,”
Angle Orthod., 78
(2), 288
–293
(2008). https://doi.org/10.2319/121306-511.1 0003-3219 Google Scholar
M. J. Everett, B. W. Colston, U. S. Sathyam, L. B. D. Silva, D. Fried, and J. D. B. Featherstone,
“Non-invasive diagnosis of early caries with polarization sensitive optical coherence tomography (PS-OCT),”
Proc. SPIE, 3593 177
–183
(1999). https://doi.org/10.1117/12.348347 0277-786X Google Scholar
D. Fried, J. Xie, S. Shafi, J. D. B. Featherstone, T. Breunig, and C. Q. Lee,
“Early detection of dental caries and lesion progression with polarization sensitive optical coherence tomography,”
J. Biomed. Opt., 7
(4), 618
–627
(2002). https://doi.org/10.1117/1.1509752 1083-3668 Google Scholar
D. Fried, J. D. B. Featherstone, C. L. Darling, R. S. Jones, P. Ngaotheppitak, and C. M. Buehler, Early Caries Imaging and Monitoring with Near-IR Light, W. B Saunders Co., Philadelphia
(2005). Google Scholar
J. I. Wu and D. Fried,
“High contrast near-infrared polarized reflectance images of demineralization on tooth buccal and occlusal surfaces at ,”
Lasers Surg. Med., 41 208
–213
(2009). https://doi.org/10.1002/lsm.20746 0196-8092 Google Scholar
C. M. Bühler, P. Ngaotheppitak, and D. Fried,
“Imaging of occlusal dental caries (decay) with near-IR light at ,”
Opt. Express, 13
(2), 573
–582
(2005). https://doi.org/10.1364/OPEX.13.000573 1094-4087 Google Scholar
K. Hirasuna, D. Fried, and C. L. Darling,
“Near-IR imaging of developmental defects in dental enamel,”
J. Biomed. Opt., 13
(4), 044011:1
–7
(2008). https://doi.org/10.1117/1.2956374 1083-3668 Google Scholar
M. Staninec, C. Lee, C. Darling, and D. Fried,
“In vivo near-IR imaging of approximal dental decay at ,”
Lasers Surg. Med., 42
(4), 292
–298
(2010). https://doi.org/10.1002/lsm.20913 0196-8092 Google Scholar
C. L. Darling, J. D. B. Featherstone, C. Q. Le, and D. Fried,
“An automated digital microradiography system for assessing tooth demineralization,”
Proc. SPIE, 7162 71620T
(2009). https://doi.org/10.1117/12.816868 0277-786X Google Scholar
|


