
|
|
1.IntroductionThis paper is a contribution to the special issue honoring Tayyaba Hasan for her significant contributions to photodynamic therapy (PDT). In the mid-1980s and early 1990s, the author had the opportunity to work with Tayyaba Hasan on the dosimetry of PDT. Those were interesting times when the dosimetry of light in tissues was first developed. Concepts of light transport now considered obvious were not so obvious then. During 1994 to 2000, the author would step into Tayyaba’s annual short course on PDT held at the SPIE Photonics West Meeting to watch her teach the class and to give a short summary of the optical dosimetry of PDT. This paper summarizes three key lessons learned during during those short courses.1 2.Lesson 1: Broad-Beam TreatmentOften a broad uniform beam of treatment light is delivered to a tissue site for the purpose of PDT. A simple description of 1-D light penetration into the tissue is appropriate,2 where (in watts per centimeters squared) is the fluence rate as a function of depth (in centimeters), (in watts per centimeters squared) is the delivered irradiance, is a backscatter term that describes how backscattered light augments the delivered to the surface to yield an elevated fluence rate near the surface, and [ ] is an apparent attenuation coefficient. When the reflectance of light by the tissue exceeds , the value of becomes equal to , where is the absorption coefficient and is the reduced scattering coefficient, in which is the scattering coefficient and is the anisotropy of scattering. As reflectance drops below 0.2 toward 0, approaches . For a red to near-infrared treatment light, reflectance usually exceeds 0.20.Figure 1 illustrates the light distribution in a generic tissue generated by Monte Carlo simulations.3 The curves of relative fluence rate, , were generated by varying the absorption coefficient (circles: , refractive index ratio ) while holding the scattering properties constant ( , ). The dashed lines are the fits to the simulated data using Eq. 1. The simulated data near the tissue surface deviate from Eq. 1, but deeper in the tissue Eq. 1 provides an accurate description of the penetrating treatment light. Not shown, but later used in Fig. 2 , are similar curves where was reduced from or , so that the ratio would drop and the reflectance would approach zero. Fig. 1One-dimensional relative fluence rate, , where (in watts per centimeters squared) is the irradiance delivered as a broad uniform beam. The dashed lines correspond to Eq. 1. The colored lines are Monte Carlo simulations, using the optical properties and such that , and varies from .  Fig. 2(a) Backscatter parameter versus diffuse reflectance . (b) The relative fluence rate, , at the tissue surface, where is the delivered irradiance, versus . (c) The ratio of attenuation coefficient to effective attenuation coefficient versus . Circles are for , with varying values, as in Fig. 1. Squares are for , not shown in Fig. 1. Lines are curve fits by equations shown in figures. 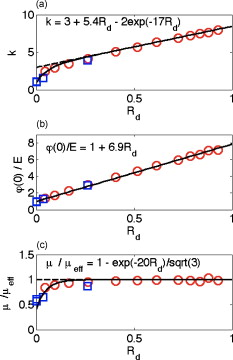 Figure 2 shows the behavior of and in Eq. 1, as applied to the data in Fig. 1. Figure 2 plots the values of versus the total diffuse reflectance . In the limit of , the value of is 1. As increases, the backscatter toward the surface increases, indicated by the steady rise in . The maximum value of is when approaches 1.0. To reach the limit of , must approach 0 while has a finite value. In this limit, all the light must eventually be reflected from the tissue although complete escape may take a long time. The photons still spend time in the tissue before escaping. Hence, the rate at which the light passes through the air/tissue interface at the tissue surface to escape as observable is also finite. In other words, fluence rate near the surface is finite. The Monte Carlo simulations indicate this limiting value for is , a value that depends on the refractive index mismatch at the tissue surface. Figure 2 plots the values of at the surface versus . The relation is linear. When is zero, . In other words, there is no augmentation of near-surface fluence rate by backscatter. As increases, the backscatter increases . Because the reflectance of red PDT treatment light by tissues is typically in the range 0.2–0.6, the value of can be 2.4-fold to 5.1-fold greater than the delivered irradiance . Figure 2 plots the values of versus . Above , equals unity; hence, . In the limit of very low , the value of approaches , and the value of is . Therefore, approaches 1/sqrt(3) as approaches zero. For PDT treatment with red to near-infrared light, exceeds 0.20 so equals or , where is the optical penetration depth. A measurement of can characterize the parameters and that specify the light dosimetry. The total diffuse reflectance can be approximated by the simple expression, This expression has the form of a simple exponential attenuation of photons that travel a pathlength within a tissue with absorption coefficient . Although the factor 8 is only an approximate value, Eq. 2 yields with a error for red to near-infrared wavelengths used for PDT. The factor 8 varies with the ratio , as has been described.4 The key lesson is that the fluence rate within the tissue near the surface, , significantly exceeds the delivered irradiance, . The light accumulates near the surface due to backscatter, which augments the fluence rate at the surface by the factor in Eq. 1. This augmentation factor k increases as increases, becoming linearly proportional to when reflectance exceeds 0.20, as is the case for PDT treatment with red to near-infrared light. The penetration of fluence rate into the tissue follows the simple exponential of Eq. 1, as if an irradiance had been delivered to the surface. The actual fluence rate at the surface, , is lower than . The deeply penetrating light for accurately follows Eq. 1. Today, this accumulation of light at a tissue surface seems rather obvious. But back in the 1980s, the idea that backscatter would augment delivered light such that the factor in Eq. 1 was was not widely appreciated. Indeed, Star and I presented an experimental demonstration at a Gordon conference on lasers in medicine and biology in the 1980s in which we placed an isotropic probe5 (see Fig. 3 ) within a beaker of milk near the front surface that was irradiated with light. We demonstrated to the audience that the fluence rate in the front surface layer of milk was threefold higher than the delivered irradiance , which surprised many in the audience. Figure 4 shows an experiment that recreated this demonstration. Fig. 3Optical fiber inserted in a turbid plastic ball ( -diam) collected light with equal efficiency from all angles. Calibration of the probe involved inserting the probe into a cuvette of water, irradiating with a known irradiance , and measuring . Then insertion in turbid medium or tissue yielded a measurement that specified the fluence rate: . (Drawing of the probe fabricated by H. Marijnissen and W. Star, Daniel Den Hoed Cancer Center, Rotterdam, who provided the probe for experiments.)  Fig. 4A fish tank was filled with clear water, and a broad collimated laser irradiated the front surface. An isotropic probe (Fig. 3) measured the fluence rate axially as the probe was moved by a screw assembly from the front to the rear of the tank. The fluence rate within the tank was uniform at value 1 (curve A). Then, milk and ink were added, and the scattering caused light to pile up near the front surface (curve B). When water replaced air in the front compartment, D, the total internal reflectance at the front surface was reduced, and the fluence rate slightly dropped (curved C). (Experiment conducted with Marleen Keijzer, Delft University, The Netherlands.)  In a similar experiment with a live mouse, conducted with Hasan, the isotropic probe was placed below the skin in the peritoneal cavity of a white mouse and a broad beam of light delivered. The was measured and the ratio was ( deviation for measurements); in other words, there was more light below the skin than was delivered to the surface. This is not a violation of conservation of energy, but simply an accumulation of delivered light near the surface layers of a tissue. A final word on the limitations of Eqs. 1, 2 is needed. The expressions for the 1-D penetration of light into tissue [Eq. 1] and the reflectance of light [Eq. 2] are based on Monte Carlo simulations, which properly handle the computation of fluence rate near the air/tissue surface boundary. The results reported here are for the case of . If the varies, then the dosimetry will also change slightly. If decreases, which would occur if a tissue were edematous, then the ratio would drop slightly and light would escape more easily from the tissue. Therefore, and would slightly drop in Eq. 1. Another issue is how a rough tissue surface will affect total internal reflectance at the air/tissue surface.6 A rough surface decreases total internal reflectance, which again would cause and to slightly drop. Another caveat is needed when the total diffuse reflectance drops below 0.25, which indicates the ratio has dropped below 10. At such low reflectance, the influence of the anisotropy of scattering becomes more important, and the simple expression of Eq. 2 becomes slightly dependent on the value of . The results reported here are for , which is appropriate for most tissues in the red to near-infrared spectrum. As drops to lower values, the value 8 in Eq. 2 drops. All these effects are minor and do not alter the usefulness of Eq. 2 or the lessons of this first section. In summary, Eqs. 1, 2 instruct regarding the general behavior of light dosimetry, but slight variations may occur. 3.Lesson 2: Beam Edge EffectsThe depth of penetration also depends on the diameter of the treatment beam. Delivered light spreads within a tissue, both along the radial direction and the depth direction . In the middle of a very broad beam of delivered light, the lateral diffusion of light from neighboring points of light injection is balanced and cancels; thus, there is no lateral variation in fluence rate. Only variation versus depth occurs, as discussed above. With a finite-diameter beam, the edge of the beam has no neighbors outside the beam, and lateral diffusion is unbalanced, and there are edge losses. The process is illustrated schematically in Fig. 5 . A finite-diameter uniform-irradiance beam (full ) is treated as the sum of two sources (black solid lines), where one source has positive uniform irradiance over a semi-infinite range in one direction, for , and a negative uniform irradiance in the other direction, for . The second source has the opposite configuration, negative to the left, for , and positive to the right, for . This model is a mathematical construct because there is no physical realization of a negative irradiance. The red dashed lines show the fluence rate in the tissue, which is subject to the lateral diffusion of light at the edges of the two sources. This can be the at the surface where exceeds , or some within the tissue. Both the and are normalized so they can be drawn as extending between . Again, this is a mathematical construct. The fluence rate is modeled as an error function: , and , where is the attenuation length equal to . The factor is a lateral position on the tissue. The total beam is the sum of the two sources, , which equals 1 within the beam and 0 outside the beam. The total fluence rate for the total beam is . For a broad beam , the central region of the beam achieves the maximum . The edge losses are far apart and do not interact, leaving a central region of maximum fluence rate. For the narrow beam, the edge losses overlap and combine to limit the fluence rate in the central region. Fig. 5Overlap of losses at the edges of a finite-diameter uniform-irradiance beam. Schematic illustration of how a finite-diameter treatment beam of uniform irradiance can be modeled as the superposition of two semi-infinite beams that vary between and , where E is the irradiance. This is a mathematical construct, because there is no physical occurrence of a negative irradiance. One beam beam (A,D) extends positively to the left. The second beam (B,E) extends positively to the right. The irradiance is portrayed as a solid black line, normalized by its maximum value, , so that the black line varies from to . The resulting fluence rate is shown as a dashed red line. This could be at the surface, which exceeds , or could be at some depth . In this figure, is normalized by its maximum value, , so that it also varies from to . Again, there is no physical negative fluence rate. The sum of the two beams, , and , yields the fluence rate that results from a finite-diameter beam. The achieves a maximum value, , in the central region when the beam is broad, and a value of 0 far outside the beam. When the beam diameter is narrow, the edge effects overlap and superimpose, which diminishes the fluence rate of the central region. (Color online only.)  Figure 6 shows Monte Carlo simulations of the depth and lateral spread of light in a generic tissue. The beam is uniform and its radius is increased from . The total beam power is kept constant at . The isofluence contours for a range of fluence rates are shown. The deepest penetration occurs with the narrowest beam because all the light is concentrated in one spot, but the light distribution is not uniform. As the beam broadens, the penetration of light decreases because the light is being spread out over the tissue. However, a central region of uniform fluence rate and penetration develops in the center of the beam, when the beam radius exceeds . Fig. 6Monte Carlo simulation of fluence rate [ (in watts per centimeters squared)] within a generic tissue, showing iso- contours versus depth and radial position , starting at , and increasing over four orders of magnitude. A treatment beam is delivered as (a) a narrow beam, (b) a -radius beam, or (c) a -radius beam. The vertical dashed lines shows the edge of the beam and the position , within which a central region of uniform occurs ( , , , , , ).  The lesson learned is that tissue optics specify the optimal size of the treatment beam to achieve a central region of uniform fluence rate within the tissue, where Eq. 1 applies. A treatment beam diameter should exceed the diameter of the target tissue by to ensure a central region of uniform light exposure at the target. The total power of the treatment light can be increased to achieve the desired fluence rate at the target depth. 4.Lesson 3: PDT DosimetryThe light dose that generates photodynamic action is described by the fluence, (in joules per centimeters squared), which equals the fluence rate (in watts per centimeters squared) times the exposure time (in seconds): . Although tissue damage by oxidation (via necrosis or apoptosis) is a stochastic event governed by the fluence, in experiments one often sees a boundary of damage, which suggests the practical concept of a threshold fluence that causes damage. Therefore, it is useful to assume a threshold radiant exposure , such that if exceeds then the PDT treatment achieves cell death either through necrosis or apoptosis, or achieves the particular endpoint of interest (see Fig. 7 ). Fig. 7Dosimetry of PDT specifies the depth of treatment, , based on Eq. 3 that relates the delivered radiant exposure (in joules per centimeters squared) and the light penetration (depends on and ) versus the threshold fluence that elicits treatment. Black circles are a Monte Carlo simulation of the fluence within the tissue. The red line is the delivered and the within the tissue [see Eq. 1]. The horizontal dashed line is the threshold . The vertical dashed line is the boundary of the depth of treatment . (Color online only.)  Similar to Eq. 1 the fluence rate drops with depth and reaches at a depth that corresponds to the margin of treatment (the subscript Rx indicates effective treatment), Rearranging Eq. 3 to solve for , Equation 4 shows that is proportional to the optical penetration depth , but the other factors are compressed by the logarithm function so their influence on is diminished. Doubling will double [actually, a little better than a twofold increase since will increase as increases so the factor comes into play]. Doubling the exposure time will only increase by the increment or . . For example, assume PDT was administered at wavelength using an irradiance that exactly matches the lethal threshold , which perhaps had been observed in cell culture studies where optical scattering is not an issue. Because in Eq. 2 exceeds 1, the light near the tissue surface will exceed . Also assume some standard optical properties for the tissue: blood volume , oxygen , water , absorption coefficient , reduced scattering coefficient . Then, Eq. 4 will yield Fig. 8 showing versus wavelength, using the expression for in Fig. 2 that uses based on Eq. 2. The for the -wavelength treatment light is . If one increases the exposure time fourfold, the Eq. 4 indicates that the treatment zone will increase to , a 1.72-fold greater zone of treatment. Now, increase the wavelength to to decrease the absorption by blood. The scattering only slightly decreases, while the increases 1.67-fold. Again deliver , using a different photosensitizer, but use the original exposure time. The new value of is also , the same as increasing the treatment time by fourfold. Increasing the optical penetration 1.67-fold was equivalent to increasing the exposure time fourfold. Fig. 8Depth of treatment, (in millimeters), as a function of wavelength. Approximate values using Eqs. 4, 2 and the expression for in Fig. 2 (optical properties and treatment parameters cited in text). A treatment using a wavelength still sees significant blood absorption. Moving to a wavelength avoids strong blood absorption and increases for .  Equation 3 can be expanded to specifically mention the factors that determine and affect dosimetry of PDT. A description of the threshold concentration of oxidizing species produced by PDT that elicits treatment, (M), includes the extinction coefficient for the photosensitizer, the concentration (M) of photosensitizer, the quantum efficiency of converting excited state photosensitizer to oxidizing species ( , which is a function of the available oxygen), and the fraction of oxidizing species that attacks sites contributing to lethality , The factors 1000 (in cubic centimeters per liter), wavelength (in centimeter), Planck’s constant (Js), and vacuum speed of light (in centimeters per second) participate in yielding units of moles per liter (M) for . Rearranging Eq. 5 to solve for and substituting the optical penetration depth for yields, All the factors commonly considered in clinical application of PDT, such as the irradiance, exposure time, concentration, and extinction coefficient of photosensitizer, are included within the argument of the logarithm function. The factors that specify are clearly seen in Eq. 6. The expression for optical penetration depth is indicating that is proportional to the geometric mean of and when , which is usually the case for red to near-infrared light. A key biological factor in determining is the blood perfusion, which can easily change by a factor of 2–4. Thus, the is strongly influenced by the degree of inflammation in a target tissue. A fourfold increase in blood perfusion would cause a fourfold increase in , which would yield more than a twofold decrease in and hence at least a halving of the depth of treatment.The key lesson from Eq. 6 is that the optical properties have a dominant effect on the PDT treatment zone. Equation 7 advises that changes in blood perfusion can strongly limit the treatment zone. The effort to find longer wavelength photosensitizers that absorb above has been driven by the desire to avoid blood absorption and increase the treatment zone. A cautionary note should be made about skin, where there may be a significantly pigmented epidermis. The melanin in the epidermis is a superficial absorber that can strongly affect the penetration of treatment light into pigmented skin. Epidermal melanin acts as a surface filter, not a volumetric absorber. Therefore, melanin presents a term , where is the volume fraction of melanosomes in the epidermis, is the absorption coefficient of the interior of a melanosome,7 and is the pathlength spent by photons in the epidermis that transmit to the underlying tissue (including photons that backscatter from the dermis, totally internally reflect at the air/skin surface, and re-enter the dermis). In other words, the apparent delivered radiant exposure is . The fluence versus depth becomes and for , Eq. 8 becomeswhich indicates that melanin content also linearly affects the treatment depth .5.DiscussionWhat aspects of these three lessons learned still hold in current research? Lesson 1 instructs that the fluence rate within a tissue significantly exceeds the delivered irradiance, usually by a factor of 2.4- to 5.1-fold. When comparing PDT effects in cells versus tissues, one must remember that the cells receive the irradiance while the superficial layers of a tissue receive . Lesson 2 instructs about the minimal width or diameter of a treatment beam to attain maximum depth of treatment, which is still pertinent to any clinical protocol involving broad beam illumination. However, the concept also extends to interstitial treatments using implanted optical fibers, whether point sources or cylindrical sources. The diffusion of light from the source again depends on . Investigators are developing protocols for interstitial placement of multiple optical fibers within a solid organ, such as the prostate,8, 9 for PDT treatments. The optical fibers that deliver light are placed in an optimal 3-D pattern to attain full coverage of the prostate volume. This work is an example of using lesson 2. Lesson 3 instructs as to the relative roles of tissue optics and the other treatment parameters involved in PDT dosimetry. The parsing of these relative roles of optics versus photosensitizer properties is inherent in the development of the concept of a PDT dose,10 which cites the number of photons absorbed by photosensitizer per gram of tissue. This dose characterizes the efficiency of a particular photosensitizer in a particular tissue. The three lessons summarized in this paper were developed by several investigative teams around the world during the early years of PDT. This author learned the lessons while addressing issues of optical dosimetry for PDT during work with Tayyaba Hasan. She has had a great influence on many young investigators, and this author was one of those who enjoyed her collaboration. The lessons remain pertinent to current implementations of PDT and illustrate the major role that tissue optics play in determining the treatment zone. ReferencesT. Hasan, Fundamentals of Photochemistry and Photodynamic Therapy, SPIE Short Course Notes, Photonics West Symposium
(2000). Google Scholar
S. L. Jacques,
“Simple optical theory for light dosimetry during PDT,”
Proc. SPIE, 1645 155
–165
(1992). https://doi.org/10.1117/12.60938 0277-786X Google Scholar
L.-H. Wang,
S. L. Jacques, and
L.-Q. Zheng,
“MCML–Monte Carlo modeling of photon transport in multi-layered tissues,”
Comput. Methods Programs Biomed., 47 131
–146
(1995). https://doi.org/10.1016/0169-2607(95)01640-F 0169-2607 Google Scholar
J. P. A. Marijnissen and
W. M. Star,
“Quantitative light dosimetry in vitro and in vivo,”
Lasers Med. Sci., 2 235
–242
(1987). https://doi.org/10.1007/BF02594166 0268-8921 Google Scholar
X. Ma,
J. Q. Lu, and
X.-H. Hu,
“Effect of surface roughness on determination of bulk tissue optical parameters,”
Opt. Lett., 28
(22), 2204
–2206
(2003). https://doi.org/10.1364/OL.28.002204 0146-9592 Google Scholar
S. L. Jacques and
D. J. McAuliffe,
“The melanosome: threshold temperature for explosive vaporization and internal absorption coefficient during pulsed laser irradiation,”
Photochem. Photobiol., 53 769
–776
(1991). 0031-8655 Google Scholar
A. Johansson,
J. Axelsson,
S. Andersson-Engels, and
J. Swartling,
“Realtime light dosimetry software tools for interstitial photodynamic therapy of the human prostate,”
Med. Phys., 34
(11), 4309
–4321
(2007). https://doi.org/10.1118/1.2790585 0094-2405 Google Scholar
S. R. Davidson,
R. A. Weersink,
M. A. Haider,
M. R. Gertner,
A. Bogaards,
D. Giewercer,
A. Scherz,
M. D. Sherar,
M. Elhilali,
J. L. Chin,
J. Trachtenberg, and
B. C. Wilson,
“Treatment planning and dose analysis for interstitial photodynamic therapy of prostate cancer,”
Phys. Med. Biol., 54
(8), 2293
–2313
(2009). https://doi.org/10.1088/0031-9155/54/8/003 0031-9155 Google Scholar
M. S. Patterson,
B. C. Wilson, and
R. Graff,
“In vivo tests of the concept of photodynamic threshold dose in normal rat liver photosensitized by aluminum chlorosulphonated phthalocyanine,”
Photochem. Photobiol., 51
(3), 343
–349
(1990). https://doi.org/10.1111/j.1751-1097.1990.tb01720.x 0031-8655 Google Scholar
|


