
|
|
1.IntroductionIt is known that the optical parameters , , and of blood depend on various physiological parameters. The frequently investigated parameters are oxygen saturation and hematocrit.1, 2, 3, 4, 5, 6 These parameters change, among other things, the concentration of the red blood cells or the absorption behavior of the hemoglobin. If these two main parameters remain constant, the parameters cell shape and volume of physiological red blood cells can cause changes in the optical properties. The variations in osmolarity not only change the shape and the volume of the cells but also the inner cell hemoglobin concentration. Due to an increase in the hemoglobin concentration, the complex refractive index increases.7 A hyperosmolar medium causes a shrinking of the cells due to water outflow, resulting in characteristically shaped cells called spinocytes. In low-osmolarity media, the cells start to swell by diffusion of water into the cell, leading to spherically formed cells, which become full to the point of bursting. Osmolarity changes can be caused as the result of diagnostic measurements in extracorporal blood circulations and during in vitro investigations on blood, e.g., immersion optical clearing.8, 9, 10 Data concerning the influence of osmolarity on the optical properties are not readily available. In this study, the influence of the osmolarity was investigated on the optical parameters of red blood cells in physio-logical saline solution. Using the integrating sphere technique combined with an inverse Monte Carlo simulation11 (iMCS), three optical parameters (absorption coefficient , scattering coefficient , and anisotropy factor ) of undiluted, flowing red blood cells (RBCs) could be determined, dependent on osmolarity in the spectral range of , including the spectral areas of high hemoglobin absorption. 2.Materials and Methods2.1.Blood PreparationTo measure native RBCs in saline solution, fresh human erythrocytes from healthy blood donors were centrifuged three times and washed with isotonic phosphate buffer ( , pH 7.4) to remove the blood plasma and free hemoglobin. RBC suspensions with a hematocrit of 42.1% were investigated. The hematocrit was determined using an RBC counter (Micros 60 OT 18, ABX Diagnostics, Montpellier, France). Osmolarity-induced changes in cell volume were measured by centrifugation of hematocrit capillaries. All samples were oxygenated in excess of 98%. The oxygen saturation was determined with a blood gas analyzer (OPTI Care, AVL Medizintechnik GmbH, Bad Homburg). A miniaturized blood circulation setup was used with a roller pump (Sorin Group, Germany) and a blood reservoir, which was continually aerated with a gas mixture of , , and . The temperature was kept constant at . The blood was gently stirred to avoid uncontrolled sedimentation or cell aggregation within the reservoir. The blood was kept flowing with a wall shear rate of at the cuvette windows by a customized turbulence-free cuvette with laminar flow and a sample thickness of . To investigate the influence of osmolarity, six different buffer solutions were prepared with osmolarities between 225 and . 2.2.Spectral MeasurementsThe diffuse reflectance , the total transmission , and the diffuse transmission of all blood samples were measured using an integrating sphere spectrometer (Perkin Elmer, Lambda 900) in the spectral range of at data intervals12 of . The experimental setup was identical to that described by Friebel 11 and enabled the measurement of macroscopic radiation distribution with an error of less than 0.1%. For calculating intrinsic optical parameters, a special high-precision iMCS program was used that takes into consideration various radiation losses.5 Hematocrit (Hct)-dependent effective phase functions for RBCs flowing with a shear rate of were evaluated previously using the double integrating sphere technique.4 No significant osmolarity dependency of the phase function, other than changes in the anisotropy factor , could be observed. Therefore, the iMCS was carried out using the Reynolds-McCormick phase function13 for Hct 42% with for all osmolarity values from . An error threshold of 0.1%, i.e., the difference between measured and simulated macroscopic radiation distribution, was used for the simulation of the intrinsic optical parameters of blood. A total of three independent measurement series was carried out for all different osmolarities. They were independently simulated, using about photons for each simulation. The standard deviation of the three measurements was 2 to 5% for , , , and as is shown in the diagrams. 3.ResultsThe optical properties of red blood cells depend on the biological variability of the size and shape of the RBCs and the hemoglobin (Hb) content. To exclude the optical influence of this biological variability of RBC samples with identical Hcts taken from different donors, all intrinsic optical parameters given in this paper are relative values related to those determined at an osmolarity of . The investigated RBC samples with RBC concentration (RBCc) of had an Hct of 42.1%, a mean corpuscular volume (MCV) of , and a mean corpuscular hemoglobin concentration (MCHC) of . An increase in osmolarity to resulted, via cell shrinking, in a reduced Hct of 37%; a decrease to resulted, via cell swelling, in an increased Hct of 45.5%. The MCV can be calculated by Hct . Changes in cell volume lead to a reciprocal change in hemoglobin concentration within the cell (MCHC) and therefore also in the refractive index.14 The changes in the relative cell volume (MCV) and the refractive index with different osmolarities are shown in Fig. 1 . Fig. 1(a) Osmolarity dependent relative mean cell volume (MCV̱rel) measured and calculated according to the empirical formula of Zhestkov 10 (circles), and (b) the mean refractive index at of the RBC dependent on osmolarity, calculated according to Ref. 14.  The measured MCV changes are in agreement with calculated values, based on a formula presented by Zhestkov 10 and measurements of Roggan 5 The swelling of the cells resulted in a higher MCV and a lower refractive index and vice versa. The refractive index was estimated using the formulas of Friebel and Meinke.14 At , for example, a refractive index of can be calculated under isotonic conditions . According to the reciprocal changes in the MCHC the refractive index decreases to at and increases to at . For comparison, effects on the absorption and scattering cross sections and the anisotropy factor were estimated from these refractive index changes via Mie theory for spheres of the same volume, which is used as a simplified RBC model. In special cases, Mie theory can also be used4, 11 to calculate absorption and scattering cross section of RBCs. It is known from recent investigations that calculation of the absorption coefficient is possible in the wavelength range , where is low, may only be estimated for highly diluted blood , and the anisotropy factor can only be predicted for diluted blood in the spectral range of low absorption. Nevertheless, Mie theory may be useful for calculating effects on the optical parameters induced by small relative volume and refractive index changes. These expected relative changes of the optical parameters at 225 and relative to were determined and averaged over all 171 wavelengths in the range . 3.1.Absorption CoefficientThe relative absorption spectra show no significant dependence on wavelength. Therefore, mean values over the whole spectrum could be established. The influence of the osmolarity on the relative absorption coefficient is shown in Fig. 2 . Fig. 2Mean values of of the spectral range of RBCs in saline solution dependent on osmolarity and values for 225 and calculated by Mie theory relative to . 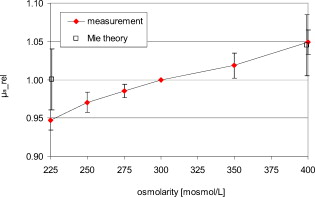 The absorption coefficient increases with increasing osmolarity. This means shrinking of the cells increases and swelling decreases . At , the value of is , and at , it is . The values calculated with Mie theory show a comparable increase to (the error describes the statistical distribution of cell volume and refractive index within the cell) at , whereas the decrease of the osmolarity to does not lead to a significant change with . 3.2.Scattering CoefficientAs observed for the absorption, of RBC solutions show no significant dependence on wavelength but are significantly influenced by changes in osmolarity. Figure 3 shows the mean relative values of dependent on osmolarity. Fig. 3Mean values of in the spectral range of RBCs in saline solution dependent on osmolarity and values for 225 and calculated by Mie theory relative to . 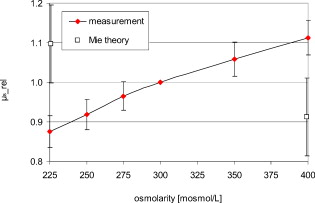 As found for , the relative scattering coefficient also increases with increasing osmolarity with values of at and at . Induced by the change in volume and refractive index, Mie theory shows an inverse change in the scattering cross section of 1.1 at and 0.9 at . 3.3.AnisotropyIn contrast to and , shows distinct wavelength dependence below . Figure 4 shows the relative values of the anisotropy factor of RBCs suspended in saline solution for different osmolarity values, dependent on wavelength. Therefore, a mean only averaged over the spectral range was calculated for each osmolarity. In addition, the osmolarity dependence at was determined to characterize the wavelength dependence in the range of high absorption. The averaged relative changes of are depicted versus the osmolarity in Fig. 5 , including at . The decrease with increasing osmolarity is more pronounced in the high absorption region of hemoglobin and has its maximum at . Fig. 5Mean values of at and of the spectral range of RBCs in saline solution dependent on osmolarity and values for 225 and calculated by Mie theory relative to .  In the wavelength range above , the mean relative value is linearly dependent on osmolarity. At , has the value , and at , only . This is within the error tolerance in the range of the values calculated with the Mie theory. As already could be observed in Fig. 4, the influence of the osmolarity on is significantly more pronounced at , where the hemoglobin absorption is high than in the wavelength region above where there is low absorption. The values for results in at and at . 3.4.Effective Scattering CoefficientCorresponding to the anisotropy factor, shows slightly different behavior below and above . Therefore mean values of in the wavelength range were calculated for the osmolarity dependence as well as for to characterize the wavelength dependence in the range of high absorption (Fig. 6 ). Fig. 6Mean values of of RBCs in saline solution in the spectral range and at dependent on osmolarity and values for 225 and calculated by Mie theory relative to . 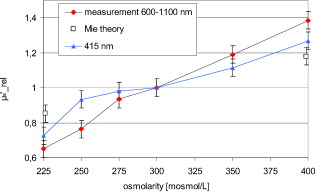 In the spectral range increases linear with increasing osmolarity. At is , twice as high as at with . At , shows a lower increase with values of at and at . The Mie theory agrees with an increase with the osmolarity but the extent of the increase is only half of that in the range with values of at and at . 4.DiscussionAll optical parameters are influenced by osmolarity changes. Moreover, dependence was found to exist between the osmolarity-dependent effects and the Hb absorption. An osmotically induced decrease in the cell volume by approx. 10% with an identical increase in Hb concentration within the cell leads to an increase in the absorption coefficient by approx. 5% and vice versa. This is, in principle, in agreement with the results of Roggan, 5 who also found a increase with increasing osmolarity at and Hct 7.5% but with a higher steepness. This may be explained by the very low Hb absorption at this wavelength and the relatively high blood dilution. At a constant RBCc, the absorption coefficient, and therefore the absorption cross section, increases continuously with the osmolarity, i.e., cell shrinking leads to an increase of , cell swelling to a decrease. According to this, the absorption cross section is mainly determined by the Hb concentration, which changes inversely to the cell volume and determines the complex refractive index within the cell, whereas the geometric cross section of the cells is of minor importance. This is partly confirmed by Mie theory, predicting a comparable increase of the absorption cross section at the increasing imaginary and real parts of the refractive index within the cell by decreasing volume. However, the Mie theory does not show a decrease of the absorption cross section for a decreasing refractive index. Averaged over the investigated spectral range, the increase in the refractive index induced by osmotic cell shrinking leads to an increase of the scattering coefficient for increasing osmolarity, in spite of the decreased geometric cross section and vice versa. In principle, this dependence is in agreement with the theoretical results of Bashkatov 8 using Mie theory and quantifier of the scattering cross section by the often used9, 15, 16 “packing factor” 1-(Hct/100%). He showed that increasing the osmolarity from resulted in an increase of for seven investigated wavelengths in the range , with the exception of , where decreased slightly. A linear interpolation of the relative increase at an osmolarity increase from averaged over all seven wavelengths resulted in a relative increase of approximately 3%. This indicates an attenuated dependence and is in contradiction to the presented Mie calculations based on our own refractive index measurements.7, 14 Following this theory, the scattering cross section of a sphere is determined mainly by the sphere size and the difference in the refractive indices and predicts a decrease of the scattering cross section with increasing osmolarity and vice versa. As shown in experiments for the hematocrit dependence of the scattering coefficient,4, 11 the scattering cross section per cell is not constant at increasing Hct, but continuously decreasing. The cause of this phenomenon is the decreasing distance between the cells, leading to an increasing superposition and interference of the single scattering events17 (“collective scattering”) The osmolarity-induced change in Hct influences analogously the distance between the cells, not by changing the cell concentration, but the cell volume. Based on these data, an interpolation of the relative scattering cross section per cell for the osmotically changed Hct values 37 and 45.5% leads, without consideration of the refractive index change within the cell, to a scattering cross section decrease to 0.92 at and an increase to 1.12 at . The correction of the calculated relative changes with values of at and at leads to an almost complete compensation of the changes predicted by Mie theory without correction. Within the error tolerances, the corrected values are comparable to the results of Bashkatov but still disagree with the experimentally determined distinct increase of with increasing osmolarity. Therefore, the change of the cell shape must be considered, which is not considered by the Mie theory. It is possibly the change in cell shape from the sphere via the normal discoid shape to the star-shaped spinocyte shape that leads to an additional increase in the scattering cross section. The inverse dependence of on osmolarity presented by Roggan 5 can be explained by the use of another scattering phase function in the MCS used, since in combination with the lower increase of with osmolarity, the changes in the resulting effective scattering coefficient are comparable to the osmotically induced changes already presented. In spectral ranges where the absorption is low, the anisotropy factor seems to be mainly determined by the difference between the real parts of the refractive index within the cell and in the surrounding medium. An osmolarity-induced decrease in volume by approx. 12 to 13% leads11 via refractive index increase to a decrease in of approx. 0.01 at wavelengths . In principle, this is in agreement with the theoretical results of Bashkatov, 8 who also found that decreased with increasing osmolarity from , but by much lower relative values between 0.001 and 0.002. Similar to these values, our own calculated theoretical values of at in the wavelength range above are lower than the measured values but with overlapping error tolerances. However, Mie theory fails to describe the strong osmolarity-dependent decrease of at . This osmolarity dependence seems to increase significantly with the absorption. Induced by this phenomenon of swelling of the RBCs to a spherical shape, the marked decrease of with increasing absorption, which was shown to be not explainable by Mie theory,4, 11 will be diminished. Possibly, this absorption-dependent decrease of is connected to the nonspherical shape of the erythrocyte. The relative changes in the effective scattering coefficient for the wavelength range are qualitatively in agreement with the predictions of Mie theory. However, the increase when the osmolarity increases is underestimated by Mie theory. When correcting the values with the Hct-dependent scattering cross section, as was already done for the scattering coefficient, the predicted relative osmolarity-induced changes in are with values of 0.75 at and 1.3 at within the error tolerances of the measured values. This may be also connected with the changes in the geometric shape. According to this, the ideal spherical shape may result in a lower effective scattering effect compared to the discoid erythrocyte shape; deformation in the direction of a spinocyte would increase the effective scattering effect. 5.ConclusionThe investigation on osmolarity-dependent optical effects of RBCs showed that changes in cell volume and shape and the inversely related Hb concentration lead to significant changes in all the optical parameters. The maximal absorption and scattering cross sections were found for shrunken RBCs. For the anisotropy as well as for the effective scattering coefficient it was found that the osmolarity-dependent effects are different in wavelength ranges of high and low Hb absorption. Apart from concentration- and absorption-induced changes in optical parameters due to Hct and oxygen saturation changes, the optical parameters can be drastically influenced by cell volume and cell shape changes due to osmolarity variations. Therefore, osmolarity-induced changes must be considered when optical measurements for the determination of blood properties are used.18 AcknowledgmentsThis work was supported by the Federal Ministry of Education and Research (Grant No. 13N7522). The authors also wish to thank the Sorin Group Deutschland GmbH, Munich, for placing the equipment at our disposal. The blood bags were kindly provided by the Department of Transfusion Medicine, Charité-Universitätsmedizin Berlin, Germany. ReferencesD. J. Faber,
M. C. Aalders,
E. G. Mik,
B. A. Hooper,
M. J. van Gemert, and
T. G. van Leeuwen,
“Oxygen saturation-dependent absorption and scattering of blood,”
Phys. Rev. Lett., 93 028102
(2004). https://doi.org/10.1103/PhysRevLett.93.028102 0031-9007 Google Scholar
M. Friebel,
J. Helfmann,
U. Netz, and
M. Meinke,
“Influence of oxygen saturation on the optical scattering properties of human red blood cells in the spectral range ,”
J. Biomed. Opt., 14 034001
(2009). https://doi.org/10.1117/1.3127200 1083-3668 Google Scholar
L. G. Lindberg and
P. A. Oberg,
“Optical-properties of blood in motion,”
Opt. Eng., 32 253
–257
(1993). https://doi.org/10.1117/12.60688 0091-3286 Google Scholar
M. Meinke,
G. Müller,
J. Helfmann, and
M. Friebel,
“Empirical model functions to calculate hematocrit-dependent optical properties of human blood,”
Appl. Opt., 46 1742
–1753
(2007). https://doi.org/10.1364/AO.46.001742 0003-6935 Google Scholar
A. Roggan,
M. Friebel,
K. Dörschel,
A. Hahn, and
G. Müller,
“Optical properties of circulating human blood in the wavelength range ,”
J. Biomed. Opt., 4 36
–46
(1999). https://doi.org/10.1117/1.429919 1083-3668 Google Scholar
A. Yaroslavsky,
I. Yaroslavsky,
T. Goldbach, and
H. Schwarzmaier,
“The optical properties of blood in the near infrared spectral range,”
Proc. SPIE, 2678 314
–324
(1996). https://doi.org/10.1117/12.239516 0277-786X Google Scholar
M. Friebel and
M. Meinke,
“Determination of the complex refractive index of highly concentrated hemoglobin solutions using transmittance and reflectance measurements,”
J. Biomed. Opt., 10 064019
(2005). https://doi.org/10.1117/1.2138027 1083-3668 Google Scholar
A. N. Bashkatov,
D. M. Zhestkov,
E. A. Genina, and
V. V. Tuchin,
“Immersion clearing of human blood in the visible and near-infrared spectral regions,”
Opt. Spectrosc., 98 638
–646
(2005). https://doi.org/10.1134/1.1914906 0030-400X Google Scholar
V. V. Tuchin,
D. M. Zhestkov,
A. N. Bashkatov, and
E. A. Genina,
“Theoretical study of immersion optical clearing of blood in vessels at local hemolysis,”
Opt. Express, 12 2966
–2971
(2004). https://doi.org/10.1364/OPEX.12.002966 1094-4087 Google Scholar
D. M. Zhestkov,
A. N. Bashkatov,
E. A. Genina, and
V. V. Tuchin,
“Influence of clearing solutions osmolarity on the optical properties of RBC,”
Proc. SPIE, 5474 321
–330
(2004). https://doi.org/10.1117/12.578999 0277-786X Google Scholar
M. Friebel,
A. Roggan,
G. Müller, and
M. Meinke,
“Determination of optical properties of human blood in the spectral range using Monte Carlo simulations with hematocrit-dependent effective scattering phase functions,”
J. Biomed. Opt., 11 34021
(2006). https://doi.org/10.1117/1.2203659 1083-3668 Google Scholar
M. Meinke,
I. Gersonde,
M. Friebel,
J. Helfmann, and
G. Müller,
“Chemometric determination of blood parameters using visible-near-infrared spectra,”
Appl. Spectrosc., 59 826
–835
(2005). https://doi.org/10.1366/0003702054280603 0003-7028 Google Scholar
L. Reynolds and
N. McCormick,
“Approximate two-parameter phase function for light scattering,”
J. Opt. Soc. Am., 70 1206
–1212
(1980). https://doi.org/10.1364/JOSA.70.001206 0030-3941 Google Scholar
M. Friebel and
M. Meinke,
“Model function to calculate the refractive index of native hemoglobin in the wavelength range of dependent on concentration,”
Appl. Opt., 45 2838
–2842
(2006). https://doi.org/10.1364/AO.45.002838 0003-6935 Google Scholar
V. S. Lee and
L. Tarassenko,
“Absorption and multiple-scattering by suspensions of aligned red-blood-cells,”
J. Opt. Soc. Am. A Opt. Image Sci. Vis, 8 1135
–1141
(1991). https://doi.org/10.1364/JOSAA.8.001135 1084-7529 Google Scholar
A. Yaroslavsky,
A. V. Priezzhev,
J. Rodriguez,
I. Yaroslavsky, and
H. Battarbie,
“Optics of blood,”
Handbook of Optical Biomedical Diagnostics, 169
–216 SPIE Optical Engineering Press, Bellingham, WA
(2002). Google Scholar
A. M. K. Enejder,
J. Swartling,
P. Aruna, and
S. Andersson-Engels,
“Influence of cell shape and aggregate formation on the optical properties of flowing whole blood,”
Appl. Opt., 42 1384
–1394
(2003). https://doi.org/10.1364/AO.42.001384 0003-6935 Google Scholar
L. D. Shvartsman and
I. Fine,
“Optical transmission of blood: effect of erythrocyte aggregation,”
IEEE Trans. Biomed. Eng., 50 1026
–1033
(2003). https://doi.org/10.1109/TBME.2003.814532 0018-9294 Google Scholar
|


