|
|
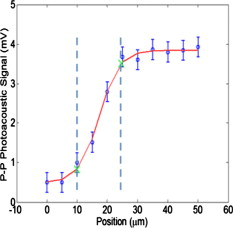
1.IntroductionDuring the last decade, remarkable progress has been made in the area of photoacoustic imaging and its biomedical applications. This is due to the demand for safe, high-contrast, and high spatial resolution techniques for the early diagnosis and monitoring of disease. Photoacoustic imaging uses nonionizing waves, which pose no health hazard, compared with ionizing x-ray radiation. Moreover, photoacoustic imaging presents advantages over traditional pure optical and ultrasound imaging techniques. Several groups have developed photoacoustic imaging technologies in different forms.1 Photoacoustic tomography (PAT) has shown potential to generate images with optical contrast and ultrasonic spatial resolution at significant tissue depths.2, 3 Maslov 4 and Zhang 5 demonstrated dark-field photoacoustic microscopy (PAM), where high-contrast photoacoustic images were produced by raster-scanning a light delivery and acoustic detection probe mechanically. Advances in PAM and PAT technology include optical detection of photoacoustic signals,6 and the use of ultrasound arrays to improve imaging speed,7 among others. Due to optical contrast, photoacoustic imaging offers considerable opportunities for functional and molecular imaging, including imaging of blood oxygen saturation, imaging of gene expression, and imaging of contrast agents and optically absorbing nanoparticles.8 In PAM and PAT, the lateral spatial resolution is determined by the ultrasonic focal width, while the axial spatial resolution is determined primarily by the transducer receiving bandwidth. Recently, a paradigm shift in photoacoustics has abandoned probing deep tissues in favor of pushing the limits of spatial resolution. In this vein, Maslov 9 demonstrated optical-resolution photoacoustic microscopy (OR-PAM), where lateral spatial resolution is determined by the size of a focused light spot rather than the width of the ultrasonic focal zone. Because optical focusing is required, the technique is suitable only in the quasi-ballistic regime (to depths of in tissue). Xie 10 extended the pioneering work of the L. V. Wang group to introduce laser-scanning optical-resolution photoacoustic microscopy. A fast-scanning mirror was used to scan the optical spot relative to a fixed ultrasound transducer. OR-PAM has been demonstrated to probe tissue microvasculature and function down to the single capillary level. Because scanning of an optically focused laser spot is required, the imaging speed of OR-PAM is limited by laser pulse-repetition rate. Present flashlamp-pumped laser systems offer repetition rates of , while diode-pumped solid-state Q-switched lasers can provide kHz-level repetition rates. These repetition rates are inadequate for real-time frame rates, which are desirable for clinical applications. Unfortunately, lasers with high repetition rates and suitable pulse durations and energies are not widely available and can be cost-prohibitive and bulky. To solve this problem, we are developing high repetition rate, inexpensive, compact laser sources for realizing high frame rate photoacoustic imaging. We present experimental data to demonstrate the feasibility of performing high frame rate OR-PAM with two novel laser sources: a microchip laser ( repetition rate) and a passively Q-switched fiber laser ( repetition rate).11, 12 The novel contributions of this paper include first, a unique light delivery probe design with high optical and acoustic efficiency for OR-PAM, and second, demonstration of a custom microchip laser for optical resolution photoacoustic imaging. In conference papers, our group and Billeh 13 recently demonstrated microchip lasers for use in photoacoustic imaging. Billeh 13 also used supercontinuum generation from nonlinear photonic crystal fibers to demonstrate wavelength-tunable photoacoustic imaging. Their work, however, did not quantify spatial resolution and did not demonstrate imaging in optically turbid media. In this article, we demonstrate a custom microchip laser-based OR-PAM system and quantify imaging spatial resolution in optically turbid media. Third, we demonstrate for the first time to our knowledge use of a passively Q-switched fiber laser for use in OR-PAM. The microchip and fiber lasers discussed here are quite inexpensive compared to many competing laser architectures and could be developed into highly compact and rugged systems, offering the advantage of fiber coupling. We demonstrate that such lasers have the potential to enable real-time OR-PAM, which could open doors to many significant clinical and biological applications. 2.Methods2.1.Probe DesignA low-loss light delivery and ultrasound detection system is required to enable detection of weak phtotoacoustic signals. In 2008, Maslov 9 presented a probe with two prisms. This probe successfully achieved focusing gain, minimal path length in water/tissue, and negligible acoustic attenuation in fused quartz. However, owing to acoustic impedance mismatch, acoustic losses at water-fused quartz interfaces can be high. Additionally, since longitudinal waves are converted to shear waves at liquid–solid interfaces, wave-mode conversion at a prism–fluid interface produces further losses. In 2009, Z. Xie, 10 designed a probe technique that enabled laser scanning in a photoacoustic microscopy system. They used an unfocused transducer obliquely positioned to receive photoacoustic signals. As a result of the long path length in water and the lack of any focal gain, the acoustic and diffractive losses are not negligible, and a low-frequency transducer was used, which results in a sacrifice in depth resolution. In this study, we designed a unique probe with minimal loss, which is illustrated in Fig. 1 . This probe is somewhat similar to the light delivery system described by Maslov 9 and is adapted from our previous work.14 Our ultrasound transducer faces an oblique fused silica prism such that photoacoustic signals directed upward to the prism’s diagonal will be deflected to the transducer.14 Figure 1 presents the calculation of acoustic reflectivity of prism versus incident acoustic signal angle. The calculation result shows the reflectivity is almost 100% for incident acoustic signal angles within . (the angular acceptance angles of the transducer). Therefore, all of the acoustic energy is preserved at the prism interface. In our design, optical index-matching fluid (Catalog No. 19569, Cargille Labs, Cedar Grove, New Jersey) is used as ultrasonic coupling, and hence allows for top-down laser illumination to be directed to the tissue surface without optical refractive path variation. The loss caused by acoustic attenuation in index-matching fluid is only slightly more than water.14 Our probe therefore exhibits minimal loss, which will be critical for sensitive photoacoustic imaging. Fig. 1(a) Minimal-loss probe design (OL: objective lens; P: prism; IMF: index-matching fluid; UST: ultrasound transducer; M: -thick Saran Wrap membrane; F: focal point of both light and ultrasound). Ultrasound transducer faces a downfacing optical prism such that photoacoustic signals directed upward to the prism’s diagonal will be deflected to the transducer. An optical index-matching fluid ensures that light can be focused without refraction at the prism’s diagonal interface and provides a low acoustic loss medium for acoustic signal propagation. (b) Computed curve of acoustic power reflection coefficient (i.e., fraction of incident power reflected) versus incident angle of ultrasound signal on prism. This calculation was made using the acoustic impedances of the fused silica and index-matching fluid media, as based on the speed of sound in, and density of, these materials. Vertical dashed lines represent the acceptance angles of our transducer (about the optical or acoustic axis). 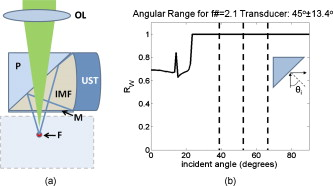 In our probe design, to focus the light to a diffraction-limited spot, we need to consider the optical aberration, especially due to the prism and matching fluid. In this study, we used the ray-tracing software Beam4 (Stellar Software, Inc., Berkley, California) to analyze the beam waist as it is focused through a slab (modeling the prism and index fluid). In Fig. 2 , the plot based on the Beam4 data is shown for a doublet lens ( at ). While the input beam diameter to the lens increases, aberrations due to the prism-fluid layer become cubically worse, as measured by the full-width-half-maximum spot size of the beam at the focal waist (dashed line). On the other hand, in a diffraction-limited system without aberrations, the focal spot size decreases with increasing numerical aperture (or input beam diameter), as shown by the solid curve. Diffraction-limited performance may be nearly achieved in the neighborhood of the intersection of these curves. Fig. 2To study the effects of the prism-index-fluid layer of Fig. 1 on the potential optical focusing power of the system, we performed a ray-tracing simulation. We simulated a doublet lens ( , ) focusing a top-hat beam through a prism-index-fluid slab with air between the lens and the slab. The dashed curve is the spot size at the focus versus input beam diameter. The solid curve represents the spot size possible according to diffraction theory if no aberrating layer were present. The intersection of the curves represents a region where diffraction-limited performance is possible. 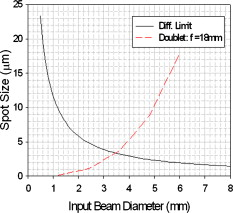 2.2.Experimental Setup with Microchip LaserThe experimental setup for the photoacoustic imaging system employing our microchip laser is illustrated in Fig. 3 . The output mode diameter of the pump laser was . Lens 1 was used for pump collimation. The collimated pump light was focused onto the Nd: Cr: YAG microchip, which includes the gain medium and saturable absorber (SA) using lens 2 . A long-pass filter 1 was used to block the pump light, while lenses 3 and 4 were used to focus the laser onto a potassium titanium oxide phosphate (KTP) frequency-doubling crystal. The KTP crystal produces a green wavelength output, along with residual fundamental light. This wavelength exhibits strong hemoglobin absorption contrast. Although we did not need it for our imaging experiments, we demonstrated amplification of the microchip laser pulses to using a large mode-area Yb-doped fiber amplifier. The pulse repetition rate was determined by the power of the microchip laser pump source at and may exceed . After collimating the output light from the KTP frequency doubling crystal by lens 5 , a glass slide was used to reflect a fraction of the light onto a photodiode, which was connected to an oscilloscope (DPO 7054, Digital Phosphor Oscilloscope, Tektronix) as a trigger signal input. Filter 2 was inserted before the scanning mirror system to block incident light at . The scanning mirror system (6230H, Cambridge Technology, Inc.) is driven by a function generator (AFG3101, Tektronix, Inc.). It can reach at mechanical angles of , although we used much lower rates for our experiments at this time to ensure dense sampling. An objective lens ( , , K16033703, Mitutoyo Co.) was used to focus light through the prism and index-fluid and was positioned away from the scanning mirrors. The minimal-loss probe with a ultrasound transducer ( , active element, CD International, Inc.) was used for photoacoustic signal detection. The photoacoustic signals were amplified by using an ultrasound pulse-receiver (5900PR, Olympus NDT, Inc.). The signals from the photodiode and ultrasound pulse-receiver and the position-feedback signals from the scanning mirror system were recorded by the oscilloscope. The data acquired by the oscilloscope were analyzed by a MATLAB program (Mathworks, Inc.). Because the pulse-repetition intervals of the passively Q-switched lasers are somewhat variable, it is important to know where each laser pulse occurs relative to the scanning mirror motion trajectory. To form an image, we register the position of photoacoustic A-scan lines based on the time-location of photo-diode-recorded laser pulses relative to the mirror position-feedback signals. A calibration curve relating laser-spot location and mirror position (assessed by the feedback signal, which is a function of voltage) is formed by stepping the mirror angle to several fixed intervals and then using a micron-precision translation stage to move the position of a carbon-fiber target to the light spot to maximize the photoacoustic signal. Figure 3 shows a photograph of the scanning mirror, objective lens, and probe. Fig. 3(a) Experimental setup for the photoacoustic imaging system employing our microchip laser (ML: microchip laser; DL: diode pump laser; L1: lens; L2: lens; A: Nd:Cr:YAG microchip; F1: long-pass filter blocking pump light; L3: lens; M: mirror; L4: lens; KTP: KTP frequency-doubling crystal; L5: lens; G: glass; PD: photodiode; F2: short-pass filter blocking light; SM: scanning mirror; OL: objective lens; Pr: imaging probe; UST: ultrasound transducer). A diode-pumped Nd: Cr: YAG micro-chip laser is frequency-doubled by a KTP frequency-doubling crystal to output. (b) Photograph of the fast-scanning mirror, objective lens, and imaging probe. 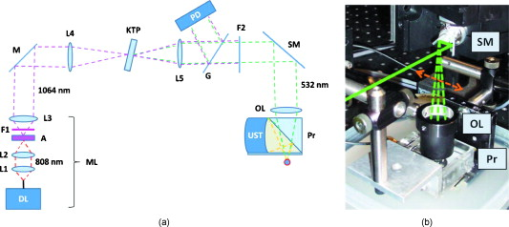 2.3.Passively Q-Switched Fiber Laser Experimental SetupFigure 4 shows the experimental setup for the photoacoustic imaging system employing a novel passively Q-switched fiber laser. As described in previous work by Pan, 12 the active medium in our fiber laser was a Yb-doped single-mode double-clad (SM DC) fiber with core and inner cladding diameters of 6 and and core and inner cladding numerical apertures of 0.15 and 0.46, respectively. In our study, however, the length of Yb-doped SM DC fiber was around instead of as in previous work, which resulted in a slightly longer pulse duration of . The pump light from the fiber-coupled diode pump laser ( maximum output power) was coupled to the Yb fiber by dichroic mirror 1 with 96% transmission at and 99% reflectance at . The SA used in this experiment was a Cr:YAG crystal with transmission of 30% at . One broadband high-reflectance dielectric mirror and the perpendicularly cleaved fiber end face of the laser medium composed a laser resonator. The other end of the fiber was angle cleaved to avoid feedback. Lens 1 was used for pump light collimation. Lens 2 was used to couple the pump light into the active medium. Lens 3 was a collimation lens at the other end of the fiber. Lens 4 and lens 5 were used to focus the laser onto the SA. In our experiment, as shown in Fig. 4, the output pulses reflected from the dichroic mirror were frequency-doubled with a KTP crystal. Lens 6 was used to focus the laser onto the KTP crystal. Before collimating the output light from the KTP crystal by lens 7 , dichroic mirror 2 was inserted to transmit and reflect light. The light was detected by a photodiode, which was connected to an oscilloscope for trigger signal input. The pulse-repetition rate was determined by the power of the fiber laser pump source at and was for coupled pump power in our experiments. Repetition rates from this laser system up to are demonstrated in Ref. 12. Figure 4 shows the fiber laser signal. The minimal-loss probe with a ultrasound transducer was used for photoacoustic signal detection. Fig. 4(a) Experimental setup for the photoacoustic imaging system employing a fiber laser (PL: pump laser; Fb: fiber; L1: lens; DM1: dichroic mirror reflecting light; L2: lens; DF: Yb-doped single mode fiber; L3: lens; L4: lens; SA: saturable absorber; L5: lens; HRM: high-reflectivity mirror; L6: lens; KTP: KTP frequency-doubling crystal; DM2: dichroic mirror reflecting light, L7: lens; SM: scanning mirror; OL: objective lens; Pr: imaging probe; UST: ultrasound transducer). A Yb-doped fiber of mode diameter with an external saturable absorber is pumped by a diode laser. The output pulses are coupled out of the laser using a dichroic mirror and then frequency-doubled with a KTP crystal. The minimal-loss probe with a ultrasound transducer was used for photoacoustic signal detection. (b) Fiber laser signals as measured by a fast photodiode and oscilloscope: pulse duration, repetition rate. 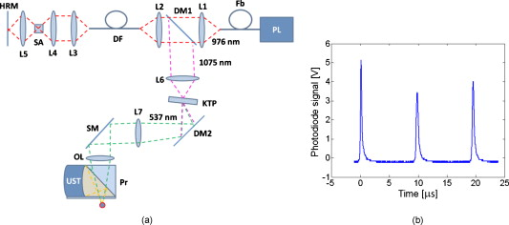 3.Results3.1.Microchip Laser Experimental ResultsWithout a fiber-amplifier stage, the microchip laser produced , , laser pulses with repetition rate at pump power. After frequency doubling and filtering, we obtained , , laser pulses, measured after the scanning mirrors and before the objective lens. With our objective lens, the calculated light spot size at the focus is . A phantom study was performed using carbon fiber targets positioned below the probe membrane. To mimic the turbid medium of human tissue (which has a reduced scattering coefficient of around ) at imaging depths, a solution of Intralipid was created with to be used at the depth. This solution was based on a reference Intralipid concentration of 20% with measured of . Oblique-incidence reflectometry was used to perform this scattering measurement.15 It can be seen from Fig. 5 that the measured photoacoustic signal amplitudes were around , , and , in clear water, turbid media with , and turbid media with , respectively. Photoacoustic signal FWHMs (full width at half maximums) were , , and in the aforementioned media. The mean photoacoustic signal FWHM in our study (for media ranging from water to turbid media with up to ) is . The measured widths of curves shown in Fig. 5 are partly due to the width of the carbon fibers themselves. To estimate the true optical resolution, we computed the convolution of a 2-D Gaussian beam with a carbon fiber (simulated as a 2-D rectangular absorption region). We plot the true FWHM of the Gaussian beam versus the FWHM of the convolution result in Fig. 6 , which shows that the corresponding lateral Gaussian probe spot resolution is , which is within error of the predicted spot size of . Fig. 5Photoacoustic signals (circles) at depth below the probe membrane with Gaussian fits (lines) (a) in clear water, , ; (b) in turbid medium with , , ; and (c) in turbid medium with , , . 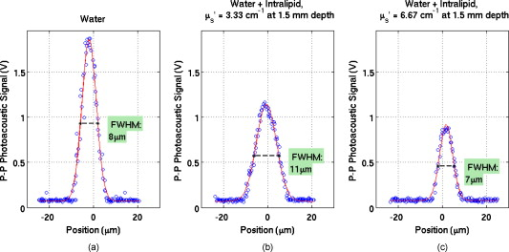 Fig. 6Optical resolution as a function of full width at half maximum (FWHM) of measured photoacoustic signal. This plot was generated by taking the convolution of a 2-D Gaussian with a rectangle (simulating the beam spot and carbon fiber, respectively). The photoacoustic FWHM is larger than the corresponding beam FWHM due to the nonzero width of the carbon fiber targets; the true optical resolution of the system is found to be for the measured photoacoustic FWHM of . 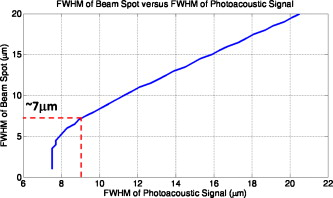 3.2.Fiber Laser Experimental ResultsIn our study, the passively Q-switched fiber laser produced , , laser pulses with repetition rates at coupled pump power. The output mode diameter of the single-mode Ytterbium-doped fiber is around . After intentional attenuation (via a neutral density filter) and measuring before the objective lens, we obtain a mere , pulse of laser light. Using an objective lens , the calculated light spot size at the focus is for the fiber laser system. Due to lower peak power, the signal-to-noise ratio of the photoacoustic signals was lower for the fiber laser than for the microchip laser, and hence we chose to use an edge-spread target, since more samples could be obtained than from the carbon fiber target. To measure the resolution of the system, we plot the edge-spread function of the photoacoustic signal, shown in Fig. 7 , as the optical spot is scanned relative to a graphite foil sample. From the plot, we can see that the photoacoustic resolution is , which is significantly better than the ultrasonic lateral resolution of . Measurements were performed in both water and Intralipid with similar resolution results; however, the results acquired in water are much less noisy and are those displayed in Fig. 7. 4.DiscussionIn our experiments with the microchip laser system, the mean spot size on the carbon fiber targets is . With this spot size and pulses, the predicted fluence is , which is comparable to that found in other OR-PAM experiments,9, 10 but above the ANSI limit for laser exposure to human skin. In our experiments with the fiber laser system, the photoacoustic resolution is . This corresponds to a fluence of roughly , which is the ANSI limit for pulsed laser exposure to human skin. As demonstrated with the preceding two laser systems, lower fluences can be used at the expense of signal-to-noise ratio. Disadvantages of the laser systems used here include the low pulse repetition rate of the microchip laser and the variable pulse energy of the fiber laser. The microchip laser repetition rate of around may limit its application for real-time imaging. However, the repetition rate can be improved by increasing pump power or utilizing prepumping and longitudinal mode control.16 Use of polarization maintaining doped fibers could improve pulse-to-pulse energy stability and improve frequency-doubling efficiency for the fiber laser; our fiber laser system did not use polarization maintaining fibers, principally to minimize cost. One disadvantage present in both the laser systems is irregular pulse repetition intervals, which is a consequence of passive Q-switching. This could be problematic in cases where synchronization of the laser pulse-repetition clock and the clock of the data acquisition system with minimum jitter is required, such as with photoacoustic flow imaging. It should not be a significant problem for most photoacoustic imaging applications, however, as data acquisition is typically triggered off photodiode signals. The fiber laser–based OR-PAM system displayed poor photoacoustic signal-to-noise ratio, making it necessary to use time-averaging when recording data; this is undesirable for real-time imaging purposes. In addition to lower peak power compared to the microchip laser, one possible cause of the weak photoacoustic signals is that the pulse width of the fiber laser may violate thermal and stress-confinement conditions for efficient photoacoustic signal generation. Additionally, the excitation due to such long pulses may produce photoacoustic signals with frequency characteristics that are too low for our present transducer. (The equivalent bandwidth of the pulse-width is .) Therefore, it may be advantageous to use a lower frequency transducer, which could improve signal-to-noise at the expense of axial resolution. This trade-off may be tolerable, since the depth-of-field of the optical focus can potentially be made very tight so that axial resolution is optically defined rather than acoustically defined. Future work may build on recent developments in exploiting distributed stimulated Brillouin scattering to produce subnanosecond pulses,17 or may use seeding pulses from diode-laser sources. 5.ConclusionIn our studies on photoacoustic imaging systems with a microchip laser and a fiber laser, we have demonstrated (1) a unique probe design with minimal loss; (2) a unique microchip laser that is highly compact and potentially inexpensive; (3) a fiber laser that is also potentially inexpensive and should offer considerable advantages due to fiber coupling. The microchip laser’s repetition rate is around and can be increased to at the expense of pulse energy, while the passively Q-switched fiber laser’s repetition rate can range between , which is the suitable range for real-time OR-PAM imaging. (For a -by- imaging area scanned with a lateral resolution of and a real-time scanning rate of 30 frames per second, a laser pulse repetition rate of is required.) Both laser systems can potentially be miniaturized to a shoe-box size apparatus. The preceding photoacoustic systems present optically defined lateral resolution of around and , respectively, which is over 33 times higher than that of ultrasound resolution. All these results show that these systems have adequate laser parameters in terms of energy, spatial resolution, and repetition rate to be used for real-time optical resolution photoacoustic microscopy. AcknowledgementsWe acknowledge support from MPB Technologies, Inc.; NSERC (Discovery Grant G121211115); Terry-Fox Foundation (New Investigator Research and Equipment Grants, via the Canadian Cancer Society: NCIC TFF eq019240, NCIC TFF res019237); the Alberta Cancer Board (ACB 23728); the Canada Foundation for Innovation, Leaders Opportunity Fund; Alberta Advanced Education & Technology, Small Equipment Grants Program; Microsystems Technology Research Initiative (MSTRI); and University of Alberta Startup Funds. R. Fedosejevs is an MPBT/NSERC Industrial Research Chair and acknowledges support from both MPBT and NSERC. We also acknowledge iCORE, Alberta Ingenuity, and Alberta Advanced Education & Technology scholarships for graduate and undergraduate students. ReferencesL. V. Wang, Photoacoustic Imaging and Spectroscopy,
(2009) Google Scholar
G. Ku and
L. V. Wang,
“Deeply penetrating photoacoustic tomography in biological tissues enhanced with an optical contrast agent,”
Opt. Express, 30
(5), 507
–509
(2005). 1094-4087 Google Scholar
S. A. Ermilov,
T. Khamapirad,
A. Conjusteau,
M. H. Leonard, and
R. Lacewell,
“Laser optoacoustic imaging system for detection of breast cancer,”
J. Biomed. Opt., 14
(2), 024007
(2009). https://doi.org/10.1117/1.3086616 1083-3668 Google Scholar
K. Maslov,
G. Stoica, and
L. H. V. Wang,
“In vivo dark-field reflection-mode photoacoustic microscopy,”
Opt. Lett., 30 625
–627
(2005). https://doi.org/10.1364/OL.30.000625 0146-9592 Google Scholar
H. F. Zhang,
K. Maslov,
G. Stoica, and
L. H. V. Wang,
“Functional photoacoustic microscopy for high-resolution and noninvasive in vivo imaging,”
Nat. Biotechnol., 24 848
–581
(2006). https://doi.org/10.1038/nbt1220 1087-0156 Google Scholar
E. Zhang,
J. Laufer, and
P. Beard,
“Backward-mode multiwavelength photoacoustic scanner using a planar Fabry-Pérot polymer film ultrasound sensor for high-resolution three-dimensional imaging of biological tissues,”
Appl. Opt., 47 561
–577
(2008). https://doi.org/10.1364/AO.47.000561 0003-6935 Google Scholar
R. J. Zemp,
L. Song,
R. Bitton,
K. K. Shung, and
L. V. Wang,
“In vivo realtime photoacoustic microscopy with a ultrasound array transducer,”
Opt. Express, 16
(11), 7915
–7928
(2008). https://doi.org/10.1364/OE.16.007915 1094-4087 Google Scholar
L. Li,
R. J. Zemp,
G. Lungu,
G. Stoica, and
L. H. V. Wang,
“Photoacoustic imaging of lacZ gene expression in vivo,”
J. Biomed. Opt., 12 020504
(2007). https://doi.org/10.1117/1.2717531 1083-3668 Google Scholar
K. Maslov,
H. F. Zhang,
S. Hu, and
L. H. V. Wang,
“Optical-resolution photoacoustic microscopy for in vivo imaging of single capillaries,”
Opt. Express, 33 929
–931
(2008). 1094-4087 Google Scholar
Z. X. Xie,
S. L. Jiao,
H. F. Zhang, and
C. A. Puliafito,
“Laser-scanning optical-resolution photoacoustic microscopy,”
Opt. Lett., 34 1771
–1773
(2009). https://doi.org/10.1364/OL.34.001771 0146-9592 Google Scholar
L. Pan
I. Utkin, and
R. Fedosejevs,
“Two-wavelength passively Q-switched ytterbium doped fiber laser,”
Opt. Express, 16 11858
–11870
(2008). https://doi.org/10.1364/OE.16.011858 1094-4087 Google Scholar
L. Pan,
I. Utkin, and
R. Fedosejevs,
“Passively Q-switched ytterbium-doped double-clad fiber laser with a : YAG saturable absorber,”
IEEE Photonics Technol. Lett., 19 1979
–1981
(2007). https://doi.org/10.1109/LPT.2007.909700 1041-1135 Google Scholar
Y. N. Billeh,
M. Y. Liu, and
T. Buma,
“Multispectral photoacoustic microscopy using a photonic crystal fiber super-continuum source,”
Proc. SPIE, 7564 75642T
(2010). https://doi.org/10.1117/12.841742 0277-786X Google Scholar
J. C. Ranasinghesagara,
Y. Jian,
X. H. Chen,
K. Mathewson, and
R. J. Zemp,
“Photoacoustic technique for assessing optical scattering properties of turbid media,”
J. Biomed. Opt., 14 040504
(2009). https://doi.org/10.1117/1.3200922 1083-3668 Google Scholar
S. P. Lin,
L. V. Wang,
S. L. Jacques, and
F. K. Tittel,
“Measurement of tissue optical properties using oblique incidence optical fiber reflectometry,”
Appl. Opt., 36 136
–143
(1997). https://doi.org/10.1364/AO.36.000136 0003-6935 Google Scholar
M. Gong,
Y. Wang,
D. Wang, and
Y. Liao,
“Stable operation of passively Q-switched microchip laser,”
Electron. Lett., 42
(13), 760
–762
(2006). https://doi.org/10.1049/el:20060496 0013-5194 Google Scholar
L. Pan,
I. Utkin,
R. J. Lan,
Y. Godwal, and
R. Fedosejevs,
“High peak power sub-nanosecond passively Q-switched ytterbium doped fiber laser,”
Opt. Lett., 35
(7), 895
–897
(2010). https://doi.org/10.1364/OL.35.000895 0146-9592 Google Scholar
|


