
|
|
1.IntroductionThe brain is a most fascinating and complex organ, containing numerous chromophores such as blood, cytochromes, neuromelanin, and lipofuscin. The spectral profile of blood is highly dependent on the oxygenation level and the amount of cytochrome c oxidase reflects the activity of the tissue,1 whereas melanin is characteristic to certain structures and the amount of lipofuscin is an indicator of tissue damage.2 Stereotactic neurosurgery, such as implantation of deep brain stimulation (DBS) electrodes3 or radio-frequency lesioning (ablation),4 provides an opportunity to study these chromophores very locally, in vivo, and without adding any discomfort or risk to the patient, by the use of diffuse reflectance spectroscopy.5, 6 At the Department of Biomedical Engineering, Linköping University, probes have been developed for optical measurements in the brain during stereotactic neurosurgery. These have been used for optical studies with diffuse reflectance spectroscopy and laser Doppler flowmetry during creation of paths for DBS electrodes.5, 7, 8 These measurements, and those by others,6, 9, 10 have shown that the reflected light intensity at can differentiate between gray matter, light gray matter (e.g., the thalamus), and white matter. The chromophore content has not yet been studied in detail, however. A difficulty with reflectance spectroscopy, compared to standard transmittance spectroscopy through thin samples, is that the apparent optical path length, (in millimeters), is unknown and varies with wavelength and tissue composition. An estimation of is thus required in order to reliably analyze diffuse reflectance spectroscopy data. Monte Carlo (MC) simulation11 is a valuable tool for simulation of light transport in biological tissue. The technique utilizes random walk for a large number of photons and is considered as the gold standard for simulations in the field. MC simulations have for example been used to estimate for transcranial near-infrared spectroscopy12 and to calculate expected reflected intensity and look-ahead distance in brain tissue.13, 14 Another method for solving the unknown path length is to use optical phantoms with known optical properties for inverse determination of the absorption and scattering coefficients in tissue.15 Such phantoms, spanning appropriate ranges of values for optical absorption and scattering, have been used for inverse determination of chromophore content in, e.g., the heart.16 The aim of this study is to develop an appropriate mathematical model for extraction of the absorption coefficients from intracellebral diffuse reflectance spectra, measured during DBS surgery. This will allow for determination of the chromophore content in the brain. 2.Material and Method2.1.Probe and Spectroscopy SystemThe probe studied consist of a -long metal tube with a diameter of that decreases to at the tip. It is used to create trajectories for DBS electrodes prior to their insertion. For spectroscopy, the probe contains two parallel, adjacent optical fibers with a core diameter of , a cladding diameter of , and a numerical aperture of 0.22 (Fig. 1 ). The emitting fiber is connected to a white halogen lamp (AvaLight-Hal-S, Avantes BV, The Netherlands) and the receiving fiber to a spectrometer (AvaSpec-2048-2, Avantes BV, The Netherlands). The lamp contains a shutter that allows the light to be shuttered without turning it off. A white polytetrafluoreten reference tile (WS-2, Avantes BV, The Netherlands) is used to normalize the light intensity so that it only shows the characteristics of the illuminated tissue, not the sensitivity of the spectrometer or the intensity of the lamp, which both are highly nonlinearly dependent on the wavelength. 2.2.Monte Carlo SimulationsThe optical fibers of the probe were modeled as illuminating and viewing a homogeneous domain of brain tissue. Models were made for white and gray matter at wavelengths between 480 and . The scattering coefficients, , and anisotropy factors, ; were taken from human ex vivo data17 (see Table 1 ). The Henyey–Greenstein phase function18 was used to randomize scattering angles based on . From the simulations, a pure scattering intensity, ; was calculated as where is the component from simulated photon number . Absorption was not calculated in the simulations but added during postprocessing according to the Beer–Lambert law to simulate the reflected light intensity,where is the simulated optical path length for photon number and the absorption coefficient. For each simulation, was included according to Eq. 2 in doubling steps between 0.01 and , with the assumption that each simulated photon represents a large number of real photons and not a discrete quantum. In total, 12 simulations were made, giving 12 values of and values of for the different combinations of and . The simulated intensity for white matter at and was used as reference level, defining the intensity here as 1. In each simulation, photons were used. Software developed at the Department of Biomedical Engineering, Linköping University, was used for the simulations.19Table 1Used optical properties for MC simulations and corresponding μs′ .
2.3.Fitting of Scattering Intensity and Apparent Optical Path Lengthand for gray and white matter were fitted, using the Levenberg–Marquardt algorithm, to the expression , where and are fitted coefficients. This relation is generally used for the reduced scattering coefficient of biological scatterers in the visible and near-infrared range.20 Matlab 7.9 (Mathworks Inc., Natick, Massachusetts, USA) was used for the fitting. Weighted errors, , for the fits were calculated according to where is the fitted value of variable .With and calculated from Eqs. 1, 2, an apparent optical path length, , was calculated as Equation 4 is based on Beer–Lambert law modifications by Jacques 15, 21 but and was not assumed to be polynomials of the reduced scattering coefficient, , as also is affected by .22 Instead, the apparent optical path length from the simulations were plotted against and in order to determine a more appropriate fit, .2.4.Phantom MeasurementsTwenty-five phantoms consisting of ultrahigh temperature-treated (UHT) milk (1.5% fat, Arla Foods, Sweden), water-soluble blue ink (Coloris, Germany), and water were created. Milk concentrations were varied in steps of 20% between 20 and 100%, and the ink was added in doubling concentrations between and , corresponding to peak absorption values from .23 The milk was assumed to be a purely scattering medium and the ink a purely absorbing medium. One row of phantoms without ink was also made in order to provide measurements of the pure scattering spectra, . Diffuse reflectance spectroscopy measurements were performed with the optical brain probe in random order, at room temperature, on the same day as the phantoms were created. Normalized spectra were calculated by where is the raw spectrum measured from the phantom, a white spectrum measured against the white reference tile, and a dark spectrum measured with all light shuttered.A reference simulation of the reflected light intensity at for UHT milk was made in order to provide a reference level for the intensity. The ink was diluted to 10% in order to ease the mixing process. However, this causes minor fluctuations in milk concentration between the phantoms. In order to compensate for this, from the inkless phantom with the same milk concentration was scaled for each ink-containing phantom so that its intensity between 815 and was equal to the intensity, , from the phantom. The scaling factor was taken as the mean between 815 and divided by the mean between 815 and . As for the results from the simulations, a regression model for was made. Only the intensity at the peak absorption wavelength of the ink was used for the regression here though. 2.5.Application on Clinical DataFinally, the method obtained from the simulations and phantom measurements was tested on two spectra from cortical gray matter and subcortical white matter, obtained during DBS surgery in an earlier study.5 As for the phantom measurements, was calculated with Eq. 5 and the mean intensity at from subcortical white matter was used to define . After thoroughly cleaning the optical fibers, white and dark spectra had been obtained right after the surgery without turning off the lamp or disconnecting the probe in between. Using linear regression, the calculated absorption spectra were fitted to chromophores that can be expected to be found in the brain: Deoxyhaemoglobin,24 oxyhaemoglobin,24 lipofuscin,25 eumelanin,26 and reduced and oxidized forms of cytochromes c and aa3.27, 28, 29 If any chromophore yielded a negative regression coefficient, then the chromophore with the largest negative coefficient was removed and the regression was redone. 3.Results3.1.MC SimulationsThe fits of the reduced scattering coefficient used for the simulations were proportional to for gray matter (mean ) and to for white matter (mean ). The corresponding fits to were proportional to for gray matter (mean ) and for white matter (mean ). There was an obvious curvature of the residuals versus wavelength for from white matter though, and it was found to fit better to a linear decrease with wavelength (mean ). A linear regression in the range , where can be assumed to be low or at least approximately constant, was thus assumed for in white matter [Fig. 2 ] increased linearly with for gray matter but nonlinearly with the higher for white matter [Fig. 2]. Simulated was higher than simulated from gray matter at and higher than simulated from white matter at . The simulations thus indicate that should be higher than measured in average for brain tissue. Fig. 2(a) Intensity, , versus wavelength for pure scattering white matter, i.e., in white matter, , white matter with (◇), pure scattering gray matter, i.e., in gray matter, (+) and gray matter with (○). The absorption values are typical in brain matter for between 580 and at neglible blood content.17 In a real spectrum, the intensity will be much lower beneath due to absorption from, e.g., blood (see Fig. 1). decreases linearly with for white matter while it is approximately proportional to for gray matter. (b) versus the reduced scattering coefficient, .  By plotting versus the variables and , it was found that a logarithmic transformation of the variables gave a fairly linear relation (Fig. 3 ). The following regression model was thus fitted: where coefficients are presented in Table 2 together with the goodness of fit, , of the regression model. Equations 4, 6 gives the estimate of according toif the intensity due to scattering alone is assumed to be known. Equation 7 can then be solved numerically with a starting point for close to zero, because the equation also will have another solution for higher . The latter should be discarded because it will be outside the range of values used to obtain the model. The numerical solving of Eq. 7 was performed using Matlab. Fitting errors when using Eq. 7 with the coefficients from the simulations on the simulation results are presented in Fig. 4 (mean ).Fig. 3Apparent optical path length for different values of and plotted versus the logarithms of (a) and (b) . MC simulations were performed for gray and white matter at wavelengths between 480 and . For each simulation, absorption was added during postprocessing in doubling steps between 0.01 and , giving a matrix of results. 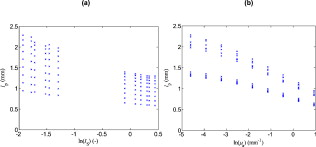 Fig. 4Weighted errors, , when Eq. 6 is used to estimate (a) when the coefficients from the simulations are used on the results from the simulations, (b) when the coefficients from the phantoms are used on the phantoms, and (c) when the coefficients from the simulations are used on the phantoms.  Table 2Coefficients for Eqs. 4, 5 and corresponding goodness of fit, R2 .
3.2.PhantomsFrom the MC simulation of the milk, the intensity level was calculated to 0.38 of white matter intensity at for pure milk. Examples of reflectance spectra from the phantoms are presented in Fig. 5 . Fig. 5(a) Reflectance spectra from milk phantoms (100% milk) with ink amounts that should correspond to peak absorption coefficients of, from up to down, 0, i.e., , (black), 0.23 (green), 0.46 (blue), 0.92 (red), 1.84 (cyan), and (magenta). (b) Corresponding calculated absorption coefficients normalized to an ink concentration that ideally should result in a peak absorption of . The dotted black line represents absorption measured with collimated transmission spectroscopy.23 The calculated absorption is higher than it should be for the lower ink concentrations. (Color online only.)  When applying Eq. 7 to the reflectance spectra from the phantoms, a decent fit of was found for the highest ink concentrations but lower concentrations yielded overestimations, which were higher for the lower the ink concentration [Figs. 5 and 4 ]. Fitting the results at (peak absorption) from the phantoms to Eq. 6 yielded coefficients and with higher magnitude (Table 2). Fitting errors when using the coefficients from the phantoms on the phantom results are presented in Fig. 4 (mean ). 3.3.Clinical DataOn the basis of the simulations and phantom measurements, the following method was used to calculate the absorption coefficient in brain tissue based on a measurement with the optical probe:
Fig. 6(a) Reflectance spectrum, , from human in vivo cortical gray brain tissue together with estimated pure scattering spectrum, . (b) Absorption coefficient, calculated by Eq. 6 with coefficients from the phantom measurements, for this spectrum together with fitted chromophore spectra for the absorption. According to this fit, the biggest contribution to the absorption comes from deoxyhaemoglobin and lipofuscin. Lesser contributions are estimated to be from melanin and the reduced forms of cytochromes c and aa3. Particularly notable is the apparent lack of oxyhaemoglobin. 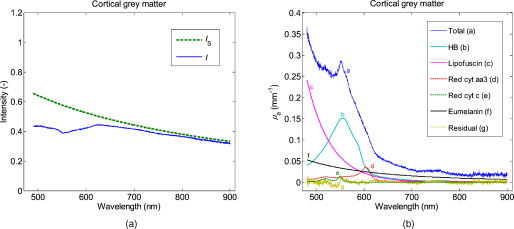 Fig. 7(a) Reflectance spectrum, , from human in vivo subcortical white brain tissue together with estimated pure scattering spectrum, . (b) Absorption coefficient, calculated by Eq. 6 with coefficients from the phantom measurements, for this spectrum together with fitted chromophore spectra for the absorption. According to this fit, the biggest contribution to the absorption comes from melanin and lipofuscin while lesser contributions comes from oxy- and deoxyhaemoglobin. A very minor contribution is also attributed to oxidized cytochrome aa3.  4.DiscussionIn this study, a method for estimation of the absorption coefficient in brain tissue based on diffuse reflectance spectra has been developed. The coefficients in Eqs. 6, 7 are depending on the fiber configuration and are thus not directly applicable to other optical probes. The equations should however be valid, in general, and could be used for similar probes if the corresponding coefficients are estimated for them. A reliable estimate of is important if reliable quantification of the chromophores in the tissue is to be achieved. Chromophores that could be of interest to quantify are, e.g., oxy- and deoxyhaemoglobin, lipofuscin, neuromelanin, and cytochromes. Haemoglobin content can give information about blood volume in the tissue. Caution should be taken regarding this when using an invasive probe, such as the one investigated in this study, because it is likely to affect the blood distribution in the tissue when inserted. The pressure from the insertion could press out blood from the vessels in the tissue, and bleeding could cause the presence of blood between the probe and the tissue. The estimated blood concentrations of 0.54% in the cortex and 0.36% in the white matter in this study are a lot lower than values from positron emission tomography (PET) studies of and , respectively, which should equal the percentage under the approximation that tissue has a mass of . Some of the difference could also be explained by the short fiber distance, which usually only will view the microvascular blood fraction, though. Haemoglobin content can also give the tissue blood oxygen saturation by calculating the ratio of oxygenated to total blood volume fraction. The example in this paper of an in vivo spectrum from the brain cortex shows a surprising lack of oxyhaemoglobin. Why this is and whether this is common in the brain would be of great interest to investigate further. According to PET studies, the oxygen extraction fraction in brain tissue should be ;30 thus, an oxygen saturation would be expected in this case, assuming the probe primarily views venous microvascular blood. One possible contribution to this discrepancy could be arteriovenous shunting, which has been indicated in dog brain, especially during hypercapnia.31 If some arterial blood is shunted directly to the veins without delivering oxygen to the tissue, then it could cause the venous blood to have higher oxygen content than the microvascular blood. Lipofuscin is a common chromophore that is usually overlooked in the field of biomedical optics. It consists of biological garbage that the lysosomes of the cells have not been able to digest and it accumulates with age in long-lived cells that undergo little or no cell division (e.g., neurons and cardiac and skeletal myocytes). A high amount of lipofuscin indicates high oxidative damage, is also likely to further hamper digestion of damaged structures, and adds more oxidative damage.2 Neuromelanin exists in certain structures of the brain (e.g., the substantia nigra). The substantia nigra lies just beneath the subthalamic nucleus (STN), which is a common target for DBS,32 and the presence of melanin in a measured spectrum could thus indicate a too deep position for a DBS electrode that is supposed to be in the STN. Cytochromes c and aa3 (a.k.a. cytochrome c oxidase) are important components for the generation of adenosine triphosphate in the mitochondria, and cytochrome aa3 concentration is indicative of how active the neurons are.1 In this study’s cortex spectrum, the concentrations for cytochromes c and aa3 were estimated to 2.2 an , respectively. Navarro 33 have made in vitro measurements of cytochrome c and aa3 concentrations in human frontal cortex. In Parkinsonian brains, they found a mitochondrial concentration of brain cortex and cytochrome concentrations of mitochondrial protein and mitochondrial protein for cytochromes c and aa3, respectively. Assuming that brain cortex equals , this should correspond to volume concentrations of for cytochrome c and for cytochrome aa3. The simulated for gray brain matter was found to be proportional to . The reduced scattering coefficients used for the brain matter simulations (Table 1) were also approximately proportional to . for white brain matter was better described by a linear relation to wavelength, however. The reason for the difference can be seen in Fig. 2: increases linearly with for the lower values in gray matter, but the increase is slowed down for the higher values in white matter. The behavior of myelin-rich light gray matter, such as the globus pallidus or the lateral part of the thalamus, can unfortunately not be determined by this, but it seems reasonable to expect that it will behave as a mixture of gray and white matter. The modeling is based on a single fiber distance because that is the kind of probe that we currently use in the brain. It would be beneficial to include at least one larger fiber separation in order to get more reliable estimates of . Such a setup would allow for more objective separation of the effect of scattering and absorption on the reflected intensity because the relative impact of scattering and absorption is different for different source-detector separations.34 It will be particularly difficult to distinguish between melanin content and potential errors in the estimation of when using just one fiber separation, because melanin has a smoothly decreasing absorption curve that neither has any characteristic peaks nor can be assumed to be zero anywhere in the spectral range . This limitation is probably less severe for tissue that does not contain melanin. Melanin in the cortex spectra could be expected if the melanin-containing leptomeninges35 (arachnoidea and pia mater) are pushed ahead of the probe a bit. The fitting of melanin to white matter in Fig. 7 is dubious though, and the fit also includes a baseline term that is difficult to explain. It is always possible that the absorption coefficients used in the simulations are too high and that should be closer to in the infrared range. This could be suspected based on the very flat residual spectra in Figs. 6 and 7. It is also possible that there is some unknown chromophore absorbing infrared light. Absorption from lipid36 and water is often included when using near-infrared spectroscopy with large fiber distances, but because their is in the range , they should be neglible here. What could be of interest to investigate, however, is whether myelin, whose abundance causes the high in white matter, has any noticeable absorption in the visible and near-infrared range. Comparing to in vitro data (Table 3 ), the spectrum for white matter calculated by Yaroslavsky 17 from measurements on human in vitro samples has a low-varying level of above and does not show any obvious melanin content. Their samples were rinsed from blood prior to measurements, and consequently, their spectra show little influence from blood absorption. Their gray matter spectrum show a more evident decrease in absorption with wavelength in the visible range. A similar tendency can be seen in spectra by Gebhart, 37 with the biggest difference that blood still is present in their spectra. Table 3Comparison of absorption coefficient, μa , to in vitro values from literature.
It is important to note that has an effect on that in no way is neglible compared to the effect of scattering. The effect of on has nevertheless often been omitted in studies when estimating by a modified Beer–Lambert law.21, 38, 39 Using a light transport model such as Eq. 6 should greatly improve the estimates of and thus also the estimates of . Matcher 40 have, e.g., pointed out that the impact of on dampens higher absorption coefficients compared to lower ones, which is in agreement with the negative value of coefficient obtained in this study. The tendency for Eq. 7 to overestimate low indicates that the impact of on actually is greater than implied by the simulations, as can be seen by the greater magnitude of coefficient obtained from the phantom measurements. The coefficients from the phantom measurements are probably more reliable than those from the simulations as the latter may be affected by errors in the MC model assumptions regarding, e.g., geometry, phase function, and fiber characteristics. There are possible errors with the phantoms, too, though. Although assumed to be purely absorbing, the ink used seems to have a small scattering component, which probably is causing some overestimation of its . Similarly, there is probably some absorption in the milk itself. Also, from pure UHT milk is lower than from white brain matter and the phantoms thus do not cover the entire range of interest. A more scattering liquid, such as Intralipid,41 might provide a better base for the phantoms. It can be seen in Figs. 3 and 4 that the apparent optical path length, , is not completely linearly dependent on the logarithms of the absorption and pure scattering intensity. Higher order terms could thus be added in order to get more accurate modeling. This may be worthwhile if more fibers at further distances are added. The greater slope on the lower values also indicates that the magnitude of coefficient from the phantoms may be too high for white matter because the higher white matter intensities are not covered by the phantom intensities. In particular, one should be very cautious if and are very high because Eq. 6 then can give negative, and thus unphysical, estimates of the optical path length. That could happen if a blood vessel is ruptured for example. In conclusion, the proposed method will give an approximate quantitative measurement of the absorption coefficient and should thus allow for quantification of chromophores in the brain. This study also elucidates the importance of taking the impact of the absorption coefficient into account when estimating the apparent photon path lengths. AcknowledgmentsThe author thanks his colleague Tobias Lindbergh, for valuable tips and discussion. The study was supported by NovaMedTech (funded by the European Union and Tillväxtverket, the Swedish Agency for Economic Growth), the Swedish Governmental Agency for Innovation Systems (Vinnova), the Swedish Foundation for Strategic Research (SSF), and the Swedish Research Council (VR, Dnr. 311-2006-7661). ReferencesM. T. Wong-Riley,
“Cytochrome oxidase: an endogenous metabolic marker for neuronal activity,”
Trends Neurosci., 12
(3), 94
–101
(1989). https://doi.org/10.1016/0166-2236(89)90165-3 0166-2236 Google Scholar
A. Terman and
U. T. Brunk,
“Oxidative stress, accumulation of biological ‘garbage’, and aging,”
Antioxid. Redox Signal, 8
(1–2), 197
–204
(2006). https://doi.org/10.1089/ars.2006.8.197 Google Scholar
A. L. Benabid,
A. Koudsie,
A. Benazzouz,
B. Piallat,
P. Krack,
P. Limousin-Dowsey,
J. F. Lebas, and
P. Pollak,
“Deep brain stimulation for Parkinson’s disease,”
Adv. Neurol., 86 405
–412
(2001). 0091-3952 Google Scholar
E. R. S. Cosman and
E. R. J. Cosman,
“Radiofrequency lesions,”
Textbook of Stereotactic and Functional Neurosurgery, 1 1359
–1382 2 ed.Springer-Verlag, Berlin
(2009). Google Scholar
J. D. Johansson,
P. Blomstedt,
N. Haj-Hosseini,
A. T. Bergenheim,
O. Eriksson, and
K. Wårdell,
“Combined diffuse light reflectance and electric impedance measurements for navigation aid in deep brain surgery,”
Stereotact. Funct. Neurosurg., 87
(2), 105
–113
(2009). https://doi.org/10.1159/000202977 1011-6125 Google Scholar
C. A. Giller,
M. Johns, and
H. L. Liu,
“Use of an intracranial near-infrared probe for localization during stereotactic surgery for movement disorders,”
J. Neurosurg., 93 498
–505
(2000). https://doi.org/10.3171/jns.2000.93.3.0498 0022-3085 Google Scholar
J. Antonsson,
O. Eriksson,
P. Blomstedt,
A. T. Bergenheim,
M. I. Hariz,
J. Richter,
P. Zsigmond, and
K. Wårdell,
“Diffuse reflectance spectroscopy measurements for tissue-type discrimination during deep brain stimulation,”
J. Neural Eng., 5
(2), 185
–190
(2008). https://doi.org/10.1088/1741-2560/5/2/009 1741-2560 Google Scholar
K. Wårdell,
P. Blomstedt,
J. Richter,
J. Antonsson,
O. Eriksson,
P. Zsigmond,
A. T. Bergenheim, and
M. I. Hariz,
“Intracerebral microvascular measurements during deep brain stimulation implantation using laser Doppler perfusion monitoring,”
Stereotact. Funct. Neurosurg., 85
(6), 279
–286
(2007). https://doi.org/10.1159/000107360 1011-6125 Google Scholar
C. A. Giller,
H. L. Liu,
P. Gurnani,
S. Victor,
U. Yasdani, and
D. C. German,
“Validation of a near-infrared probe for detection of thin intracranial white matter structures,”
J. Neurosurg., 98 1299
–1306
(2003). https://doi.org/10.3171/jns.2003.98.6.1299 0022-3085 Google Scholar
C. A. Giller,
H. Liu,
D. C. German,
D. Kashyap, and
R. B. Dewey,
“A stereotactic near-infrared probe for localization during functional neurosurgical procedures: further experience,”
J. Neurosurg., 110
(2), 263
–273
(2009). https://doi.org/10.3171/2008.8.JNS08728 0022-3085 Google Scholar
L. Wang,
S. L. Jacques, and
L. Zheng,
“MCML—Monte Carlo modeling of light transport in multi-layered tissues,”
Comput. Methods Programs Biomed., 47
(2), 131
–146
(1995). https://doi.org/10.1016/0169-2607(95)01640-F 0169-2607 Google Scholar
M. Hiraoka,
M. Firbank,
M. Essenpreis,
M. Cope,
S. R. Arridge,
P. van der Zee, and
D. T. Delpy,
“A Monte Carlo investigation of optical pathlength in inhomogeneous tissue and its application to near-infrared spectroscopy,”
Phys. Med. Biol., 38
(12), 1859
–1876
(1993). https://doi.org/10.1088/0031-9155/38/12/011 0031-9155 Google Scholar
J. D. Johansson,
I. Fredriksson,
K. Wårdell, and
O. Eriksson,
“Simulation of reflected light intensity changes during navigation and radio-frequency lesioning in the brain,”
J. Biomed. Opt., 14
(4), 044040
(2009). https://doi.org/10.1117/1.3210781 1083-3668 Google Scholar
Z. Qian,
S. V. Sunder,
G. Yeqing,
C. A. Giller, and
H. L. Liu,
““Look-ahead distance” of a fiber probe used to assist neurosurgery: phantom and Monte Carlo study,”
Opt. Express, 11
(16), 1844
–1855
(2003). https://doi.org/10.1364/OE.11.001844 1094-4087 Google Scholar
S. L. Jacques,
P. Bargo, and
K. Engelking,
“Optical fiber reflectance spectroscopy,”
(2009) http://omlc.ogi.edu/news/oct03/saratov/slide5.htm Google Scholar
E. Häggblad,
T. Lindbergh,
M. G. Karlsson,
H. Casimir-Ahn,
E. G. Salerud, and
T. Strömberg,
“Myocardial tissue oxygenation estimated with calibrated diffuse reflectance spectroscopy during coronary artery bypass grafting,”
J. Biomed. Opt., 13
(5), 054030
(2008). https://doi.org/10.1117/1.2976433 1083-3668 Google Scholar
A. N. Yaroslavsky,
P. C. Schulze,
I. V. Yaroslavsky,
R. Schober,
F. Ulrich, and
H. J. Schwarzmaier,
“Optical properties of selected native and coagulated human brain tissues in vitro in the visible and near infrared spectral range,”
Phys. Med. Biol., 47 2059
–2073
(2002). https://doi.org/10.1088/0031-9155/47/12/305 0031-9155 Google Scholar
S. L. Jacques and
L. Wang,
“Monte Carlo modeling of light transport in tissues,”
Optical-Thermal Response of Laser-Irradiated Tissue, 73
–100 Plenum Press, New York
(1995). Google Scholar
I. Fredriksson,
“Quantitative laser Doppler flowmetry,”
(2009) Google Scholar
J. R. Mourant,
T. Fuselier,
J. Boyer,
T. M. Johnson, and
I. J. Bigio,
“Predictions and measurements of scattering and absorption over broad wavelength ranges in tissue phantoms,”
Appl. Opt., 36
(4), 949
–957
(1997). https://doi.org/10.1364/AO.36.000949 0003-6935 Google Scholar
T. Lindbergh,
“Quantitative diffuse reflectance spectroscopy: myocardial oxygen transport from vessel to mitochondria,”
Linköping University,
(2009). Google Scholar
A. Sassaroli and
S. Fantini,
“Comment on the modified Beer-Lambert law for scattering media,”
Phys. Med. Biol., 49
(14), N255
–257
(2004). https://doi.org/10.1088/0031-9155/49/14/N07 0031-9155 Google Scholar
T. Lindbergh,
I. Fredriksson,
M. Larsson, and
T. Strömberg,
“Spectral determination of a two-parametric phase function for polydispersive scattering liquids,”
Opt. Express, 17
(3), 1610
–1621
(2009). https://doi.org/10.1364/OE.17.001610 1094-4087 Google Scholar
S. Prahl,
“Optical absorption of hemoglobin,”
(1999) http://omlc.ogi.edu/spectra/hemoglobin/index.html Google Scholar
L. B. Avalle,
J. Dillon,
S. Tari, and
E. R. Gaillard,
“A new approach to measuring the action spectrum for singlet oxygen production by human retinal lipofuscin,”
Photochem. Photobiol., 81
(6), 1347
–1350
(2005). https://doi.org/10.1562/2005-05-17-RN-531 0031-8655 Google Scholar
S. L. Jacques,
“Skin optics,”
(1998) http://omlc.ogi.edu/news/jan98/skinoptics.html Google Scholar
, “Specific extinction spectra of tissue chromophores,”
(2010) http://www.medphys.ucl.ac.uk/research/borl/research/NIR_topics/spectra/spectra.htm Google Scholar
W. D. Butt and
D. Keilin,
“Absorption spectra and some other properties of cytochrome c and of its compounds with ligands,”
Proc. R. Soc. London, Ser. B, 156
(965), 429
–458
(1962). https://doi.org/10.1098/rspb.1962.0049 0962-8452 Google Scholar
G. L. Liao and
G. Palmer,
“The reduced minus oxidized difference spectra of cytochromes a and a3,”
Biochim. Biophys. Acta, 1274
(3), 109
–111
(1996). https://doi.org/10.1016/0005-2728(96)00014-X 0006-3002 Google Scholar
J. Hatazawa,
H. Fujita,
I. Kanno,
T. Satoh,
H. Iida,
S. Miura,
M. Murakami,
T. Okudera,
A. Inugami,
T. Ogawa,
E. Shimosegawa,
K. Noguchi,
Y. Shohji, and
K. Uemura,
“Regional cerebral blood flow, blood volume, oxygen extraction fraction, and oxygen utilization rate in normal volunteers measured by the autoradiographic technique and the single breath inhalation method,”
Ann. Nucl. Med., 9
(1), 15
–21
(1995). https://doi.org/10.1007/BF03165003 0914-7187 Google Scholar
G. Edelman and
W. E. Hoffman,
“Cerebral venous and tissue gases and arteriovenous shunting in the dog,”
Anesth. Analg., 89
(3), 679
–683
(1999). https://doi.org/10.1097/00000539-199909000-00028 Google Scholar
A. L. Benabid,
S. Chabardes,
J. Mitrofanis, and
P. Pollak,
“Deep brain stimulation of the subthalamic nucleus for the treatment of Parkinson’s disease,”
Lancet Neurol., 8
(1), 67
–81
(2009). https://doi.org/10.1016/S1474-4422(08)70291-6 1474-4422 Google Scholar
A. Navarro,
A. Boveris,
M. J. Bandez,
M. J. Sanchez-Pino,
C. Gomez,
G. Muntane, and
I. Ferrer,
“Human brain cortex: mitochondrial oxidative damage and adaptive response in Parkinson disease and in dementia with Lewy bodies,”
Free Radic Biol. Med., 46
(12), 1574
–1580
(2009). https://doi.org/10.1016/j.freeradbiomed.2009.03.007 0891-5849 Google Scholar
A. Kienle,
L. Lilge,
M. S. Patterson,
R. Hibst,
R. Steiner, and
B. C. Wilson,
“Spatially resolved absolute diffuse reflectance measurements for noninvasive determination of the optical scattering and absorption coefficients of biological tissue,”
Appl. Opt., 35
(13), 2304
–2314
(1996). https://doi.org/10.1364/AO.35.002304 0003-6935 Google Scholar
S. S. Gebarski and
M. A. Blaivas,
“Imaging of normal leptomeningeal melanin,”
AJNR Am. J. Neuroradiol., 17
(1), 55
–60
(1996). 0195-6108 Google Scholar
R. L. van Veen,
H. J. Sterenborg,
A. Pifferi,
A. Torricelli,
E. Chikoidze, and
R. Cubeddu,
“Determination of visible near-IR absorption coefficients of mammalian fat using time- and spatially resolved diffuse reflectance and transmission spectroscopy,”
J. Biomed. Opt., 10
(5), 054004
(2005). https://doi.org/10.1117/1.2085149 1083-3668 Google Scholar
S. C. Gebhart,
W. C. Lin, and
A. Mahadevan-Jansen,
“In vitro determination of normal and neoplastic human brain tissue optical properties using inverse adding-doubling,”
Phys. Med. Biol., 51
(8), 2011
–2027
(2006). https://doi.org/10.1088/0031-9155/51/8/004 0031-9155 Google Scholar
P. G. Al-Rawi,
P. Smielewski, and
P. J. Kirkpatrick,
“Evaluation of a near-infrared spectrometer (NIRO 300) for the detection of intracranial oxygenation changes in the adult head,”
Stroke, 32
(11), 2492
–2500
(2001). https://doi.org/10.1161/hs1101.098356 0039-2499 Google Scholar
M. Shimada,
Y. Yamada,
M. Itoh, and
T. Yatagai,
“Melanin and blood concentration in a human skin model studied by multiple regression analysis: assessment by Monte Carlo simulation,”
Phys. Med. Biol., 46
(9), 2397
–2406
(2001). https://doi.org/10.1088/0031-9155/46/9/309 0031-9155 Google Scholar
S. J. Matcher,
M. Cope, and
D. T. Delpy,
“Use of the water absorption spectrum to quantify tissue chromophore concentration changes in near-infrared spectroscopy,”
Phys. Med. Biol., 39
(1), 177
–196
(1994). https://doi.org/10.1088/0031-9155/39/1/011 0031-9155 Google Scholar
I. Driver,
J. W. Feather,
P. R. King, and
J. B. Dawson,
“The optical properties of aqueous suspensions of Intralipid, a fat emulsion,”
Phys. Med. Biol., 34
(12), 1927
–1930
(1989). https://doi.org/10.1088/0031-9155/34/12/015 0031-9155 Google Scholar
|


