
|
|
|
The interaction of light with complex nanostructures has received considerable attention. Because the length scale of the refractive index variations in bone are comparable to the wavelength of light,1 bone can be considered as a biological nanostructured dielectric in an intermediate regime between ordered photonic structures (e.g., photonic crystals) and completely disordered nanostructures. Bone is a nanocomposite of a mineral phase (e.g., carbonated apatite crystals) and organic matrix (e.g., mainly collagen protein), and the entire structure of bone is highly hierarchical, containing multiscale features from the nanoscales to the macroscales.2, 3 This nanocomposite provides the structural basis for the mineralized collagen fibrils of ∼100 nm in diameter as the basic building block of bone. Microdamage in bone such as microcrack formation and propagation has been intensively studied for better understanding how bone deforms and fractures in terms of plasticity, toughness, and durability.3, 4 There is emerging evidence that such material characteristics are highly attributable to specific nanoscale structures.3, 5 For example, the unique bone structure may allow nanoscale deformation to spread out over a large spatial area as a highly effective energy dissipation mechanism.5 Daily habitual strain and loading in bone can also be associated with prefailure damage before microcrack formation.6 Stress distribution of undamaged regions of bone in double-notch specimens has been successfully mapped by converting Raman spectral shifts into stress values.7 Overall, the exact spatial extent of nanoscale prefailure damage in bone still remains relatively unexplored, in part, due to current technical limitations for nondestructively studying its structural properties at nanoscales.8 Although conventional nanoscale imaging methods such as electron microscopy and atomic force microscopy are highly valuable for investigating various aspects of nanostructures, they do not allow visualizing nanoscale deformation and damage in a fairly large area due to the intrinsic tradeoff between resolution and field of view. Also, electron microscopy requires intensive specimen preparation, which makes the examination of a specimen under mechanical testing virtually impossible. In this respect, elastic light scattering-based imaging approaches could be used to visualize prefailure damage and deformation. Although elastic light scattering approaches have shown potential for detecting subtle changes in subcellular structure and tissue architecture derived from carcinogenesis,9, 10 they have not been intensively applied to study the properties of bone. In particular, an imaging system that allows the visualization of a large area with high sensitivity to structural alterations could potentially offer a new method to study the unique properties of bone. In this study, we visualize prefailure deformation in bone at small strains before any conventional microcrack-associated damage occurs, using our newly developed spectroscopic imaging system. We, for the first time to our knowledge, demonstrate that the elastic light scattering-based imaging method can allow detailed physical mapping of prefailure nanoscale structural changes, and that the simple spectral analysis using the transfer matrix method can provide insight on the underlying mechanisms at bone prefailure stages. We prepared cortical bone specimens from bovine femurs.11 The final polished cortical bone sample was approximately 50 mm in length, 4 mm in width, and 0.2 mm in thickness. To introduce tensile force to the specimen, we used a miniaturized tensile testing device. The device allowed us to apply tensile force onto the specimen symmetrically, which eliminated the shift of the notch tip from the center of the field of view during loading. A cover slide was placed on the specimen covering the imaged notch area to maintain the specimen under hydrated conditions during data acquisition. We acquired three image datasets for each specimen before loading, under peak loading, and after removal of the loading. The tensile force applied on the sample was approximately 22 N, while the total longitudinal displacement of the specimen was less than 75 μm (the sample length between the clamps was about 30 mm). At this small strain, we have previously confirmed that no microcracks or other damage occurred by examining the specimen under both a high magnification reflectance microscope (50× objective) and an atomic force microscope.11 In this study we tested four bone specimens. In conjunction with mechanical testing, we used our spectroscopic imaging system described in detail elsewhere.12, 13 Back-directional gating in an imaging setup can significantly suppress diffuse light in biological tissue, including bone tissue, and thus allows the isolation of partial waves in relatively localized volumes, because biological tissue is highly anisotropic.13 Using our imaging system, we can obtain scattered intensity as a function of x, y, and λ in the area of ∼15×15 mm.12 We first generated white-light images of our cortical bone specimen by summing all the intensities at the different wavelengths from 400 to 900 nm. As shown in Figs. 1, 1, 1, the representative white-light images under three different loading conditions did not reveal any significant alterations around the stress concentrator (i.e., the notch), although a slightly bright area during loading around the notch area was observed. We further examined spectral patterns at the notch area before, under, and after the loading. Figure 1 shows that the spectral curves can be fitted to a linear line from 500 to 700 nm to account for the spectral variances (R 2 = 0.87). Thus, we were able to use the value of the spectral slope of the fitted line at each (x, y) location to form spectroscopic images, as shown in Fig. 2. The dark red pixels in the spectroscopic images represent the void areas, including the notch and the vascular canals, because the spectral slopes were almost zero due to the absence of backscattered light. Interestingly, the spectroscopic image during loading revealed a zone around the tip of the notch. As shown in the blue areas at around the tip of the notch during loading in Fig. 2, the backscattered intensity within this zone decayed faster over the wavelength. Using paired t-tests, the averaged spectral slope at the maximum deformation zone under the peak loading was 33±20% lower than that before the loading (two-sided p-value = 0.014), while the averaged white-light intensity under the loading was 15±20% higher than that before the loading (two-sided p-value = 0.017). More interestingly, this deformation zone was relatively large, covering an area of ∼1×1 mm, implying that the bone structure can spread out subtle deformation over a fairly large area to dissipate energy as a toughening mechanism. Fig. 1(a) (b) and (c) show white-light images of the bovine cortical bone specimen. (d) Typical spectra elastically backscattered from the specimen from different locations under the loading condition. The corresponding locations of blue and red spectra are marked on the white-light image in (b). 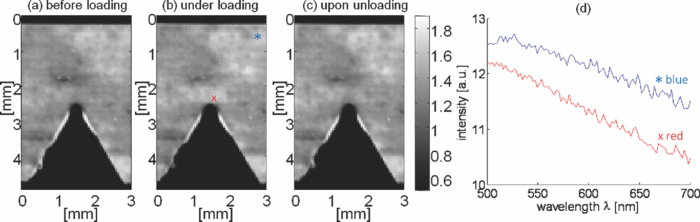 Fig. 2Spectroscopic images of the bovine cortical bone. Images are generated by the value of the spectral slope at each (x, y) location. A relatively large prefailure deformation zone (within the dotted line) is revealed at this small strain under tensile loading.  We further conducted a numerical study to gain a physical insight about possible underlying nanoscale deformation mechanisms that are attributable to the changes in the wavelength dependence. Although, 2- or 3-D structures for simulations are ideal for modeling light-bone interaction in general, the following characteristics can permit a simplification of the simulation to a 1-D nanocomposite structure composed of the collagen fibrils and the interfibrillar space. 1. In our experimental setup, the dominant orientation for the mineralized collagen fibrils was in the longitudinal direction, parallel with the tensile loading force. Our light illumination and collection were then applied perpendicular to the orientation of the mineralized collagen fibrils. As shown in Fig. 3, the high magnification (80000×) scanning electron microscopy (SEM) image of our cortical bone specimen displays the profiles of the relatively aligned collagen fibers embedded in the mineralized matrix. 2. Back-directional gating can significantly remove diffuse light, because of the high anisotropic property of the bone tissue, and the diffusive light exits the medium at large angles with respect to the optical axis. 3. The specimen thickness (∼200 μm) and the pixel size (∼50 μm) are on the order of the transport mean-free path length of the light [TeX:] \documentclass[12pt]{minimal}\begin{document}$l_{\rm s}^{\ast}$\end{document} in the bone (we estimated [TeX:] \documentclass[12pt]{minimal}\begin{document}$l_{\rm s}^{\ast}$\end{document} ∼100 to 130 μm using coherent backscattering measurements). Thus, we can take advantage of the matrix transfer method (i.e., the exact solution of Maxwell's questions in 1-D), which can account for multiple interference and interlayer correlation effects. In the transfer matrix method, the electric and magnetic fields at the left interface of a layer are expressed as those at the right interface via a 2×2 matrix.14 Under the continuous boundary conditions of the fields, the transmission and reflection of optical waves in 1-D random media consisting of multiple dielectric layers can be readily calculated.14 Fig. 3(a) Representative SEM image of our polished bovine bone surface. (b) Representative profile of the simulated structure. (c) Representative stimulated spectrum when the thickness of the collagen layer = 100 nm with n = 1.60 and the matrix space = 50 nm with n = 1.40.  We modeled the bone structure as multiple dielectric layers, mimicking the mineralized collagen fibrils and the interfibrillar matrix, as shown in Fig. 3. The collagen fibrils were embedded in the interfibrillar matrix, and the averaged diameter of the collagen fibrils was approximately 100 nm. In our simulations, we stacked 1000 dielectric layers consisting of 500 mineralized collagen fibril layers and 500 interfibrillar layers. The total thickness of all the layers was comparable to the physical thickness of our specimen. To account for the partially disordered nanostructure of bone and interaction of multiple partial waves with the bone structure, we also obtained 1000 realizations by randomly varying the order of each layer. We averaged 1000 realizations to obtain a representative spectral pattern and calculated a single value of the spectral slope. We simulated two possible cases as follows. First, we varied the thickness of the mineralized collagen fibril layer from 80 to 120 nm, while the thickness of the interfibrillar matrix was kept constant to be 50 nm. In this case, the refractive indexes of collagen fibril and interfibrillar matrix were 1.60 and 1.40, respectively. Second, the thicknesses of the mineralized collagen fibril and interfibrillar matrix layer were kept unchanged at 100 and 50 nm respectively, while we varied the refractive index difference between these two layers Δn, as shown in Fig. 3. The overall refractive index of the numerical samples was comparable to a measured refractive index of our bone specimen of around 1.59 at λ = 650 to 830 nm using our Fourier-domain optical coherence tomography system. Using the transfer matrix method, we calculated the backscattered intensity as a function of the wavelength from 500 to 700 nm in each realization, and averaged all the realizations to obtain a representative spectral pattern [Fig. 3]. Similar to the experimental data, the reflectance spectrum can be described by a declining function of the wavelength. In this case, a linear fit to the spectrum from 500 to 700 nm can also account for the most spectral variance (R 2 = 0.93), and thus the spectral slope was calculated for each configuration of the multiple layered structures. Figure 4 shows the simulation result of the first scenario that the thickness of the mineralized collagen fibril layer was varied with the fixed thickness of the interfibrillar matrix. The spectral slope decreases as the thickness of the collagen fibril layer decreases. Thus, in the deformation zone identified by the spectroscopic image, the spectral variances might be attributable to the thinning of collagen fibrils. Although the collagen fibrils would be subject to elongation, resulting in the thinning of the collagen fibrils due to Poisson's effect, the existence of mineral content within collagen fibrils can lower the Poisson's ratio of mineralized collagen fibrils.15 In this case, the thinning effect of the collagen fibrils would be minimal and not contribute significantly to the decrease in spectral slope during loading of the specimen. Figure 4 shows the result of the second scenario that Δn was changed. As Δn becomes smaller, the absolute value of the spectral slope increased, corresponding to the deformation zone of our bone specimen under loading. The variance of refractive index can potentially be derived from the internal structure reorganization or new phase formation. In the recent study using fluorescent dyes to stain the deformation zone of the bovine bone specimen,11 debonding of the mineral collagen interface, can account for the prominent process within the deformation zone. The debonding effect can create additional interfaces in the bone structure and yield nanoscale voids (10 to 20 nm in size).11 This could potentially be responsible for the slight residual deformation that can be seen in our spectroscopic image during unloading [e.g., Fig. 2]. Formation of nanoscale voids could potentially render the variation of the refractive index, and thus the simulation result suggests that the formation of nanoscale voids occurs within the mineralized collagen fibrils. Overall, the relatively large deformation zone may be attributable to either the thinning of the mineralized collagen fibril or the refractive index variation potentially derived from nanoscale void formation. Fig. 4(a) Simulation result of the 1-D multilayer dielectric nanostructure when the thickness of the mineralized collagen fibril layer was varied. (b) Simulation result when the refractive index difference was changed.  In conclusion, our pilot studies can serve as compelling demonstration that the light elastically backscattered from bone tissue can be highly sensitive to nanoscale structural alterations. Specifically, our spectroscopic imaging method allowed us to sensitively map heterogeneous prefailure deformation in a relatively large area at small strains. Moreover, the unique combination of the bone structure and the system configuration allowed us to use the transfer matrix method to study possible spectroscopic origins for prefailure deformation. AcknowledgmentsThis project was supported in part by grants from Purdue Research Foundation and NIH 1R03CA153982. We thank Umut Atakan Gurkan for the SEM image of the bone specimen. ReferencesD. S. Wiersma,
R. Sapienza,
S. Mujumdar,
M. Colocci, M. Ghulinyan, and
L. Pavesi,
“Optics of nanostructured dielectrics,”
J. Opt. Pure Appl. Opt., 7
(2), S190
–S197
(2005). https://doi.org/10.1088/1464-4258/7/2/025 Google Scholar
J. S. Yerramshetty,
C. Lind, and
O. Akkus,
“The compositional and physicochemical homogeneity of male femoral cortex increases after the sixth decade,”
Bone, 39
(6), 1236
–1243
(2006). https://doi.org/10.1016/j.bone.2006.06.002 Google Scholar
R. O. Ritchie,
M. J. Buehler, and
P. Hansma,
“Plasticity and toughness in bone,”
Phys. Today, 62
(6), 41
–47
(2009). https://doi.org/10.1063/1.3156332 Google Scholar
U. A. Gurkan and
O. Akkus,
“The mechanical environment of bone marrow: a review,”
Ann. Biomed. Eng., 36
(12), 1978
–1991
(2008). https://doi.org/10.1007/s10439-008-9577-x Google Scholar
K. Tai,
M. Dao,
S. Suresh,
A. Palazoglu, and
C. Ortiz,
“Nanoscale heterogeneity promotes energy dissipation in bone,”
Nature Mat., 6
(6), 454
–462
(2007). https://doi.org/10.1038/nmat1911 Google Scholar
E. F. Morgan,
O. C. Yeh,
W. C. Chang, and
T. W. Keaveny,
“Nonlinear behavior of trabecular bone at small strains,”
J. Biomechan. Eng. Trans. ASME, 123
(1), 1
–9
(2001). https://doi.org/10.1115/1.1338122 Google Scholar
K. A. Dooley,
J. McCormack,
D. P. Fyhrie, and
M. D. Morris,
“Stress mapping of undamaged, strained, and failed regions of bone using Raman spectroscopy,”
J. Biomed. Opt., 14
(4), 044018
(2009). https://doi.org/10.1117/1.3184435 Google Scholar
H. S. Gupta and
P. Zioupos,
“Fracture of bone tissue: the ‘hows’ and the ‘whys’,”
Med. Eng. Phys., 30
(10), 1209
–1226
(2008). https://doi.org/10.1016/j.medengphy.2008.09.007 Google Scholar
J. R. Mourant and
I. J. Bigio,
“Elastic-scattering spectroscopy and diffuse reflectance,”
Biomedical Photonics Handbook, CRC Press, Boca Ratan, FL
(2003). Google Scholar
I. Georgakoudi,
J. T. Motz,
V. Backman,
G. Angheloiu,
A. S. Haka,
M. Müller,
R. Dasari, and
M. S. Feld,
“Quantitative characterization of biological tissue using optical spectroscopy,”
Biomedical Photonics Handbook, CRC Press, Boca Raton, FL
(2003). Google Scholar
X. Sun,
J. Hoon Jeon,
J. Blendell, and
O. Akkus,
“Visualization of a phantom post-yield deformation process in cortical bone,”
J. Biomech., 43
(10), 1989
–1996
(2010). https://doi.org/10.1016/j.jbiomech.2010.03.011 Google Scholar
Z. Xu,
J. Liu,
D. Hong,
V. Nguyen,
M. Kim,
S. I. Mohammed, and
Y. L. Kim,
“Back-directional gated spectroscopic imaging for diffuse light suppression in high anisotropic media and its preclinical applications for microvascular imaging,”
Sel. Top. Quantum Electron. IEEE J., 16
(4), 815
–823
(2010). https://doi.org/10.1109/JSTQE.2009.2037160 Google Scholar
Z. Xu,
J. Liu, and
Y. L. Kim,
“Diffuse light suppression of back-directional gating imaging in high anisotropic media,”
J. Biomed. Opt., 14
(3), 030510
(2009). https://doi.org/10.1117/1.3156801 Google Scholar
P. Yeh, Optical Waves in Layered Media, Wiley, New York
(1988). Google Scholar
O. Akkus,
“Elastic deformation of mineralized collagen fibrils: an equivalent inclusion based composite model,”
J. Biomech. Eng., 127
(3), 383
–390
(2005). https://doi.org/10.1115/1.1894204 Google Scholar
|


