|
|
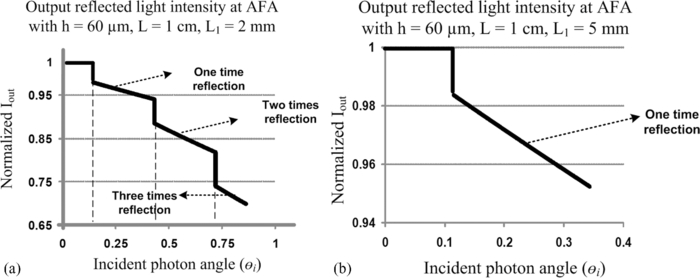
1.Introduction1.1.Background and MotivationSeveral applications in biomedical optics and optical remote sensing involve imaging through a turbid medium. In optical bioimaging methods, illumination and detection can be performed either on the same side of the medium for reflective imaging, or on opposite sides of the medium for transillumination imaging. Reflectance imaging methods1 such as optical coherence tomography2, 3 and enhanced backscattering spectroscopy,4 where photons are either coherently or diffusely reflected by the scattering properties of the medium, are more developed but suffer from limited light penetration into tissue. Transillumination imaging methods can image through thicker samples (since the photon path is not folded compared to reflectance methods) and have found application for small animal imaging.5, 6 However, the challenges associated with the strong scattering properties of tissue places an effective limit on the detection of ballistic photons for tissues no greater than 3 to 4 mm in thickness.7 With recent improvements, transillumination imaging has found new applications, i.e., biometric authentication using vein patterns of a finger or palm8 and histopathological characterization and high resolution margin delineation of sectioned tissue samples.9, 10 When imaging thick tissue samples by transillumination methods, the image-forming signal is largely affected by scatter, and less so by attenuation. The scattering coefficient is of the order of μs ≈ 100 cm− 1, being about four orders of magnitude larger than absorption and thus leading to a total mean free path of only 0.1 mm. Therefore, for transillumination imaging of tissue samples up to a centimeter in thickness, the amount of ballistic light passing through the tissue sample is negligible. Only quasiballistic and scattered photons are present in large enough quantities to provide image-forming signal. Since there is no clear borderline between quasiballistic and scattered light, Takagi 11, 12 redefined nonballistic light into three categories: near-axis scattered light, weakly scattered light, and strongly diffused light. These categories were based on the concepts of deviation of photon trajectory from the original path and transit time taken to traverse the optical path. For a transillumination imaging system, photons in each category contribute differently to the spatial resolution of the resultant projection image. For instance, an imaging system that captures only near-axis scattered light provides higher spatial resolution compared to an imaging system that captures only weakly scattered light.11, 12 By using the dissimilarities of scattering characteristics in time, angle, and polarization, different imaging techniques have been explored to select ballistic and quasiballistic photons. In the time domain, the snake and diffuse photons are usually differentiated by photon travel times. Techniques based on the capture of snake photons with time gating alone13, 14 suffer from low sensitivity. Alternatives to time gating are polarization gating15, 16 and angle gating.17, 18 In certain experiments, combinations of more than one method were used for higher efficiency in imaging.19, 20, 21, 22, 23 Time and coherence domain imaging systems usually require expensive and complicated instrumentation including fast pulsed lasers and detectors, although polarization and angular gating can be less expensive approaches. Our previous work23 showed that quasiballistic photons passing through a turbid medium quickly lost their initial polarization and so could not be selected using polarization-based filtration. Angle filtration of exiting photons was more efficient compared to the polarization filtration scheme. Angular domain imaging (ADI) utilizes a passive optical device to filter out highly scattered photons and is based on the principle that scattered photons tend to exit a turbid medium with a nearly uniform angular distribution, while nonscattered ballistic and quasiballistic photons exit with a trajectory that remains close to the initial trajectory with minimal angular deviation.24 Hence, by rejecting scattered light by ADI, internal absorption or scattering targets appear as shadows from outside the turbid sample. 1.2.ADI PrincipleThe simplest implementation of ADI involves the use of a converging lens and a pinhole aperture. When the aperture is located at the back focal plane of the lens, the arrangement forms a spatiofrequency filter (SFF) and is capable25, 26 of blocking incoming photons with trajectories outside the angular acceptance of the SFF. Therefore, when used to view a transilluminated turbid sample, minimally scattered image-forming photons are preferentially selected to produce a projection image of the sample contents. An alternative design for ADI involves an array of high-aspect-ratio microchannels known as an angular filter Array23, 24(AFA). The AFA approach has the advantage that distortions and aberrations common to the lens/pinhole arrangement are avoided. As shown in Fig. 1, the AFA provides a means to reject highly scattered photons preferentially compared to quasiballistic photons, so that the projection image can be formed on the detector. Recently, a series of ADI studies analyzed silicon micromachined AFA performance for detection of information-bearing diffusely reflected photons27 and fluorescence targets.28 The experiment results demonstrated that ADI performed better than standard reflectance methods and could measure deeper structures more accurately. 1.3.Improvement of ADI by New AFA Designs and Time GatingAlthough AFA devices have been shown to reject scattered photons for turbid samples with thicknesses of up to 6 times the reduced mean free path, beyond this thickness background-scattered light dominates. Background-scattered light arises due to photons that leak through the AFA due to internal reflections and/or multiply scattered photons that attain acceptable trajectories and leak through the AFA to the detector.23 One potential solution to reject photons that leak due to internal reflections is to introduce surface features into the microchannel walls that attenuate photons through the principle of reflection loss.29 We hypothesized that by introducing rectangular features into microchannel walls, photons will be reflection trapped and the effect of photon leakage due to wall reflections will be suppressed greatly. A potential solution to the problem of leakage of multiply scattered photons relates to path length differences between quasiballistic and multiply scattered photons. Due to their longer trajectory, photons representative of background-scattered light take longer to reach the detector than quasiballistic photons. Therefore, we hypothesized that time-gated detection of the early arriving photons will provide a means to suppress background-scattered light during ADI. This is based on the fundamental difference between path length gating (as employed by time domain) and trajectory angle filtration. As the path length gate is decreased, photons with path lengths exceeding the filter cutoff are excluded. While as the trajectory angle gate is decreased, only the average path length of accepted photons is decreased. Images comprised of trajectory-filtered photons will always include a contingent of multiply-scattered photons, resulting in reduced contrast and degraded resolution. However, by combining both trajectory angular filtration and time gating, complimentary improvements in AFA scattered light leakage can be realized and push the detection limit of ADI beyond current levels. 1.4.Objective and ApproachReflections off of the microchannel walls and background light leakage are two processes that limit the performance of ADI when imaging through thick turbid media. Therefore, to enhance our understanding of how these processes impact ADI so that ultimately sample thickness can be increased, the work presented here had four objectives. First, we sought to model microchannel wall reflections and their dependence on incidence angle of photons entering the AFA. Second, we wanted to compare the modeling results to measurements obtained with AFAs of increasing acceptance angles. Third, we tested a new AFA design for suppressing channel wall reflections and compared its performance to conventional AFA designs. Last, we designed an alternative strategy for suppression of background light leakage and compared it to established methods. Our approach to modeling was to apply the Fresnel law to the microchannel geometry to predict the transmitted light through the AFA as a function of incident angle. Our approach to reducing channel wall reflections was to optimize the design parameters of the AFA. AFAs of various acceptance angle and channel wall design (flat Vs patterned) were fabricated and employed in transillumination ADI. We then evaluated the efficiency of the different AFAs at capturing quasiballistic photons and rejecting highly scattered photons and compared the results to the output of our modeling. Our approach to reducing background light leakage was to devise a new ADI design that combined angular domain imaging (using an AFA) with time domain technology in the form of a picosecond pulsed laser for illumination and an ultrafast gated CCD camera for detection. We then tested the new ADI design on its ability to improve image contrast by rejection of the late arriving photons that contributed to background light leakage. We then compared the results to those from wedge subtraction, which provided an independent means to correct for background light leakage. 2.Methods2.1.Fabrication of Tissue-Mimicking PhantomsIn the following experiments, an aqueous suspension of Intralipid™ was employed to model the high scattering properties of biological tissue samples. Intralipid™ is a practical and widespread phantom medium for light dosimetry studies because, like tissue, it is turbid and has low optical absorption at near-IR wavelengths. As a scattering medium, the optical properties of Intralipid™ have been well described.30, 31 Within each phantom we placed a resolution target at the midpoint of the optical cuvette. The resolution target consisted of a collection of L-shaped patterns (optical thick film of aluminum) on a glass slide to evaluate the horizontal and vertical spatial resolution of image; see Fig. 1. The L-shaped lines and spaces had various submillimeter sizes. Results from earlier work23 demonstrated that the detection limit of ADI in transillumination mode depended on both the thickness of the sample and its scattering level, which is dependent on Intralipid™ concentration. For instance, a 150-μm line and spacing target was detectable with ADI at the midpoint of a 5 cm thick (l) optical cuvette filled with 0.14% Intralipid™ as well as a l = 2 cm thick optical cell filled with 0.3% Intralipid™, and a l = 1 cm thick optical cell filled with 0.7% Intralipid™. This confirmed that the product of the reduced scatter coefficient (proportional to Intralipid™ concentration) and the thickness was a predictor of the detection performance of ADI. As described in Refs. 30, 31, considering the forward scattering property (g = 0.75) common in tissue-mimicking phantoms, the reduced scattering coefficient for 1% Intralipid™ is roughly 8 to 10 cm−1 in the near IR, while the absorption coefficient is about 0.1 to 0.01 cm−1, which is two to three orders of magnitude smaller. The reciprocal value of reduced scattering coefficients yields the reduced mean free path (MFP′). Therefore, for the resolvable 150-μm-line targets, the effective resolution of ADI was 3 line pairs per millimeter (lp/mm) at a scattering level of 6×MFP′ about the detection limit. 2.2.Conventional AFAsMonte-Carlo simulation programs designed to test the ADI concept showed that the collimator detects the shortest-path-length photons.24 Consequently, the collimator acts as an optical filter to remove scattered light while preserving the ballistic and quasiballistic light. Simulations suggested that smaller channels and longer arrays could enhance detection by >100 in the condition that they do not violate diffraction and Raleigh range limitations.24 In this paper, we report the experimentally determined effect of AFA geometry on ADI performance. Four AFAs were fabricated using silicon micromachining techniques. Each had unique properties related to the microchannel aperture size, acceptance angle, and microchannel wall pattern. More about the fabrication of square-shaped AFAs is described in Ref. 32. During testing of the AFAs, a standardized ADI system (i.e., same light source, turbid sample, and camera used for all AFAs) was used to enable accurate comparisons between AFA geometries. The consistency of the ADI setup was critical since the resultant image contrast and resolution in ADI is known to be directly affected by the collimation quality, illumination shape33 (large field circular or line), wavelength of the light source,18 AFA alignment, sample scattering level, and camera pixel size. As shown in Fig. 2, the conventional AFAs were fabricated with a parallel array of square-shaped microchannels that varied in aperture size from 20×20, to 40×40, to 60 μm×60 μm. The microchannels of each AFA were 1 or 1.5 cm long to provide a complimentary range of testable aspect ratios (i.e., same aspect ratio, but different microchannel dimensions). Fig. 2Experimental setup for the proposed techniques: (a) different AFA geometries; (b) diagram of the time angular domain imaging (TADI) system; and (c) diagram describing the wedge subtraction method, where images were collected with and without a wedge prism so that the contributions from image-forming quasiballistic photons and background-scattered photons could be estimated. 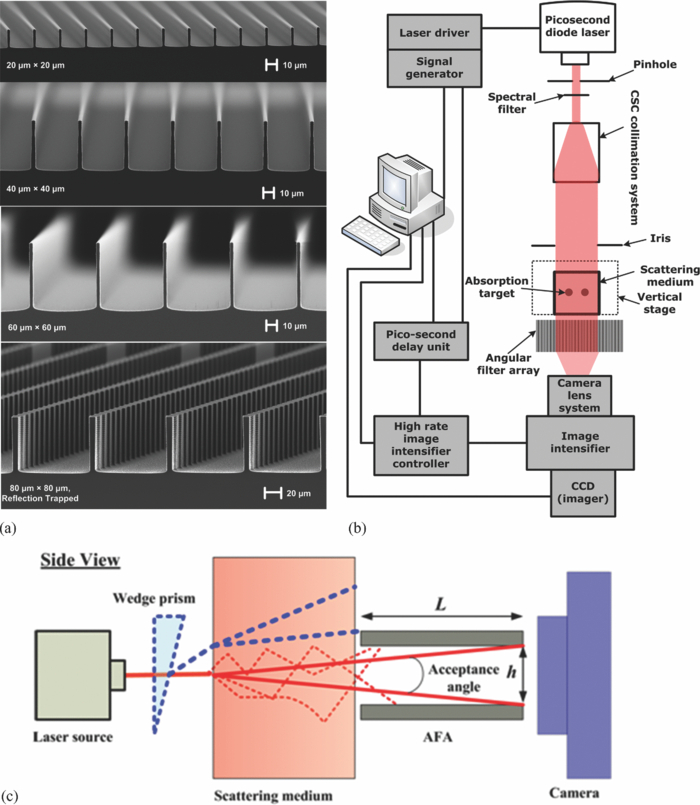 2.3.Reflection-Trapped AFAsEven though the AFAs we tested in previous work32 had small aspect ratios, internal reflections within the microchannel led to apparent increases in the effective aspect ratio. For example, photons entering the microchannel aperture at an angle greater than the acceptance angle can reflect internally. As we discussed previously, intrachannel reflected light acts as a source of background bias (noise) in the ADI scans, and various techniques can be employed to modify the channel walls to suppress it. Previous methods used to reduce the internal reflection of the channel include coating the channel wall with carbon and increasing the surface roughness.29, 34 Although these methods reduced internal reflections, they did not completely eliminate reflected light from reaching the detector. We therefore devised an alternative design called a reflection-trapped AFA [RTAFA; last design in Fig. 2] that had patterned channel walls to trap reflected photons. In the RTAFA device, the channel walls were pattered with square vertical ridges of 2.5 μm (at least twice the wavelength) at a periodicity of 20 μm. More fabrication details are presented in Ref. 35. To distinguish between individual AFAs, we employed a naming convention for the AFA design based on either regular (AFA) or reflection-trapped (RTAFA) with the first number denoting the aperture size and the second number denoting the channel length. For example, RTAFA-80-1.5 represents a reflection-trapped AFA with an 80×80-μm microchannel aperture and a channel length of 1.5 cm. 2.4.Ray Trace Analysis of AFA GeometriesFor AFAs with flat channel walls, photons with trajectories outside the acceptance angle range of the AFA can potentially pass through the AFA due to the high reflectivity of the silicon at shallow angles. Silicon (index of refraction, n = 3.65 in the near IR) can be up to 40% reflective to perpendicularly incident light, and much more so at shallower angles. Figure 1 shows the top view of one microchannel of an AFA in transillumination model, where L 1 is the distance between the scattering medium and the opening of the channel; L 2 is the distance from the end of the channel to the detector camera; and L and w are the length and the width of the channel, respectively. The angular parameters of the filter include θ a and θb. The acceptance angle θ a of the channel is defined as the maximum angle for light to arrive at the detector without experiencing any reflection with the channel wall, while θ b is defined as the minimum angle for photons to be blocked by the filter channel. The reflected angle θ r is the angle between θ a and θ b. Incident light at θ r tends to reflect with the channel wall before it reaches the detector camera. Using the Fresnel reflection formulas for reflection of angled light, the reflectances R p (for parallel polarized light) and R s (perpendicular) are given by36 Eq. 1[TeX:] \documentclass[12pt]{minimal}\begin{document}\begin{equation} R_S = \left(\frac{{n_1 \cos (\theta _i) - n_2 \{1 - [ {{{{n_1}/ {n_2}}}\sin (\theta _i)} ]^2 \}^{1/2}}} {{n_1 \cos (\theta _i) + n_2 \{1 - [ {{{{n_1}/ {n_2}}}\sin (\theta _i)} ]^{2} \}^{1/2}}} \right)^2, \end{equation}\end{document}Eq. 2[TeX:] \documentclass[12pt]{minimal}\begin{document}\begin{equation} R_P = \left(\frac{{n_1 \{1 - [ {{{{n_1}/ {n_2}}}\sin (\theta _i)} ]^2 \}^{1/2} - n_2 \cos (\theta _i)}} {{n_1 \{1 - [ {{{{n_1}/ {n_2}}}\sin (\theta _i)} ] ^2\}^{1/2} + n_2 \cos (\theta _i)}} \right)^2, \end{equation}\end{document}To simulate the performance of the AFA designs to photons outside the acceptance angle, we performed a simple optical ray trace analysis. The reflectance from the AFA microchannel walls was calculated using the Fresnel law [Eqs. 1, 2] and is reported in Fig. 3. Scattered light exiting the turbid medium at a point was modeled as a point source with isotropic emission. The point source is shown as P in Fig. 1. The normalized transmittance and effect of multiple reflections versus the incident photon angle (θ i) was calculated for a single microchannel of the AFA (AFA-60-1) with the central axis of the entrance aperture placed 2 or 5 mm from the source. An ideal detector was assumed (i.e., sensitivity assumed independent of position and angle of incidence). 2.5.Wedge Subtraction MethodIn principle, most scattered photons are assumed to be rejected since they exit the turbid medium with an angle greater than the acceptance angle of the AFA. Yet, as discussed earlier in this paper, there is always a group of multiply scattered photons with trajectories that are within the acceptance angle of the AFA, because of the spherically uniform distribution of scattered photons in the turbid media [see trajectory 5 in Fig. 1]. The analytical descriptions of the leaked scattered photons are described in Ref. 23. Experiments have shown that by slight deviation of the laser beam [shown in Fig. 2] by ∼ 2 to 3×the AFA acceptance angle, approximately the same amount of scattered light can pass through the AFA while the ballistic and quasiballistic photons will be rejected by the microchannels.23 Consequently, an ADI image collected using a deviated light source will contain mostly scattered photons with good pixel-by-pixel correspondence with the original scan collected without source beam deviation. Deviation of the source beam can be implemented by introducing an optical wedge prism into the light path prior entering the sample. This methodology enabled us to estimate the proportion of quasiballistic photons that provided the image-building signal to the proportion of scattered photons that represented the background leakage for each of the AFA designs. A wedge prism with a 1-deg deviation specification was used to redirect the collimated line of light out of the plane of the AFA. Wedge-subtracted images were computed by subtracting the background scattered light image (with wedge prism inserted in to the light path) from the image of the same sample collected without the wedge prism. The resultant wedge-subtracted image had enhanced contrast on a pixel-by-pixel basis. 2.6.Angular Domain Imaging (cw) SetupTo test the different AFA designs, a cw ADI system was constructed based on earlier work.18, 29 Briefly, an 808-nm laser diode housed in a 9-mm package (L808P1WJ, Thorlabs, New Jersey) was used for illumination. The emission area of the laser diode was 100 μm wide and approximately 1 μm high. The emitted laser beam had asymmetry and high angular divergence along both axes. The beam was transformed into a collimated thin line of light using a beam-shaping system with the ability to correct the strong divergence. It consisted of an aspheric-cylindrical lens system to correct both horizontal and vertical divergence.18, 29 Each AFA was precisely aligned to the collimated line of light from the laser source using a six-axis positioner. A high-resolution CMOS camera (1280×1024 pixel) with square pixels (5.2×5.2 μm; i.e., smaller than the microchannel aperture) was positioned directly behind the AFA. As shown in Fig. 1, the ADI system was used to image a turbid sample that contained a resolution target. The sample was placed on a computer-controlled vertical z axis stage between the output of the beam-shaping system and the AFA. Repeated ADI scans at a sequential series of sample heights provided a 2-D image of the turbid sample. 2.7.TADI System SetupTo test the effect of time-gating in combination with an AFA, a TADI system was designed and assembled. The optical layout was similar to the cw ADI system, but the TADI system included a pulsed laser for illumination and a gated camera for detection [Fig. 2]. The laser emitted pulses at 780 nm with a pulse duration of 100 ps (FWHM) and a repetition rate of 80 MHz (PicoTA, PicoQuant GmbH and TOPTICA Photonics). A spectral filter (λ=780±5 nm) was used to block the background emission caused by the laser amplifier system. The beam was shaped into a uniform line of light using a cylindrical-spherical-cylindrical lens collimation system.33 While the majority of existing time-domain systems utilize a Kerr gate or a streak camera,13 we had available an ultrafast gated camera (PicoStar HR, LaVision) for image capture. The camera incorporated a microchannel plate (MCP) controlled via a high-rate imager (HRI, Kentech Instruments, Oxfordshire, United Kingdom). Gating of the MCP was achieved by applying a pulsed negative voltage across a photocathode in front of the MCP. The gate width was controlled using an ultrashort pulse generated by the HRI, with nominal gate width settings from 200 to 1000 ps. The output of the MCP was coupled to a 12-bit CCD camera (1370×1040 pixels). The MCP operated as a very fast shutter that was synchronized to the incoming laser pulses. Synchronization was facilitated by an electronic delay unit (Delay Unit, LaVision, Germany) between the output synchronization signal from the PicoTA laser controller and the input trigger on the HRI. The delay time (Td) on the delay unit could be adjusted with a resolution of 5 ps. With the MCP operating in “comb” mode, a sequence of gated transmission images accumulated on the CCD during each camera exposure (typically 0.1 to 10 s depending on transmitted light intensity). Overall camera operation including the setup of the delay time, camera exposure time, and image capture, and display was performed using camera acquisition software (DaVis, LaVision). The system enabled a parallel and temporally resolved detection of the light emitted from all microchannels of the AFA. To record the temporal point spread function (TPSF) of the detected photons from the sample, the delay was scanned electronically, typically in 15-ps steps. Since the laser pulse duration was similar to that of the camera gate width, we evaluated the effect of laser pulse width on the performance of the TADI system. Results from the picosecond TADI system were compared to preliminary findings from a femtosecond TADI system assembled with a fiber-based pulsed laser (Femtolite Ultra CX-20, IMRA America, Inc.). Since the fiber-based system had much shorter pulse durations of 100 fs (pulse repetition rate of 50 MHz and average power of 20 mW), the effects of laser pulse duration did not convolve with the camera response function. A more detailed description of the femtosecond TADI system is presented in a recent proceedings paper.37 2.8.Image AnalysisThe image contrast of specific ADI scans was quantified using an image contrast ratio metric based on the following formula: where I min is the average light intensity corresponding to the shadowed region (i.e., due to the shadow of the L-shaped target within the phantom), and I max is the average light intensity corresponding to a nonshadowed area nearby the L-shaped structure.3.Results and Discussion3.1.Ray Trace Analysis of AFA GeometriesThe results of the simple optical ray trace analysis based on the Fresnel law [Eqs. 1, 2] are reported in Fig. 3. For the source nearby (2 mm) the entrance aperture of the AFA (AFA-60-1), the normalized transmittance decreased in a stepwise manner as the trajectory of the incoming photons deviated from the central axis of the microchannel [see Fig. 3]. The stepwise response was due to the occurrence of reflections off of the microchannel walls before the photons exited the AFA. When the source was far (5 mm) from the entrance aperture of the AFA, the acceptance angle of the AFA provided for, at most, a single reflection off of the microchannel sidewalls before the photon exited the AFA [Fig. 3] and hence only a single step was observed. For both source positions, the normalized transmittance was not constant between steps, but decreased monotonically in accordance with the Fresnel law as the incident angle increased. Table 1 summarizes the reflected light intensity parameters for three different AFA geometries for the acceptance angle (θ a), where the first reflection occurs and the blocking angle (θ b), above which the AFA is 100% effective (for this simplified model off-axis sources are not considered). Even though the AFA-20-1 placed 2 mm from the point source had the smallest acceptance angle, it could still accept photons with trajectories up to 5×the acceptance angle, which included photons that experienced one or more channel wall reflections. The normalized transmitted light intensity near the acceptance angle was about 0.993 due to a single reflection off of the silicon microchannel wall at the shallowest angle of incidence. The normalized transmitted light intensity was reduced to 0.885 when the trajectories of photons were near the blocking angle. The proportion of photons experiencing one or more reflections was 82.6% of the total number of photons entering the AFA microchannel aperture. When the AFA-20-1 was placed 5 mm from the source, both the acceptance angle (θ a) and blocking angle (θ b) decreased, resulting in shallower angles of incidence for reflected photons and overall lower reflection loss. The improved transmission characteristics for the AFA-20-1 observing the distant source were also due in part to the smaller proportion of reflected photons for a given number of photons entering the microchannel (66.4%). This overall behavior was also observed for the AFA-40-1 and AFA-60-1 devices, but the proportion of photons experiencing at least one reflection decreased only minimally as the microchannel aperture increased. Therefore, a large portion of photons with trajectory angles greater than the acceptance angle of the AFA are expected to leak through the AFA to the detector for all devices with smooth microchannel walls. Therefore, improvements in AFA performance can be realized only by minimizing microchannel wall reflections to ensure that all photons exiting the AFA have been angularly filtered according to the AFA geometry. Table 1Estimation of effect of reflected light in different AFA sizes
3.2.Microchannel Wall Reflection Suppression with Reflection-Trapped AFAsIn an independent set of experiments, we tested four AFA devices with square-shaped openings, each with a different combination of aspect ratio and microchannel wall patterning. We used the transillumination ADI (cw) to collect scans of a 2-cm-path-length optical cuvette filled with 0.3% Intralipid™ (diode laser with λ = 780 nm). An L-shaped resolution target placed at the midpoint to the cuvette and image analysis, as described in Sec. 2 was used to assess image contrast. For the conventional AFA devices, an increase in image contrast ratio from 16 (AFA-60-1) to 20% (AFA-60-1.5) was measured as the aspect ratio increased. As shown in Table 2, a similar relative improvement in contrast ratio(CR) was observed for the reflection-trapped AFAs, i.e., RTAFA-60-1.5 to RTAFA-80-1.5. However, the RTAFAs had considerably better performance in terms of CR than the conventional AFAs for a constant aspect ratio. For example, the CR for images obtained with the RTAFA-60-1.5 was 31% compared to only 20% for the AFA-60-1.5. Regardless of AFA type, the highest image CR (34%) was observed for the RTAFA-80-1.5 device, which had an acceptance angle of 0.30 to 0.42 deg. These results suggest that by employing RTAFA, the effective angular acceptance of each microchannel approaches the acceptance angle related to the physical geometry of channel opening and the channel length, which leads to improved performance compared to a conventional AFA of similar dimensions, where the channel walls are reflective, leading to higher effective acceptance angles and poorer performance due to transmission of a greater number of unwanted scattered photons. Table 2Effect of channel wall reflection reduction by using RTAFA in resulted ADI image contrast measurements (through scattering medium with 2-cm optical cuvette filled with 0.3% Intralipid™ at λ = 780 nm).
3.3.Background Suppression By Wedge Subtraction for Various AFA GeometriesFigure 4 shows ADI scans obtained with four AFA devices, each of unique geometry. The turbid sample was used for testing and consisted of a 1 cm path length optical cuvette filled with 0.7% Intralipid™ (diode laser with λ = 808 nm), with the L-shaped resolution target placed at the midpoint along the optical path. The ADI scans in Figs. 4 to 4 show the intrinsic image contrast differences when the acceptance angle ranged from 0.11 to 0.48 deg. It is qualitatively apparent that the ADI scans suffered from low image contrast due to the fact that the images were formed by both quasiballistic light and background scattered light. As discussed in our previous work,23 one way to account for the background scattered light leakage through the AFA is to deviate the light source out of the acceptance angle of the AFA. With this method, the background-scattered light can be estimated and subtracted on a pixel-by-pixel basis from the ADI scan with collimated light. Applying this method to the images in Figs. 4 to 4, we estimated and subtracted the background-scattered light for each ADI image. The resultant images are shown in Figs. 4 to 4 and had much improved image contrast [compare the ADI scans of Figs. 4 to 4 to those Figs. 4 to 4, respectively]. Fig. 4ADI scan results in 2-cm optically thick turbid media (0.7% Intralipid™) using four different AFA geometries (a) to (d) and contrast-enhanced images using the wedge technique for background-scattered light estimation and subtraction (e) to (h).  Quantitative contrast estimates from the ADI scans supported the qualitative analysis. The contrast estimates corresponding to Fig. 4 are presented in Table 3. The poorest contrast (∼4.0%) was obtained from the ADI scan where the AFA (AFA-20-1) with an acceptance angle range of 0.11 to 0.16 deg was used. The image contrast increased (up to ∼8.3%) for ADI scans collected with the AFA devices AFA-40-1 and AFA-60-1.5, which had an intermediate acceptance angle of 0.22 to 0.32 deg. ADI scans collected with the AFA-60-1 device that had the highest acceptance angle of 0.34 to 0.48 deg had the highest image contrast (∼12.3%). Table 3Summary of the ADI contrast experimental measurements for different AFA geometries (through scattering medium with 1-cm optical cuvette filled with 0.7% Intralipid™ at λ = 780 nm).
The wedge-subtracted ADI images shown in Figs. 4 to 4 show an image contrast improvement of about 4.5 times for the device with an acceptance angle of 0.11 to 0.16 deg, 8.9 to 10 times for the two devices with acceptance angles of 0.22 to 0.32 deg, and about 6.7 times for the device with the highest acceptance angle of 0.36 to 0.48 deg. Since we were using a wedge prism with angular deviation of 1 deg, it may not be optimal for the AFA-60-1 device, where the acceptance angle permitted quasiballistic photons to leak through to the detector. The experimental results indicated that the larger aperture size from 20 to 60 μm enabled higher numbers of quasiballistic photons to be accepted by the AFA, which resulted in higher CRs. Also, longer arrays resulted in increased image contrast. In the context of our modeling analysis, this was expected since photons outside the acceptance angle experienced a greater number of reflections and hence they were attenuated to a larger degree before reaching the detector. A similar improvement in image contrast was observed for longer RTAFAs, as shown in Table 2. From the Monte Carlo analysis of the AFA geometry, it was shown that the AFA operates more effectively when the channel opening size is decreased and the channel length is increased (with the caveat that the geometry does not introduce diffraction issues). Consistent with the Monte Carlo analysis, we observed experimentally that longer microchannels improve the ADI image contrast. However, the experimental analysis showed that larger AFA opening sizes (up to 80 μm) resulted in better image contrast, which was inconsistent with the Monte Carlo results. Although one might consider using even larger channel openings, the spatial resolution (3 lpm; ∼ 160 μm line and space widths) begins to degrade for openings larger than 80 μm. The channel opening also should be chosen to compensate for experimental limitations such as low light intensities due to source limitations and permissible exposure limits. 3.4.Background Suppression by TADIFigure 5 shows time-resolved measurements from the TADI system using the AFA-60-1 device with and without wedge prism (ADI-W and ADI) at different scattering levels. The measured temporal response in each case was broadened due to the presence of late arriving scattered photons. This was in contrast to the temporal response computed by the wedge subtraction method, which was primarily confined to early arrival times representative of quasiballistic photons. As shown in Fig. 5, the proportion of ballistic/quasiballistic photons relative to the total photons detected through the AFA was measurable by the temporal profile peak intensity of ADI with wedge subtraction (ADI-WS) compared to the ADI case. At lower scattering levels such as μ′ sl = 4 more than 60% of the detected photons were quasiballistic. The contribution of quasi-ballistic photons diminished to 20% at μ′ sl = 5 and less than 10% at the detection limit (μ′ sl = 6). Fig. 5Temporal profiles of transmitted light obtained in time-resolved measurements using a Picostar camera (250-ps temporal gate width) through scattering medium at λ = 780 nm with a 2–cm optical cuvette filled with (a) 0.2% Intralipid™, at (b) 0.25% Intralipid™, and (c) 0.3% Intralipid™. 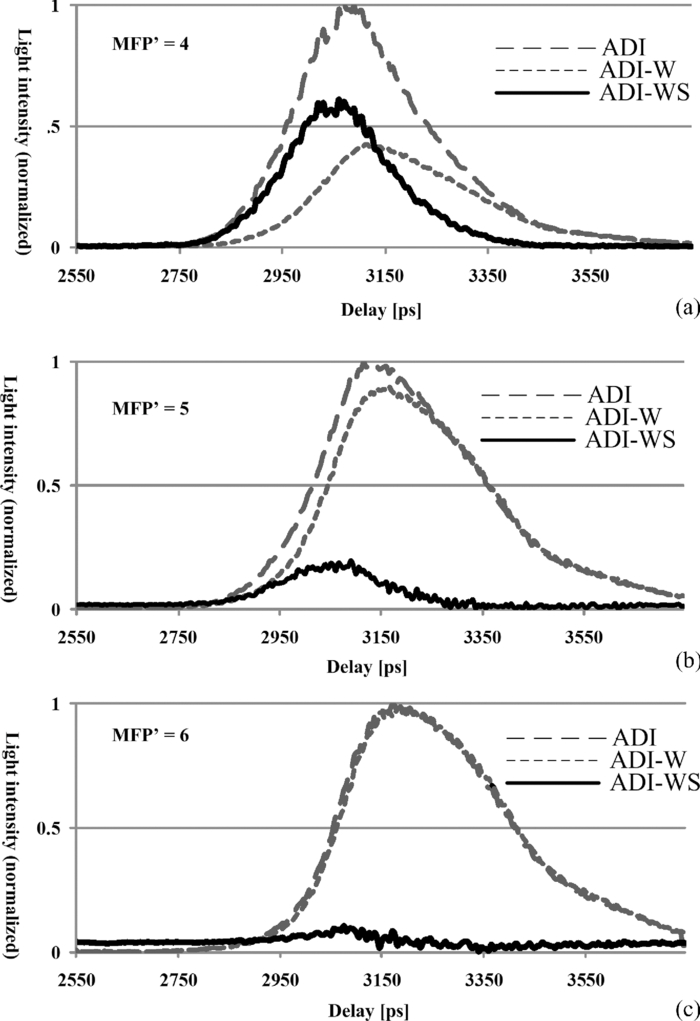 In an attempt to push the ADI detection limit beyond μ′ sl = 6, the ultrafast gated CCD camera with temporal gate width of 250 ps was used for temporal discrimination of photons exiting the AFA. Figure 6 shows the image results for TADI versus ADI with and without the wedge subtraction method. The images are of an L-shaped resolution target with lines and spaces of 350 μm placed at the midpoint of a 2-cm optical path length cuvette filled with Intralipid™ solution at scattering levels from μ′ sl =5 to μ′ sl = 7. The range of scattering levels was chosen to bracket the scattering level representative of the ADI detection limit. Scattered light rejection was evaluated using the wedge subtraction method for both angular (ADI-WS) and time-angular (TADI-WS) filtration. The image contrast values computed for the images in Fig. 6 are tabulated for each scattering level (Table 4). Our measurements indicated that the image CR increased by 10 to 15% for TADI alone, which was less than the image contrast increases observed with ADI wedge subtraction method. However, both time gating and wedge subtraction resulted in detectable contrast beyond the ADI detection limit to μ′ sl = 7 with an image CR of 25%. At the 250-ps time gate width, nonscattered light can travel up to 5.5 cm, which is much greater than the sample thickness of 2 cm. Therefore, image contrast with TADI under these conditions is expected to be suboptimal since scattered photons with paths up to 5.5 cm will be accepted by the camera. A faster camera, such as a streak camera with a gate width of 50 ps could lead to more efficient time-gated filtration compared to the PicoStar camera. Fig. 6ADI and TADI scanning results (using AFA-60-1) of a 350-μm L-shaped resolution target at the middle of a turbid medium with and without a wedge subtraction procedure at different scattering levels through scattering medium at λ = 780 nm with a 2-cm optical cuvette filled with (a) 0.25% Intralipid™, (b) 0.3% Intralipid™, and (c) 0.35% Intralipid™. 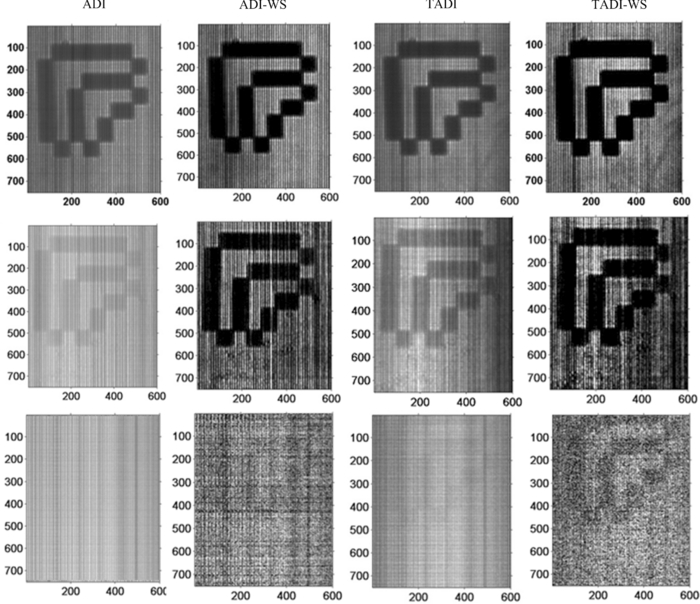 Table 4Summary CR measurements using AFA-60-1 in the ADI and TADI methods with wedge subtraction through scattering medium with 2-cm optical cuvette filled with different concentrations of Intralipid™ at λ = 780 nm.
We also investigated TADI implemented with a femtosecond pulsed laser (Femtolite Ultra CX-20, IMRA America, Inc.) and compared performance to ADI alone. More of the system setup is described in Ref. 37. Figure 7 shows the temporal scan of the transilluminated signal from a 2-cm optical path cuvette as a function of the scattering level of the medium using TADI. The temporal gate width of the camera system was 250 ps. We discovered that the beam from the Femtolite had poorer far-field collimation properties compared to the picosecond pulsed laser (PicoTA), which had a negative impact on ADI performance. However, the image contrast improvement by the combination of time and angular gating was noticeable. Figure 7 shows the image contrast variation of the TADI system as a function of the camera gate width. The image contrast analysis was conducted at two scattering levels: 0.25% Intralipid™ with [TeX:] \documentclass[12pt]{minimal}\begin{document}$\mu ^\prime _s$ = 2.5 cm−1 and μ a = 0.01 cm−1 (MFP′ = 5), which was below the detection limit of ADI and 0.3% Intralipid™ solution with [TeX:] \documentclass[12pt]{minimal}\begin{document}$\mu ^\prime _s$ = 3 cm−1, and μ a = 0.01 cm−1 in a 2-cm optical length sample (MFP′ = 6). For the 0.25% Intralipid™ solution, the image contrast increased from 24% in ADI measurements to 68% in TADI at the earliest possible time gate measurement using a gate width of 250 ps. On the other hand, for the 0.3% Intralipid™ solution, the image contrast increased from 3% (about the noise level) in ADI measurements to 34% at the earliest possible time gate measurement. Hence, the time-resolved ADI measurement showed an image contrast enhancement from 4 to 34% compared to TADI with the-0.3% Intralipid™ solution, which represents a greater than 8 times improvement in image contrast compared to ADI alone. 3.5.Implications of Scattering Level to Scan TimeSince the AFA devices had a limited vertical field of view and required vertical scanning to acquire 2-D images, acquisition time was lengthy. The scanning procedure was mainly limited by the camera exposure time and the communication between the computer and translation stage. The camera exposure time was dependent on the scattering level and laser power. For instance, to form an ADI scan at a scattering level of equivalent to 6 times reduced mean free path [Figs. 4 to 4], the laser power was increased to 350 mW (collimation reduced the effective power that reached the sample) and the camera exposure time for each scan line was lengthened to 30, 15, and 10 ms while employing the AFAs with opening sizes of 20×20, 40×40, and 60×60 μm, respectively. However, in the practical implementation, data communication increased the time for one line scan to approximately 1 s, resulting in ADI scans as shown in Fig. 4 that took approximately 5 min (300 steps) to collect. Therefore, in the limiting case where data transfer from camera to computer is minimized, lower laser power and/or faster scanning times will be achieved by using an AFA with a larger acceptance angle. 4.ConclusionWe experimentally characterized the angular distribution and proportion of minimally deviated quasiballistic photons versus multiply scattered photons in a turbid medium. The measurements were made using an ADI system in transillumination mode that employed different designs of silicon micromachined AFAs, each with a different range of acceptance angles. The balance between quasiballistic photons and unwanted multiply scattered photons accepted by the micromachined angular filters was measured to determine the optimum range of acceptance angles for the system. A reflection-trapped AFA design was fabricated, tested, and compared to a conventional AFA design. The RTAFA resulted in a 50% increase in ADI image contrast compared to the non-reflection-trapped AFA design. The effect of time gating on the ADI method was also investigated. Time-resolved ADI scans of targets within turbid samples were captured with an ultra-fast-gated ICCD camera system. The scan results indicated that TADI with a 250-ps temporal gate width provided some image contrast improvement compared to ADI alone. The effect of the wedge subtraction method in combination with TADI on image contrast was examined. TADI with wedge subtraction gave the greatest improvement in image contrast, which was more than 7 times larger than the result obtained with ADI alone for μ′ sl = 6. The enhancements to ADI offered by RTAFA devices, time gating, and a wedge subtraction methodology led to measurable and significant improvements in image contrast for targets at depth in turbid samples. These enhancements provide flexibility when performing ADI imaging. They can either be utilized to reduce ADI scan time to achieve an image contrast comparable to standard ADI methodology, or they can be implemented alone or in combination to improve image contrast well beyond standard ADI methodology. In conclusion, the angular filter method offered efficient scattered light suppression with moderate levels of scattering (i.e., an ∼5 to 6 mm soft tissue thickness). One interesting possibility for future work is to employ the filtration properties of the AFA to hyperspectral imaging (i.e., a push broom setup) to provide a means to display differences in image contrast between different tissues based on their optical absorption/scattering differences in the near-IR spectral band. AcknowledgmentsThis project was funded by grants from the Natural Sciences and Engineering Research Council of Canada (NSERC) to B.Kaminska and J. J. L. Carson and by a Small Grant for Cancer Research and Training from the London Regional Cancer Program (LRCP) to K. Jordan, J. J. L. Carson, and B. Kaminska. F. Vasefi was supported by a LRCP Translational Breast Cancer Research Trainee Studentship. ReferencesF. Fabbri,
M. A. Franceschini, and
S. Fantini,
“Characterization of spatial and temporal variations in the optical properties of tissuelike media with diffuse reflectance imaging,”
Appl. Opt., 42
(16), 3063
–3072
(2003). https://doi.org/10.1364/AO.42.003063 Google Scholar
A. F. Fercher,
“Optical coherence tomography-principles and applications,”
Rep. Progr. Phys., 66 239
–303
(2003). https://doi.org/10.1088/0034-4885/66/2/204 Google Scholar
J. G. Fujimoto,
“Optical coherence tomography,”
Compt. Rend. Acad. Sci. IV Phys. Astrophys., 2 1099
–111
(2001). Google Scholar
O. L. Muskens and
A. Lagendijk,
“Broadband enhanced backscattering spectroscopy of strongly scattering media,”
Opt. Express, 16
(2), 1222
–1231
(2008). https://doi.org/10.1364/OE.16.001222 Google Scholar
D. A. Benaron and
D. K. Stevenson,
“Optical time-of-flight and absorbance imaging in biologic media,”
Science, 259 1463
–1466
(1993). https://doi.org/10.1126/science.8451643 Google Scholar
V. Ntziachristos,
J. Ripoll,
L. V. Wang, and
R. Weissleder,
“Looking and listening to light: the evolution of whole-body photonic imaging,”
Nature Biotechnol., 23 313
–320
(2005). https://doi.org/10.1038/nbt1074 Google Scholar
L. Wang,
P. P. Ho,
C. Liu,
G. Zhang, and
R. R. Alfano,
“Ballistic 2-D imaging through scattering wall using an ultrafast Kerr gate,”
Science, 253 769
–771
(1991). Google Scholar
M. Kono,
H. Ueki, and
S. Umemura,
“Near-infrared finger vein patterns for personal authentication,”
Appl. Opt., 41 7429
–7434
(2002). https://doi.org/10.1364/AO.41.007429 Google Scholar
W. H. Yong,
P. V. Butte,
B. K. Pikul,
J. A. Jo,
Q. Fang,
T. Papaioannou,
K. Black, and
L. Marcu,
“Distinction of brain tissue, low grade and high grade glioma with time-resolved fluorescence spectroscopy,”
Front. Biosci., 11 1255
–1263
(2006). https://doi.org/10.2741/1878 Google Scholar
S. K. Gayen,
M. Alrubaiee,
M. E. Zevallos, and
R. R. Alfano,
“Temporally and spectrally resolved optical imaging of normal and cancerous human breast tissues,”
Proc. Inter-Institute Workshop on In Vivo Optical Imaging at the NIH, 142
–147
(2000) Google Scholar
K. Takagi,
Y. Kato, and
K. Shimizu,
“Extraction of near-axis scattered light for transillumination imaging,”
Appl. Opt., 48 D36
–D44
(2009). https://doi.org/10.1364/AO.48.000D36 Google Scholar
K. Takagi,
H. Kakinuma,
Y. Kato, and
Koichi Shimizu,
“CW transillumination imaging by extracting weakly scattered light from strongly diffused light,”
Opt. Express, 17 8332
–8342
(2009). https://doi.org/10.1364/OE.17.008332 Google Scholar
K. M. Yoo,
B. B. Das, and
R. R. Alfano,
“Imaging of a translucent object hidden in a highly scattering medium from the early portion of the diffuse component of a transmitted ultrafast laser pulse,”
Opt. Lett., 17 958
–960
(1992). https://doi.org/10.1364/OL.17.000958 Google Scholar
L. Wang,
X. Liang,
P. Galland,
P. P. Ho, and
R. R. Alfano,
“True scattering coefficients of turbid matter measured by early-time gating,”
Opt. Lett., 20 913
–915
(1995). https://doi.org/10.1364/OL.20.000913 Google Scholar
H. Wang,
C. Sun,
Y. Wang,
Y. Kiang, and
C. C. Yang,
“Determination of the depth of a scattering target in a turbid medium with polarization discrimination of transmitted signals,”
Opt. Lett., 28 25
–27
(2003). https://doi.org/10.1364/OL.28.000025 Google Scholar
H. Horinaka,
K. Hashimoto,
K. Wada,
Y. Cho, and
M. Osawa,
“Extraction of quasi-straightforward-propagating photons from diffused light transmitting through a scattering medium by polarization modulation,”
Opt. Lett., 20 1501
–1503
(1995). https://doi.org/10.1364/OL.20.001501 Google Scholar
S. P. Schilders,
X. S. Gan, and
M. Gu,
“Microscopic imaging through a turbid medium by use of annular objectives for angle gating,”
Appl. Opt., 37 5320
–5326
(1998). https://doi.org/10.1364/AO.37.005320 Google Scholar
F. Vasefi,
B. Kaminska,
P. K. Y. Chan, and
G. H. Chapman,
“Multi-spectral angular domain optical imaging in biological tissues using diode laser sources,”
Opt. Express, 16 14456
–14468
(2008). https://doi.org/10.1364/OE.16.014456 Google Scholar
L. Wang,
P. P. Ho, and
R. R. Alfano,
“Time-resolved Fourier spectrum and imaging in highly scattering media,”
Appl. Opt., 32 5043
–5048
(1993). https://doi.org/10.1364/AO.32.005043 Google Scholar
X. Liang,
L. Wang,
P. P. Ho, and
R. R. Alfano,
“Time-resolved polarization shadowgrams in turbid media,”
Appl. Opt., 36 2984
–2989
(1997). https://doi.org/10.1364/AO.36.002984 Google Scholar
C. C. Yang,
C.-W. Sun,
C.-K. Lee,
C.-W. Lu,
M.-T. Tsai,
C. Yang, and
Y.-W. Kiang,
“Comparisons of the transmitted signals of time, aperture, and angle gating in biological tissues and a phantom,”
Opt. Express, 12 1157
–1168
(2004). https://doi.org/10.1364/OPEX.12.001157 Google Scholar
X. Gan,
S. Schilders, and
M. Gu,
“Combination of annular aperture and polarization gating methods for efficient microscopic imaging through a turbid medium: theoretical analysis,”
Microsc. Microanal., 3 495
–503
(1997). Google Scholar
F. Vasefi,
B. Kaminska,
G. H. Chapman, and
J. J. Carson,
“Image contrast enhancement in angular domain optical imaging of turbid media,”
Opt. Express, 16 21492
–21504
(2008). https://doi.org/10.1364/OE.16.021492 Google Scholar
G. H. Chapman,
M. Trinh,
N. Pfeiffer,
G. Chu, and
D. Lee,
“Angular domain imaging of objects within highly scattering media using silicon micromachined collimating arrays,”
IEEE J. Sel. Top. Quantum Electron., 9 257
–266
(2003). https://doi.org/10.1109/JSTQE.2003.811286 Google Scholar
N. Pfeiffer,
P. K.Y. Chan,
G. H. Chapman,
F. Vasefi, and
B. Kaminska,
“Optical imaging of structures within highly scattering material using a lens and aperture to form a spatiofrequency filter,”
Proc. SPIE, 6854 68541D
(2008). Google Scholar
L. V. Wang, and
H. Wu, Biomedical Optics: Principles and Imaging, Wiley, Hoboken, NJ
(2007). Google Scholar
F. Vasefi,
P. K.Y. Chan,
B. Kaminska,
G. H. Chapman,
N. Pfeiffer,
“An optical imaging technique using deep illumination in the angular domain,”
IEEE J. Sel. Top. Quantum Electron., 13 1610
–1620
(2007). Google Scholar
F. Vasefi,
M. Belton,
B. Kaminska,
G. H. Chapman, and
J. J. L. Carson,
“Angular domain fluorescence imaging for small animal research,”
J. Biomed. Opt., 15 016023
(2010). https://doi.org/10.1117/1.3281670 Google Scholar
P. K. Y. Chan,
F. Vasefi,
G. H. Chapman,
B. Kaminska, and
N. Pfeiffer,
“Multispectral angular domain optical tomography in scattering media with argon and diode laser sources,”
Proc. SPIE, 6435 64350M
(2007). Google Scholar
S. T. Flock,
S. L. Jacques,
B. C. Wilson,
W. M. Star, and
M. J. C. van Gemert,
“Optical Properties of Intralipid: a phantom medium for light propagation studies,”
Lasers Surg. Med., 12 510
–519
(1992). https://doi.org/10.1002/lsm.1900120510 Google Scholar
H. G. van Staveren,
C. J. M. Moes,
J. Marle,
S. A. Prahl, and
M. J. C. van Gemert,
“Light scattering in Intralipid-10% in the wavelength range of 400–1100 nanometers,”
Appl. Opt., 30 4507
–4514
(1991). https://doi.org/10.1364/AO.30.004507 Google Scholar
F. Vasefi,
B. Kaminska,
G. H. Chapman, and
J. J. L. Carson,
“Angular distribution of quasi-ballistic light measured through media using angular domain optical imaging,”
Proc. SPIE, 7175 717509
(2009). Google Scholar
G. H. Chapman,
J. Rao,
T. C. K. Liu,
P. K. Y. Chan,
F. Vasefi,
B. Kaminska, and
N. Pfeiffer,
“Enhanced angular domain imaging in turbid media using Gaussian line illumination,”
Proc. SPIE, 6084 60841D
(2006). Google Scholar
F. Vasefi,
P. K. Y. Chan,
B. Kaminska, and
G. H. Chapman,
“Subsurface bioimaging using angular domain optical backscattering illumination,”
1932
–1936
(2006) Google Scholar
F. Vasefi,
B. S. L. Hung,
B. Kaminska,
G. H. Chapman, and
J. J. L. Carson,
“Angular domain optical imaging of turbid media using enhanced micro-tunnel filter arrays,”
Proc. SPIE, 7369 73691N
(2009). Google Scholar
E. Hecht, Optics, Addison-Wesley, San Francisco; London
(2002). Google Scholar
F. Vasefi,
E. Ng,
B. Kaminska,
G. H. Chapman, and
J. J. L. Carson,
“Effect of time gating and polarization discrimination of propagating light in turbid media during angular domain imaging (ADI),”
Proc. SPIE, 7182 718217
(2009). Google Scholar
|
|||||||||||||||||||||||||||||||||||||||||||||||||||||||||||||||||||||||||||||||||||||||||||||||||||||||||||||||||||||||||||||