|
|
1.IntroductionCapnography has critical applications in clinical situations. It can be deployed to reflect the O2 and CO2 metabolism of the human subject.1, 2, 3, 4 Because of the problems inherent in the side-stream structure of current respiratory devices, as well as the maturity of nondispersive infrared (NDIR) technology in the area of gas measurement, the mainstream structure for monitoring CO2 concentration has been proposed and applied.5 Mainstream CO2 concentration detecting methods require the CO2 concentration detecting module to be directly placed in the respiratory system of the patient, so that its sensors can directly monitor CO2 concentration.6 Because the value of CO2 concentration collected is subtle and subject to the affects of noise, and because the temperature drift in the system is inevitable,7, 8 we have analyzed in depth the normal CO2 concentration value. In an effort to acquire high precision values of CO2 concentration in real time, we have designed and experimented, with respect to the optical channel, hardware filters, digital signal processing(DSP) algorithms, and offsets to temperature drift. Under different room temperatures, by testing the respiration of a large number of people, we find that system can acquire stable and precise values of CO2 concentration when used continuously. 2.Gas Channel and Detecting Components2.1.Main Detecting Channel DesignGas molecules absorbing infrared light of specific wavelengths is reflected by the Lambert- Beer law.9, 10 If the CO2 is lit by IR light from one side of the gas room where the CO2 is stored, sensors at the opposite side of the room can detect the magnitude of attenuation of the IR light. By doing so, we can find the change of the CO2 concentration. According to the Lambert-Beer law, we can obtain:
[TeX:]
\documentclass[12pt]{minimal}\begin{document}\begin{equation*}
I = I_0 \exp (- \mu CL),
\end{equation*}\end{document}
where
[TeX:]
$I_0$
is the intensity of the incident light, I is the intensity of the emergent light, μ is the gas absorption coefficient, C is the gas concentration, and L is the thickness of gas.Normal human respiratory gas is a mixture of various gases. The value varies according to the specific type of gas. The absorption relationship for gas I can be defined by:
[TeX:]
\documentclass[12pt]{minimal}\begin{document}\begin{equation*}
I = I_0 \exp \left(- \sum {\mu _i C_i L}\right).
\end{equation*}\end{document}
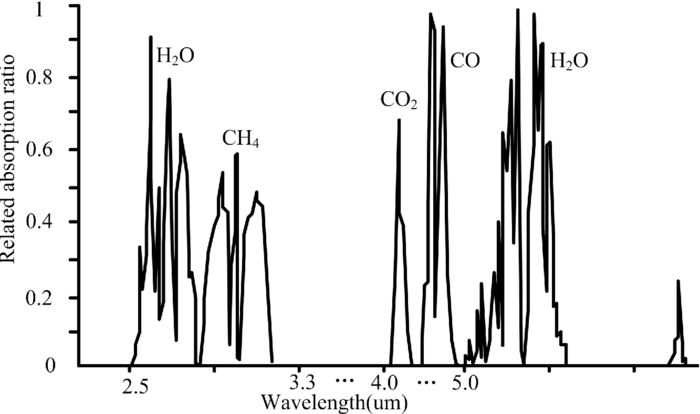
Figure 1 indicates the related absorption ratio for different gases. The peek value for CO2 absorption is approximately 4.26 μm.11, 12, 13 If there is only light with a wavelength of 4.26 μm in the testing channel, the absorption relationship is approximately:
[TeX:]
\documentclass[12pt]{minimal}\begin{document}\begin{equation*}
I = I_0 \exp (- \mu _{{\rm CO}_2 } C_{{\rm CO}_2 } L).
\end{equation*}\end{document}
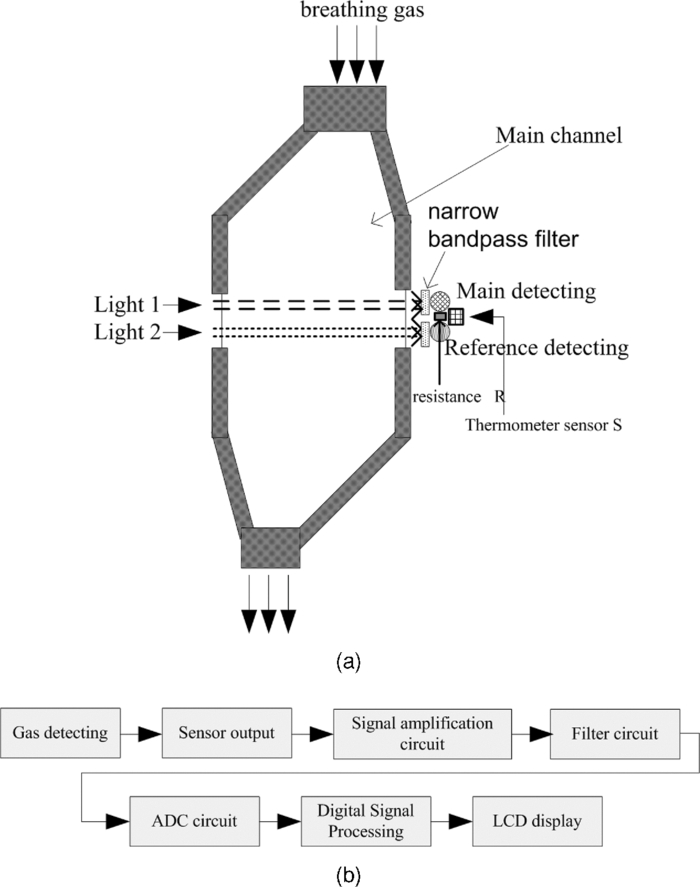
A narrow bandpass filter with a 4.1- to 4.3-μm bandpass has been installed at the front end of the IR sensor to enhance the precision of the measurement. To obtain the value of I, a set of reference light sources and sensors are needed in the detecting channel. The constitution of gas that has an absorption peak value of 4.0 μm is very stable, and thus a narrow bandpass filter with a 3.8- to ∼4.1-μm bandpass could be installed at the front end of the IR sensor. Figure 2 shows in detail the layout of the testing channel. In this testing channel, we use double light sources and double light sensors, which enable complete separation of the light path for measurement and for reference. Both the light sources and the sensors work at different wavelengths, and thus reduce their interference within the system. The entry is not in line with the exit openings for the gas. Besides, the size of the entry is 1.5 times as large as that of the exit. Both of these features prevent the gas from passing, the channel too quickly to make complete contact with the sensors. This is beneficial for a thorough measurement of the gas changes. Figure 2(b) is the block diagram for the monitoring system. The respiratory gas is detected by the sensor, the output of which is later fed into the signal amplification circuit. After that, the signal passes a filter and an AD convertor, and finally the digital processing unit, which is a DSP, processes the quantized values with advanced algorithms. The value of CO2 concentration and other relevant information will be displayed on the LCD display. 2.2.Sampling and Controll in the Detecting Channel2.2.1.Compensation for respiratory attenuationIn the detecting system, photons are produced by the light sources. When they flow to the sensors at the opposite side, an electrical signal is produced. In a real-world situation, due to the affect that low air exerts on the photons, the signal will be affected as a result. In particular, the signal will be attenuated. Figure 3 shows how air flow can affect the receipt of photons by sensors. When the air is still, the voltage of both the main detecting end and the reference end are stable. By contrast, when there is air flow in the gas room, because of the impact exerted by respiration on the photons, the signal generated by both the main detecting end and the reference end will become attenuated. Consequently, the values acquired at both the main detecting end and the reference end cannot be deployed when CO2 concentration is to be calculated. We now define the intensity of the incident light as [TeX:] $I_0$ , the voltage at the main detecting end is [TeX:] $v_m$ when respiration is dismissed, and the reference end has a voltage of [TeX:] $v_m$ when respiration is dismissed. Since gas with a peak of 4.0 μm does not participate in respiration, it is stable during the process of human respiration. If the reference end has an output of [TeX:] $v_f$ , the main detecting end has an output of [TeX:] $v_m$ , and the air flow in the channel has a speed of v, we can obtain the attenuation rate:
[TeX:]
\documentclass[12pt]{minimal}\begin{document}\begin{equation*}
\eta = \frac{{v_f - v'_f }}{{v'_f }}.
\end{equation*}\end{document}
Hence, when there is no respiration, the stable output of the main detecting end is:
[TeX:]
\documentclass[12pt]{minimal}\begin{document}\begin{equation*}
v''_m = \frac{{v_m }}{{1 - \eta }} = \frac{{v_m v'_f }}{{2v'_f - v_f }}.
\end{equation*}\end{document}
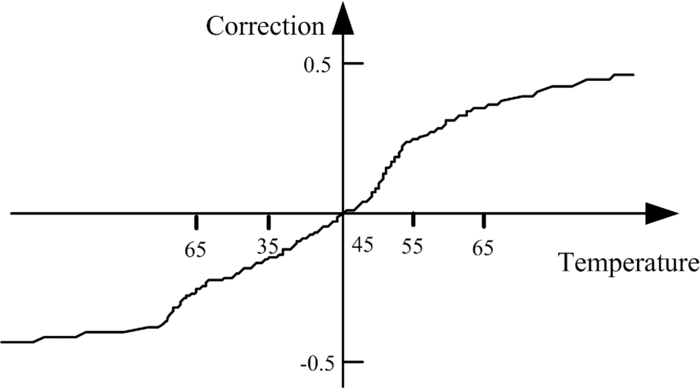
Currently, the CO2 concentration value is: where k is a constant for concentration calculation.2.2.2.Light source controlIn an effort to limit detecting distortion and to acquire data that reflects gases with wavelengths of 4.26 and 4.0 μm, respectively, it is desirable that the light source generate IR light with the different wavelengths. To meet these ends, the system uses the Parabola series provided by ICX Photonics(Cambridge, Massachusetts).14 IR light with wavelengths of 4.26 and 4.0 μm can be obtained respectively by using a couple of Parabola light sources. Because the Parabola series focuses energy within a specific range of angles, it is critical that the light sources and the sensors be installed in the appropriate locations. The axis of the light beam should be adjusted to aim at the center of the sensor so that the energy of a specific range of light spectrum can be focused to the sensor (see Fig. 4). Therefore, when the concentration of the gases changes in the testing channel, such changes can be reflected clearly by the sensors. The system can achieve very high detecting performance, and meanwhile the distortion is reduced. 2.2.3.Temperature compensationThe double-end sensor used by the system is the IR sensor. The sensor, which captures radiation energy, is a technologically mature thermopile sensor. The thermopile is manufactured by IC and MEMS technologies. It can be liken to a series of thermocouples. The temperature detecting point of the thermopile will rise as a result of its capturing IR radiation. The Thomson voltage will also be generated, because there is a temperature gradient in the same conductor of the thermocouple. At the joint of the two kinds of metals, voltage is generated, as there is a difference between the electric concentration on one conductor and that on the other. Therefore, there is a thermoelectric voltage between one terminal of the thermocouple and the other.15, 16 The CO2 concentration detecting sensor captures the IR energy of the wave with a wavelength of 4.23 μm. The temperature gradient is formed at the thermocouple circuit inside the sensor, and therefore the value of the voltage change is obtained. When the concentration is being detected, because of the rise of temperature at the thermocouple as a result of the light coming from the opposite side, the affects that respiratory air flow exerts on the temperature of the sensor, the emiting of energy by the detecting circuit, and other external factors, the subsequent subtle change of the temperature will lead to errors in measurements by the sensor. Accordingly, it is imperative that we compensate for the temperature change caused by the factors mentioned before to more accurately detect CO2 concentration. Given the state where the concentration remains stable, if the device is heated, by observing the main detecting end of the sensor, we will find that there are subtle temperature drifts [TeX:] $\Delta V_m$ and [TeX:] $\Delta V_r$ at the main detection end and reference end, respectively. Based on the temperature compensation property the sensor itself possesses, drift values of signals under different temperatures can be normalized under a reference temperature and processed by parameter fitting in the system, as shown in Fig. 5. We fit the temperature to 45- deg centigrade, and the corresponding resistance of the sensors is 15 K. According to the drift values, when the temperature sampled by sensors changes, the system can correct subtle signal drift caused by temperature changes in real time. 3.Signal Analysis and Processing3.1.Signal AnalysisBecause of myriad interferences when the signal is being sampled, detecting precision is negatively affected as follows.
For the detecting devices to obtain a precise signal, the data must be processed with respect to the hardware and algorithms. 3.2.Signal ProcessingThe signal reflecting CO2 concentration is obviously unstable. It can be categorized by a short process, which happens abruptly. By frequency analysis, we know that the energy distributes in a range with an upper limit of 10 Hz, as shown in Fig. 6. To acquire a more precise signal, we need to use advanced filtering algorithms for signal processing shortly after the signal is processed by the circuits. The denoising method based on Fourier transformation entails that the signal and noise share as narrow an overlap bandwidth as possible. In this way, denoising can be realized by time-invariant filters. However, when the overlap exists to a great extent, this approach is inappropriate. Wavelet analysis, a novel time-domain analysis method, provides effective tools because of its time-frequency localization property. Since signals can be depicted by wavelet coefficients, those with greater wavelet coefficients carry more energy, and vice versa. Therefore, the weight the wavelet coefficient carries can be measured by the energy the signal carries. In comparison with the wavelet transform, the wavelet packet transform provides an even more complicated and flexible approach, because it decomposes the high-frequency and low-frequency parts of the previous level simultaneously. In this sense, it possesses the ability to do precisely local analysis. In this work, the signal reflecting CO2 concentration is processed by filtering process algorithms based on the wavelet packet.17, 18, 19 We follow these procedures.
4.Experiments4.1.Experiment 1Experiment 1 focuses on a standard CO2 experiment. At an ambient temperature of 25°C, atmospheric pressure of 101.325 kPa (760 mmHg) and standard CO2 gas concentration of 5%, respectively, the gas flow is 1.5, 2.0, and 2.5 L/min for the experiment. The standard gas experiment data are shown in Table 1. Data for the table were collected from three velocity cases—maximum, minimum, and average. Deviation range is less than 3.5%. Table 1Standard gas experiment values.
4.2.Experiment 2Experiment 2 focuses on the effect of the temperature compensation. After settling the temperature of the novel capnograph to a certain value, the CO2 signal is measured and processed. The temperature can be reflected by the value of thermal resistance. When the value of resistance presented as 15 K(45°C) and 20 K (60°C), we tested the respiration of a 30-year-old man, and got the result shown in Fig. 7. After the process of temperature compensation algorithm, the maximum derivation in 15 K is 3.1%, and average derivation is 1.2%; and the maximum derivation in 20 K is 3.2%, and average derivation is 1.3%. The experiment also tested the signal with other resistance values, and received similar derivations, which indicates that the novel method proposed in this work can reduces the temperature drift and controls the average derivation under 1.4%. 4.3.Experiment 3Experiment 3 focues on the filtering performance and the signal detail preservation performance of the novel capnograph. Because we have adopted advanced signal processing algorithms in this work, the details of the signal of the respiratory gases are better retained than the side-stream capnograph does. The experiment uses Oxycon Pro(Care Fusion, San Diego, California) to generate a relatively complex breath waveform—hackle graph, which is detected simultaneously by a common side-stream capnograph and a new capnograph with a mainstream structure. With respect to the general waveform, as shown in Fig. 8, the new capnograph approximates much better the Oxycon Pro than the common side-stream capnograph does. A closer look at the details of the signals (as circled in Fig. 8) reveals that the new capnograph can quickly track the signal with high accuracy when it changes violently. By contrast, the common side-stream capnogragh introduces distortions to a great extent when the signal changes violently with great detail. 4.4.Experiment 4Experiment 4 focuses on the novel capnograph detecting effect on special cases. This work has done some further clinical experiments on a platform groove cracking patient (restoration of spontaneous breathing) and an iceberg graph patient (disappearance of muscle-relaxant side effect), as shown in Fig. 9. From the figure, it can be concluded that the device can detect the key point in special cases (as pointed in the figure). 4.5.Experiment 5Experiment 5 focuses on the clinical research of a novel capnograph. This work selected 100 patients with different ages (from 3 to 80) to perform the clinical experiment. The result shows that the novel device can achieve a similar accuracy compared with the standard Oxycon Pro, with maximum derivation of 3.43% and average derivation of 3%. Accordingly, the design method and compensation filtering algorithm proposed have played a key role in increasing the accuracy of the measurement. From the measuring results it can be concluded that the novel capnograph reaches the same accuracy with the side-stream device. 5.ConclusionsThis work takes into consideration various interferences and unstable factors of CO2 concentration monitoring devices, and proposes a novel device with the mainstream structure. We take into account the speed of the gas flow, the temperature drift inherent in sensors, signal interference, and other factors. We add innovative improvements to such procedures as device structure designing, digital processing algorithms, etc. The experiment results indicate that various interference and unstable factors are adequately reduced. The device is able to work in a real-time, continuous, and stable way, with distortion less than 3.5%. Therefore, this device is worth noticing and applying, specifically in clinical areas. References
C. I. Mark,
M. Slessarev,
S. Ito,
“Precise control of end-tidal carbon dioxide and oxygen improves BOLD and ASL cerebrovascular reactivity measures,”
Mag. Res. Med., 64
(3), 749
–756
(2010). https://doi.org/10.1002/mrm.22405 Google Scholar
M. Pokorna,
E. Necas,
J. Kratochvil,
“A sudden increase in partial pressure end-tidal carbon dioxde (PETCO2) at the moment of return of spontaneous circulation,”
J. Emerg. Med., 38
(5), 614
–621
(2010). https://doi.org/10.1016/j.jemermed.2009.04.064 Google Scholar
E. Kelmer,
L. C. Scanson,
A. Reed,
“Agreement between values for arterial and end-tidal partial pressures of carbon dioxide in spontaneously breathing, critically ill dogs,”
JAYMA-J. Am. Vet. Med. Assoc., 235
(11), 1314
–1318
(2009). https://doi.org/10.2460/javma.235.11.1314 Google Scholar
S. Grmec,
M. Golub,
A. Jelatancev,
“Relationship between mean arterial pressure and end-tidal partial pressure of carbon dioxide during hemorrhagic shock and volume resuscitation,”
Signal Vitae, 4
(1), 24
–26
(2009). Google Scholar
F. J. T. Neto,
A. B. Carregaro,
R. Mannarino,
“Comparison of a sidestream capnograph and a mainstream capnograph in mechanically ventilated dogs,”
J. Am. Vet. Med. Assoc., 221
(11), 1582
–1585
(2002). https://doi.org/10.2460/javma.2002.221.1582 Google Scholar
A. Biedler,
W. Wilhelm, and
F. Mertzlufft,
“Portable capnographs in emergency care: a comparison of equipment,”
Anaesthesiol. Reanim., 24
(3), 71
–78
(1999). Google Scholar
H. Y. Bang,
K. C. Kim,
B. H. Kang,
“Characteristics of transcutaneous pCO(2) gas sensor based on LiF glass using soft lithography,”
Sensors Mat., 19
(8), 465
–476
(2007). Google Scholar
I. Y. Park,
H. J. Park,
J. W. Lee,
“A proposal of effective compensation method for IR lamp deterioration in NDIR type capnograph systems,”
IEICE Trans. Fund. Electron. Commun. Computer Sci., E86A
(6), 1513
–1516
(2003). Google Scholar
L. Wei,
F. Zhang, and
Z. G. Liu,
“CO2 detection based on infrared tunable diode laser absorption spectroscopy,”
2nd Intl. Symp. Test Auto. Instrum., 17
–21
(2008). Google Scholar
R. K. Gong,
L. Chen, and
S. P. Nian,
“A new method to improve the precision of SO2 measurement in atmosphere,”
4th Intl. Symp. Instrum. Sci. Technol., 1162
–1166
(2006). Google Scholar
L. J. Santos,
J. Varon,
L. Pic-Aluas,
“Practical uses of end-tidal carbon dioxide monitoring in the emergency department,”
J. Emerg. Med., 12
(5), 633
–644
(1994). https://doi.org/10.1016/0736-4679(94)90416-2 Google Scholar
R. J. Solomon,
“A reliable, accurate CO2 analyser for medical use,”
Hewlett Packard J., 32
(9), 2
–21
(1981). Google Scholar
K. R. Ward, and
D. M. Yealy,
“End-tidal carbon dioxide monitoringin emergency medicine, part 1: basic principles,”
Acad. Emerg. Ed., 5
(6), 628
–636
(1998). https://doi.org/10.1111/j.1553-2712.1998.tb02473.x Google Scholar
M. U. Pralle,
I. Puscasu,
J. Daly,
“Narrowband infrared emitters for combat ID,”
Conf. Infrared Technolo. Appl., 6542 Z5422
–Z5422
(2007). Google Scholar
P. Lin,
C. Y. Wu,
Y. M. Chens,
“Fabrication and characterization of a three-dimensional flexible thermopile,”
Japan. J. Appl. Phys., 47
(3), 1787
–1793
(2008). https://doi.org/10.1143/JJAP.47.1787 Google Scholar
S. J. Lee,
Y. H. Lee,
S. H. Suh,
“Uncooled thermopile infrared detector with chromium oxide absorption layer,”
Sensors Actuators, 95
(1), 24
–28
(2001). https://doi.org/10.1016/S0924-4247(01)00743-9 Google Scholar
S. Pal,
S. K. Pal, and
A. K. Samantaray,
“Neurowavelet packet analysis based on current signature for weld joint strength prediction in pulsed metal inert gas welding process,”
Sci. Technolo. Weld. Join., 13
(7), 638
–645
(2008). https://doi.org/10.1179/174329308X299986 Google Scholar
Y. Yin,
H. C. Yu, and
H. S. Zhang,
“A feature extraction method based on wavelet packet analysis for discrimination of Chinese vinegars using a gas sensors array,”
Sensors Actuators B-Chemi., 134
(2), 1005
–1009
(2008). https://doi.org/10.1016/j.snb.2008.07.018 Google Scholar
S. A. Saleh and
M. A. Rahman,
“Testing of a wavelet-packet-transform-based differential protection for resistance-grounded three-phase transformers,”
IEEE Trans. Industry Appli., 46
(3), 1109
–1117
(2010). https://doi.org/10.1109/TIA.2010.2046293 Google Scholar
|