
|
|
1.IntroductionIschemic stroke is the third leading cause of death in the United States and has a tremendous impact on subsequent quality of life for the victim. Approximately 50% of stroke victims have loss of muscle function on one side of the body, 30% are unable to walk, and 26% require daily attention to perform normally routine tasks. To minimize the impact of stroke, rapid therapeutic intervention is required to restore blood flow to the impacted region. However, only 3 to 5% of clot-forming (i.e., ischemic) stroke victims reach the hospital in time to receive “clot-busting” drug therapy. Acute treatments for stroke are still severely limited. Neuroprotective drugs under development show promise at halting the ischemic cascade, but as yet, the record of neuroprotective agents in human clinical trials has still been remarkably disappointing and no such compound has received U.S. approval.1 One of the biggest limitations to this development is the lack of understanding of the mechanisms by which cerebral blood flow adapts and the cerebral vessel reacts to environmental insults2 (such as ischemia, inflammation, trauma, blood pressure changes, and metabolic stressors). To improve the long-term outcome of the vast majority of stroke victims, there is a critical need to address these fundamental questions. The process of drug development becomes more reliant on high-throughput longitudinal studies using small animals. Various techniques have been used to visualize cerebral hemodynamics and to quantify the blood flow within localized regions of brain activity for small animal studies, such as positron emission tomography (PET), intrinsic signal optical imaging (ISI), laser Doppler perfusion imaging (LDPI), functional magnetic resonance imaging (fMRI), and two-photon microscopy. High spatial resolution, of the order of micrometers, is necessary to distinguish different vascular components (arterioles, capillaries, venules) and individual columns of brain, which are about 100 to 200 μm2 in tangential size. The current resolutions of PET, LDPI, and fMRI are too low to distinguish these components. Although ISI can map out en face cortical hemodynamics and columns, depth resolution is not available.3 Two-photon microscopy has been used for mapping cortical activity.4 However, flow measurement requires fluorescent dye injection, which can be problematic, if the objective is to image blood flow changes induced by pharmacological agents. Optical coherence tomography5 (OCT) has recently emerged as a fundamentally new type of optical imaging modality. OCT performs high-resolution, cross-sectional tomographic imaging of internal microstructure in materials and biological systems by measuring backscattered light. Doppler optical coherence tomography (DOCT), combines the Doppler principle with OCT for tomographic imaging of tissue structure and blood flow, simultaneously.6, 7 The noninvasive high-resolution tomographic capabilities of OCT make it a promising technique for mapping depth-resolved microvasculature in human retina and choroids and in cortical vessels for small animal studies.8, 9, 10 OCT-based 3-D angiography can be used to monitor changes in the blood volume, which has been demonstrated to correlate with the changes in metabolic demand and subsequent hemodynamic cascades following neuronal activation.3, 11, 12 In this paper, we demonstrate the use of spectral Doppler OCT imaging13 (SDOCTI) to quantify blood circulation and flow resistance before and after a localized ischemic stroke in a mouse model. Rose Bengal photodynamic therapy (PDT) was used as a noninvasive means for inducing localized ischemia in cortical microvasculature. SDOCTI provides the temporal blood flow information, which is complementary to the spatially distributed flow information of 3-D angiography. Fast DOCT scans across a vessel of interest were performed to record flow dynamic information with a high temporal resolution of the cardiac cycles. Doppler-angle-independent flow indices were extracted to quantify the vascular conditions before and after a photocoagulation (light-induced clotting) event caused by photoactivation of Rose Bengal. For comparison, in vivo laser-speckle imaging (LSI) of the mouse brain cortex through a moistened, intact skull were also utilized. 2.Materials and Methods2.1.Preparation of Animal and PDTFollowing immobilization using an isofluorane-oxygen mixture, C3H mice were anesthetized using a combination of ketamine and xylazine. The depth of anesthesia was ascertained by pinching of the toes or tail and by monitoring rate of breathing. Prior to exposing the skull, the hair above and around the area was removed with a depilatory cream. Once the mouse was stably positioned into the stereotactic frame, the scalp of the mouse was removed and saline was used to moisten the skull such that LSI and OCT could then be used to acquire raw images of the cerebral microvasculature before, during, and after the photocoagulation event. To produce the photocoagulation event, 0.4 mL of 1% (m/v) Rose Bengal was injected intraperitoneally.14, 15 Following administration, the photosensitive dye was allowed to circulate for 5 min. A target region of microvasculature, which was selected based on an initial LSI image portraying the baseline blood flow map, was then irradiated with green laser light (λ = 532 nm; laser power P ∼ 6.5 mW) for 15 min to photoactivate the chemical and induce ischemia in the mouse brain cortex [Fig. 1]. All experiments were carried out in accordance with the Institutional Animal Care and Use Committee at the University of California, Irvine, and were consistent with federal guidelines. Fig. 1Experimental setup of (a) photocoagulation by a 532-nm green laser and (b) laser speckle imaging by a HeNe laser. The insert shows an intact C3H mouse skull with the scalp removed.  PDT can be loosely defined as the process of administration of a nontoxic drug or dye known as a photosensitizer systemically, locally, or topically, followed by illumination of a target region to activate a cascade of events initiated by the generation of reactive oxygen species. Over the past 2 decades, studies have suggested that Rose Bengal PDT can be used as a noninvasive means of producing photocoagulation to selectively induce an ischemic lesion in a targeted region.16 Rose Bengal, a photosensitive dye, when irradiated at the proper wavelength will activate and consequently release free radical singlet oxygen atoms that essentially attack the endothelium of blood vessels. This, in turn, activates platelet formation and simultaneously produces secondary ischemia and occlusion in the irradiated area.17 In the future, it may possible to develop a rapid therapeutic treatment, perhaps in conjunction with other types of therapy, to help minimize the tremendous impact of ischemic stroke or transient ischemia attack modeled by PDT. 2.2.OCT-Based Spectral Doppler Imaging/LSITo better monitor the imaging outcomes, LSI was taken before and after OCT image acquisition. The LSI instrument consists of a 633-nm, 30-mW HeNe laser and a thermoelectrically cooled 12-bit monochrome CCD camera with a macro lens. The technique of LSI is a method of wide-field imaging capable of producing high-resolution spatiotemporal in vivo maps. Laser speckle is a random interference pattern created by scattered laser light.18 Scattering by moving particles, such as blood, creates a blurring of the speckle pattern, which can then be captured onto a CCD camera [Fig. 1]. Image data are thus acquired and subsequently processed using custom LabVIEW software. Speckle contrast maps are obtained as an average of processed raw speckle maps to visualize relative blood flow within a particular field of view. LSI is an efficient means of dynamic, real-time microvascular blood flow imaging that helps visualize blood flow dynamics and monitor relative flow changes in response to the application of exogenous agents, which in this study was Rose Bengal.19 More specifically, LSI was used to qualitatively examine and image the spatial and temporal characteristics of the cerebral blood flow response, facilitating the study of the effects of drug-induced modulations of the brain. Figure 2 shows a schematic of the OCT system used in this study. Low-coherence light having a 1310-nm center wavelength with a full width at half maximum of 95 nm was coupled into the source arm of a fiber-based Michelson interferometer. Back-reflected lights from the reference and sample arms were guided into a spectrometer. The dispersed spectrum by a diffraction grating (500g/mm) was sampled by the spectrometer with a 1×1024 InGaAs detector array (SU1024-1.7T, Sensors Unlimited) at 7.7 kHz. The wavelength range on the array was 130 nm, corresponding to a spectral resolution of 0.13 nm and an imaging depth of 3.6 mm in air. For Doppler flow measurement of the OCT system, the maximum longitudinal velocity that corresponded to a phase difference of π was determined to be ±1.8 mm/s according to V max = ±λ/(4nT), where T is the line period of the CCD camera, and n is the tissue refractive index. The minimum detectable flow velocity of the system was determined by the phase noise in the system and measured by imaging steady state scattering flow of a polystyrene bead solution with mean diameter of 0.3 μm and volume concentration of 0.26% pumped at different velocities. The longitudinal velocity sensitivity was ∼154 μm/s by fitting the velocity profile and calculating the standard deviation for the velocity image across the center of the vessel. Fig. 2Schematic of the OCT system (FL, focusing lens; DG, diffraction grating; CM, collimator; LSC, line-scan camera; SLD, superluminescent diode). 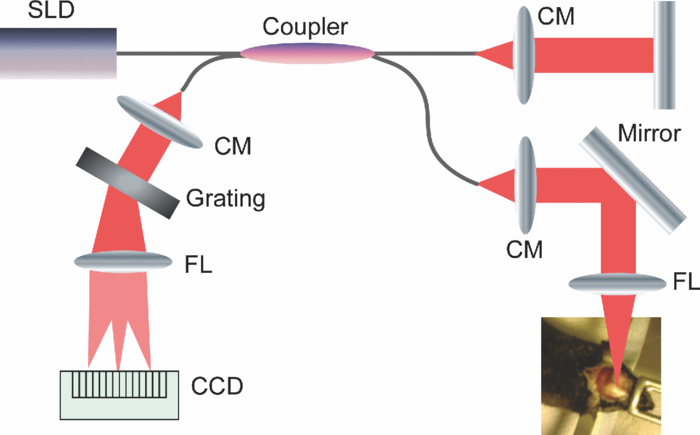 In this study, the mouse model was used as a platform to investigate the microvasculature change before and after photochemical induction of a localized ischemic stroke. Repeated DOCT scans across a few selected vessels were performed to get 2-D Doppler flow maps of a certain time period, which provides an accurate estimation of 2-D flow dynamics across the vessels. Spectral Doppler analysis of continuous Doppler images demonstrates how the velocity components and longitudinally projected flow-volume-rate change over time for scatters within the imaging volume using spectral Doppler waveforms.13 Various velocity envelope curves can be derived from spectral Doppler waveforms and used to extract the corresponding pulsatility index, resistance index (RI), and several other indices that can provide interpretable Doppler-angle-independent information needed to quantify the pulsatile nature of blood flow. An in vitro experiment conducted with ultrasound has demonstrated a higher vascular resistance value associated with a higher RI measurement assuming the constant compliance of vascular tube.20 3.ResultsThe first experiment was performed to demonstrate that Rose Bengal PDT can be used to effectively reduce cerebral blood flow in target regions of microvasculature. Five minutes after Rose Bengal administration, laser irradiation was targeted at a general region of microvasculature (labeled with a circle in Fig. 3.), and LSI was taken every 5 min. Noticeable reduction in flow in the mouse treated with Rose Bengal PDT was observed in the irradiated region, and the reduction was localized to the site where laser irradiation was delivered. As a control for the chemical used, mice were administered with Rose Bengal, at the same dosage, but were not given irradiation. In preliminary trials, a control for laser light was also performed in which mice receiving no chemical injection but receiving irradiation were imaged. It is interesting how such a dramatic decrease in flow (as in Fig. 3) was not observed in the controls (results not shown). One can extrapolate that irradiation of Rose Bengal is necessary to produce the coagulation events that block vascular blood flow, since the controls, in comparison, did not experience the drastic, retained decline in flow. Fig. 3Time-elapsed mean speckle contrast maps for a representative trial of PDT, targeting a localized region of microvasculature: (a) baseline, (b) after 5-min irradiation, (c) after 10-min irradiation, and (d) after 15-min irradiation. These contrast maps represent the average of 10 raw LSI images. All figures shown are scaled to the same color bar, where black corresponds to regions of minimal blood flow and white corresponds to regions of higher blood flow. (All scale bars represent 1 mm).  Figure 4 shows a reflectance image of the intact mouse skull before PDT. For SDOCTI, repeat DOCT scans were performed across picked vessels. For example, two vessels at two different positions labeled with red (vessel 1) and yellow (vessel 2) lines in Fig. 4 were scanned repeatedly. Figures 4 and 4 show the cross-sectional DOCT images of vessel 1 and vessel 2, respectively. Both of them are arteries. The diameter of vessel 1 is about 0.46 mm and that of vessel 2 is 0.5 mm. Figure 4 shows the laser speckle flow index map before PDT laser coagulation18 by LSI. The laser illuminating spots for PDT were labeled with a red circle in the figure. Typical cross-sectional OCT and DOCT images along a wider scanning range as labeled by the green line in Fig. 4 are shown in Figs. 4 and 4, respectively. Fig. 4(a) Reflectance image and (d) laser speckle flow index map of an intact mouse skull before PDT, with the irradiated target region highlighted by a red circle. Repeated SDOCTI scans are taken at the positions labeled by red and yellow bars, respectively. (b) and (c) DOCT images of the two vessels and (e) and (f) typical OCT and DOCT images at the cross-sectional position labeled with a green line in (a), respectively. (All scale bars represent 1 mm.)  To demonstrate the use of SDOCTI for quantitative evaluation of microvasculature blood circulation, two sequential Rose Bengal PDTs were followed to induce enhanced vascular coagulation. Both LSI and SDOCTI were taken before and ∼15 min after each PDT trial. Each PDT takes about 5 min for alignment and 15 min for photoactivation. Then it takes about 20 min for LSI and SDOCTI alignment/imaging. Figures 5, 5, 5 show the qualitative laser speckle images of the intact mouse skull and clearly demonstrate the overall reduced vascular blood flow with laser coagulations by the irradiation of Rose Bengal. LSI was optimized in the experiment to qualitatively examine and image the spatial and temporal characteristics of the cerebral blood flow response. One can notice that the LSI dynamic range setup of Fig. 5 is slightly different as that in Fig. 3 of a different experiment. However, for each experiment we tried to maintain the same dynamic range of all LSIs for a better comparison. Fig. 5Laser speckle flow index maps of the mouse skull (a) before PDT, (b) 15 min after the first PDT, and (c) 15 min after the second PDT, respectively. SDOCTI of vessel 1 [red line in (a)] (d) before PDT, (e) after first PDT of 15 min, and (f) after second PDT of 15 min; SDOCTI of vessel 2 (yellow) (g) before PDT, (h) after first PDT of 15 min, and (i) after second PDT of 15 min, respectively. (All scale bars represent 1 mm.)  Figure 5 shows the SDOCTI of vessel 1 before the PDT and 5 and 5 show the SDOCTI after each of the two PDT irradiations. The OCT imaging speed is 7.7 kHz A-lines/s. For each SDOCTI image, 250 consecutive B-scan images (of 128 A-lines each) were taken by scanning across the vessel repeatedly. Considering an 80% duty cycle of the galvoscanner, the total acquisition time (of 250 B-images) takes about 5 s, as labeled in Fig. 5. The temporal resolution of SDOCTI can be enhanced by scanning just enough dense A-lines to cover the vessel of interest. Given a fixed OCT acquisition speed and an optimized (transversal) scan density, the more cross-sectional B-scan images acquired within a given period of time, the better the temporal spectral Doppler analysis. To calculate the Doppler-angle-independent RI, the maximum velocity envelope curves were derived from spectral Doppler waveforms, as shown in Fig. 5. For each cardiac cycle in Fig. 5, symbol S represents the peak systolic maximum velocity and symbol D represents the end diastolic maximum velocity. The Doppler-angle-independent RI is calculated as RI = (S − D)/S for each cardiac cycle and then averaged for all 14 complete cycles covered in Fig. 5. The averaged (mean) RI and its standard deviation are then listed in Table 1. Statistic analysis of the velocity distributions of continuous Doppler images demonstrates how the velocity components and longitudinally projected flow-volume rate change over time for scatters within the imaging volume. Similarly, Figs. 5, 5, 5 show the SDOCTI change of vessel 2 before and after the PDT irradiations. It was previously demonstrated in Ref. 13 that the Doppler-angle-independent RI can be used to quantify the vasculature resistance of the examined microvasculature. For instance, an RI of ∼0.47 was measured before the photoactivation of Rose Bengal in vessel 1. An increased RI of 0.60 was measured after the first laser irradiation and then ∼0.7 after the second laser irradiation. The increase in RI is in great accordance with the laser speckle imaging results shown in Figs. 5 to 5. The increases in RI can be explained as the increased vascular resistance that was caused by the localized ischemic stroke. The RI changes clearly showed the blockage of the cortical blood vessels. Table 1Quantitative changes of the flow resistive indices for the two vessels before and after PDTs.
Table 1 summarizes the quantitative changes of the average values of RIs of the two vessels, and their standard deviation values before and after PDT irradiations. The small standard deviation value of RI compared to its mean value demonstrates that the quantification is reliable and repeatable. We noticed that different arteries of different positions may have slightly different RIs due to different vessel-to-stroke location, vascular wall elasticity, vessel diameter, or some other factors. For example, the absolute RI value of vessel 2 is slightly higher than that of vessel 1. This makes it challenging to use the absolute RIs to evaluate ischemia in real cases. However, longitudinal studies of relative RI changes (of the same vessels) may provide valuable information to study microcirculation change over time induced by PDT and/or pharmacological agents, and may find important applications in drug development and some other studies. Our previous studies in rodent window chamber and human retina imaging suggest that the same branch of vessels (of a similar position) should have similar RIs (of a certain distribution), however, more thorough investigation and more careful statistical analysis are necessary to justify this statement. The whole experiment for SLI, OCT, and PDTs lasted for about 1.5 to 2 h. During the experiment, we noticed that the effects of anesthesia began to wear after the first SLI and SDOCTI such that the animal was partially alert before first PDT, we had to add an additional injection (of a combination of ketamine and xylazine) to anesthetize the mouse in deeper sleep again. We noticed that the heart beat rate is decreasing in Fig. 5, which to our understanding was mainly due to the effects of anesthesia change. As anesthesia reinforcing or wearing off, changing of the heart beat rate might affect the absolute flow velocity and flow-volume rate. However, it should not cause an obvious change of the RI, since RI, calculating the ratio between the peak velocity change and peak systolic maximum velocity, is a quantitative evaluation of vascular resistance assuming that the vessel under investigation maintaining a similar compliance,20 which is a fair assumption in our experiment. 4.ConclusionInstead of directly measuring the blood volume change, this paper reports the use of SDOCTI to quantify the blood circulation change in a localized ischemic stroke mouse model. Rose Bengal PDT was used to impede/decrease blood flow in localized regions of the brain cortex in a relatively noninvasive mouse model. Both SDOCTI and LSI were used to evaluate the blood circulation change of the microvasculature before and after inducing ischemia via photocoagulation by PDT. Repeated B-scan DOCT images of selected vessels were acquired for SDOCTI, where a spectral Doppler waveform was generated and flow RIs were calculated. We correlated the RI measurements with the microvasculature change due to the photocoagulation. The higher RIs were associated with a higher resistance state that was accompanied by the localized ischemic stroke. While the lower RI was associated with a lower resistance state of the vessels. The preceding experiments suggest that by measuring the RI (or other flow indices) of a vessel with SDOCTI, it is possible to quantitatively evaluate the resistance change of a microvasculature network. Our previous experiments in the rodent window chamber model21 also suggested that SDOCTI can be used to monitor flow dynamic changes due to an acute upstream/downstream vasculature occlusion, while the regional blood volume measurement did not show significant changes. In another words, SDOCTI might be used to quantify and detect acute flow resistance changes before any blood volume change can be noticed. In summary, SDOCTI can provide complementary quantified flow information as an alternative to blood volume measurement. Vascular conditions can be quantified using Doppler-angle-independent flow indices, trends that can be qualitatively verified with LSI. As seen with the experiments discussed in this study, SDOCTI can be a useful means for cortical microvasculature imaging well-suited for small animal studies. AcknowledgmentsThis work is supported by the National Institutes of Health (EB-00293, EB-010090, RR-01192), and the Air Force Office of Science Research (FA9550-04-1-0101). Support from the Beckman Laser Institute Inc. Foundation is also gratefully acknowledged. ReferencesB. Ovbiagele,
C. S. Kidwell,
S. Starkman, and
J. L. Saver,
“Neuroprotective agents for the treatment of acute ischemic stroke,”
Curr. Neurol. Neurosci. Rep., 3 9
–20
(2003). https://doi.org/10.1007/s11910-003-0031-z Google Scholar
“Meeting Note: Cerebrovascular Biology and Disease, NHLBI Working Group,” National Institutes of Health,”
(2005). Google Scholar
R. D. Frostig,
E. E. Lieke,
D. Y. Ts’o, and
A. Grinvald,
“Cortical functional architechture and local coupling between neuronal activity and the microcirculation revealed by in vivo high-resolution optical imaging of intrinsic signals,”
Proc. Natl. Acad. Sci. U.S.A., 87 6082
–6086
(1990). https://doi.org/10.1073/pnas.87.16.6082 Google Scholar
D. Kleinfeld,
P. P. Mitra,
F. Helmchen, and
W. Denk,
“Fluctuations and stimulus-induced changes in blood flow observed in individual capillaries in layers 2 through 4 of rat neocortex,”
Proc. Nat. Acad. Sci. U.S.A., 95 15741
–15746
(1998). https://doi.org/10.1073/pnas.95.26.15741 Google Scholar
D. Huang,
E. A. Swanson,
C. P. Lin,
J. S. Schuman,
W. G. Stinson,
W. Chang,
M. R. Hee,
T. Flotte,
K. Gregory,
C. A. Puliafito, and
J. G. Fujimoto,
“Optical coherence tomography,”
Science, 254 1178
–1181
(1991). https://doi.org/10.1126/science.1957169 Google Scholar
Z. Chen,
T. E. Milner,
D. Dave, and
J. S. Nelson,
“Optical Doppler tomographic imaging of fluid flow velocity in highly scattering media,”
Opt. Lett., 22 64
–66
(1997). https://doi.org/10.1364/OL.22.000064 Google Scholar
Y. Zhao,
Z. Chen,
C. Saxer,
S. Xiang,
J. de Boer, J. Nelson,
“Phase resolved optical coherence tomography and optical doppler tomography for imaging blood flow in human skin with fast scanning speed and high velocity sensitivity,”
Opt. Lett., 25 114
–116
(2000). https://doi.org/10.1364/OL.25.000114 Google Scholar
S. Makita,
Y. Hong,
M. Yamanari,
T. Yatagai, and
Y. Yasuno,
“Optical coherence angiography,”
Opt. Express, 14
(17), 7821
–7840
(2006). https://doi.org/10.1364/OE.14.007821 Google Scholar
R. K. Wang and
L. An,
“Doppler optical micro-angiography for volumetric imaging of vascular perfusion in vivo,”
Opt. Express, 17 8926
–8940
(2009). https://doi.org/10.1364/OE.17.008926 Google Scholar
L. Yu and
Z. Chen,
“Doppler variance imaging for three-dimensional retina and choroid angiography,”
J. Biomed. Opt., 15 016029
(2010). https://doi.org/10.1117/1.3302806 Google Scholar
S. M. Narayan,
E. M. Santori, and
A. W. Toga,
“Mapping functional activity in rodent cortex using optical intrinsic signals,”
Cereb. Cortex., 4 195
–204
(1994). https://doi.org/10.1093/cercor/4.2.195 Google Scholar
S. M. Narayan,
E. M. Santori,
A. J. Blood,
J. S. Burton, and
A. W. Toga,
“Imaging optical reflectance in rodent barrel and forelimb sensory cortex,”
Neuroimage, 1 181
–90
(1994). https://doi.org/10.1006/nimg.1994.1003 Google Scholar
B. Rao,
L. Yu,
H. K. Chiang,
L. C. Zacharias,
R. M. Kurtz,
B. D. Kuppermann, and
Z. Chen,
“Imaging pulsatile retinal blood flow in human eye,”
J. Biomed. Opt., 13 040505
(2008). https://doi.org/10.1117/1.2967986 Google Scholar
M. Schroeter,
S. Jander, and
G. Stoll,
“Non-invasive induction of focal cerebral ischemia in mice by photothrombosis of cortical microvessels: characterization of inflammatory responses,”
J. Neurosci. Meth., 117 43
–49
(2002). https://doi.org/10.1016/S0165-0270(02)00072-9 Google Scholar
J. Lee,
M. Park,
Y. Kim,
K. Moon,
S. Joo,
T. Kim,
J. Kim, and
S. Kim,
“Photochemically induced cerebral ischemia in a mouse model,”
Surg. Neurol., 67 620
–625
(2007). https://doi.org/10.1016/j.surneu.2006.08.077 Google Scholar
P. H. Pevsner,
J. W. Eichenbaum,
D. C. Miller,
G. Pivawer,
K. D. Eichenbaum,
A. Stern,
K. L. Zakian, and
J. A. Koutcher,
“A photothrombotic model of small early ischemic infarcts in the rat brain with histologic and MRI correlation,”
J. Pharmacol. Toxicol., 45 227
–233
(2001). https://doi.org/10.1016/S1056-8719(01)00153-8 Google Scholar
S. T. Carmichael,
“Rodent models of focal stroke: size, mechanism, and purpose,”
NeuroRx, 2 396
–409
(2005). https://doi.org/10.1602/neurorx.2.3.396 Google Scholar
A. K. Dunn,
H. Bolay,
M. A. Moskowitz, and
D. A. Boas,
“Dynamic imaging of cerebral blood flow using laser speckle,”
J. Cerebr. Blood Flow Meth., 21 195
–201
(2001). https://doi.org/10.1097/00004647-200103000-00002 Google Scholar
B. Choi,
J. C. Ramirez-San-Juan, and
J. Lotfi,
“Linear response range characterization and in vivo application of laser speckle imaging of blood flow dynamics,”
J. Biomed. Opt., 11 041129-1
–7
(2006). https://doi.org/10.1117/1.2341196 Google Scholar
R. O. Bude and
J. M. Rubin,
“Relationship between the resistive index and vascular compliance and resistance,”
Radiology, 211 411
–417
(1999). Google Scholar
B. Rao,
W. Jia,
L. Yu,
B. Choi,
R. M. Kurtz,
J. S. Nelson, and
Z. Chen,
“Spectral Doppler imaging of micro-vasculature response to laser irradiation,”
Proc. SPIE, 7168 71681T
(2009). Google Scholar
|
|||||||||||||||||||||||||


