

|
|
1.IntroductionThe current standard for grading and staging of urothelial carcinoma (UC) of the bladder is histopathology: the pathologist's assessment of the bladder specimen obtained by transurethral resection or biopsies. However, various clinical scenarios would benefit from real-time endoscopic diagnosis, which cannot be provided by histopathology. First, for instance, when a bladder tumor is treated by electric coagulation or laser ablation, no tissue is harvested, and thus the urologist has to rely on his/her estimation of the stage and grade of that tumor without histopathological confirmation. This estimation of grade or stage often is inaccurate.1 Second, and likewise, in many centers currently, patients with a history of low grade nonmuscle invasive bladder cancer (NMIBC) with small recurrent bladder tumors are being followed-up by regular cystoscopy, instead of directly being treated by transurethral resection (i.e., no biopsy).2, 3 The possibility of determining grade or stage at the time of the cystoscopy would be very useful for both patient populations. A third example is a red lesion seen during cystoscopy, which can be either inflammation or carcinoma in situ (CIS). Currently, if the urine cytology is suspicious for bladder cancer, random and targeted biopsies need to be taken for these lesions to exclude CIS. This strategy leads to a significant proportion of unnecessary biopsies, which might be avoided by use of a reliable, real-time diagnostic technique. Grade is an important prognostic factor in predicting the biological aggressiveness of papillary UC of the bladder. It is the most important factor for progression in the European Organization for Research and Treatment of Cancer risk tables.4 Therefore, grade has a strong impact on the clinical management of NMIBC patients.5, 6 Grade is defined based on the degree of morphological changes in the bladder tissue. In normal tissue, the urothelium usually contains less than seven cell layers, has normal sized nuclei, and a well preserved polarity, whereas in papillary UC, the urothelium is broadened, shows higher mitotic activity, cytonuclear ratio is changed, and in high-grade tumors the polarity is also disturbed. The first three changes are more pronounced as the grade increases. Besides papillary UC with different grades, CIS is a high-grade flat lesion in which the urothelium is not per se broadened, shows high mitotic activity, severe disturbance in the cytonuclear ratio, and loss of polarity. Optical coherence tomography (OCT) is a high-resolution, cross sectional imaging technique that was studied for real-time endoscopic detection of bladder cancer.7, 8, 9, 10 The reported diagnostic accuracy is relatively high, with a sensitivity of 84 to 100% and specificity of 78 to 89%.9, 11, 12 For this, the OCT image is evaluated in a qualitative way (based on differences in grayscale levels and structural appearance),10 which requires training and thus makes the diagnosis dependent on the skills of the observer. Assessment of the stage (i.e., the depth of tumor invasion into the different bladder tissue layers) of a bladder tumor by means of this method appears to be feasible,9 but grade is difficult to determine from the qualitative analysis of OCT images. However, by additional OCT data analysis, the optical properties of tissue can be quantified: from the intensity of detected light versus depth, the attenuation coefficient (μt) can be fitted using Beer's law.13 This method has been applied in analyzing atherosclerotic plaque components,14, 15 and apoptosis and necrosis in human fibroblasts,16 showing that OCT indeed is sensitive for changes in μt caused by morphological changes in tissue. Moreover, it has been demonstrated that the measured backscattering differs at various stages of tumor genesis (hyperplasia/dysplasia and neoplasia) in rat bladders.17 We therefore hypothesize that μt measurement from OCT enables assessment of the grade of a bladder tumor. As a first step toward in-vivo diagnostic application, we tested this hypothesis ex vivo by evaluating whether the attenuation coefficient differed between benign bladder tissue and different grades of UC. 2.Materials and Methods2.1.Tissue Samples and Tissue HandlingFrom August to December 2008, we conducted a prospective double-blinded ex-vivo study on consecutive patients with single or multiple bladder tumors scheduled for transurethral resection (TUR), or patients with positive cytology and negative cystoscopy scheduled for bladder biopsies. The study was approved by the Institutional Review Board, Academic Medical Center, Amsterdam. In the operation theater, representative bladder tissue samples from each tumor or suspicious lesion were put into separate numbered containers filled with isotonic saline. Within 1 to 3 h after surgery, examination with OCT was performed at the Department of Biomedical Engineering and Physics, Academic Medical Center, Amsterdam. Samples were measured with (what was considered to be) the luminal surface exposed and covered in saline to prevent dehydration. Directly thereafter, each sample underwent regular histological processing: formalin fixation was followed by paraffin embedding, cutting of sections of 4 μm thickness, and hematoxylin and eosin staining at the Department of Pathology, Academic Medical Center, Amsterdam. 2.2.Optical Coherence Tomography and Histopathology AnalysisThe employed OCT system was a standard time-domain OCT system operating at 850 nm, using a moving reference arm and dynamic focusing in the sample arm. The axial and lateral resolutions of the system were 14 and 6 μm measured in air, respectively. The measured signal-to-noise ratio (SNR) was 118 dB. We verified that the power coupled back from the reference arm was constant over the scan range. Dynamic focusing was achieved by translating the sample arm lens in depth during A-scan acquisition, resulting in one A-scan per second data acquisition time. From each biopsy, one investigator created one to four OCT B-scans that were stored on a hard disk to be analyzed at a later date. Dynamic focusing allows precise measurements of the μt of weakly scattering media, as described by Faber, 13 because during the measurement, the positions of the coherence and confocal gates are matched. Using Beer's law, the detector current i d of the system is described as
[TeX:]
\documentclass[12pt]{minimal}\begin{document}\begin{equation*}
i_d \propto [\exp (-2\mu_t z)]^{\frac{1}{2}},
\end{equation*}\end{document}
where 2z is the roundtrip path length of the light in the sample. The square root accounts for the fact that the detector current is proportional to the field returning from the sample, rather than intensity. The attenuation coefficient is then extracted from the OCT data by fitting Beer's law to the averaged A-scans from a selected region of interest in the OCT image using the Levenberg-Marquardt least squares minimization algorithm (∼100 A-scans of 2048 points, 1.5-mm scan length) (Fig. 1). Prior to averaging and fitting, all A-scans in the region of interest are aligned. The standard deviation corresponding to the average A-scan is used for weighting in the fitting procedure in such a way that depths with large standard deviation contribute less to the minimization procedure.
Fig. 1Demonstration of the quantitative analysis of OCT data to obtain the μt. (a) The obtained OCT B-scan of a bladder tumor biopsy (pTa grade 3). (b) The aligned image with the region of interest (ROI) indicated by the boxed region. (c) The plot of the mean signal intensity versus depth of the selected ROI. The slope is fitted using Beer's law (μt indicated by dashed line).  The fit model features three parameters: an amplitude for scaling, the μt, and an offset, which is fixed at the mean noise level. An uncertainty estimate for the fitted μt is computed from the covariance matrix returned by the fitting algorithm and is specified as a 95% confidence interval (95% CI) of the fitted μt. The curve fit typically included ∼1500 points. The stored OCT B-scans were analyzed by three independent observers who were blinded for clinical information and histopathological diagnosis. After the individual review of the B-scans, the three observers together repeated the analysis of the B-scans to obtain a consensus μt of each scan. To this end, the B-scans were projected on a large screen. One observer aligned the image and selected the region of interest for fitting with the other two observers commenting to reach consensus. In the case of multiple B-scans from one biopsy, the mean μt was calculated for both individual as well as for the consensus μt, with the corresponding 95% CI. The histopathological diagnoses were made by three independent pathologists working in the same academic center. They classified each biopsy as normal/benign, UC grade 1, UC grade 2, or UC grade 3, while being blinded for clinical information and OCT results. Samples in which a definitive diagnosis was not possible (e.g., due to cauterization, desquamation, or insufficient size of the sample), were classified as nondiagnostic. It is well known that histopathological grading is a subjective method with a high interobserver variability reported in the literature (13 to 62%),18, 19, 20 despite guidelines on the interpretation of slides and consensus on the definition of the different grades.21, 22 Therefore, we used a consensus diagnosis to optimize our reference standard. For this, the three pathologists reviewed the samples together on a multihead microscope to reach a consensus diagnosis, after individual review of the slides. 2.3.Statistical AnalysisSince sample sizes across the different pathological categories were unequal and data were not normally distributed, a difference in consensus μt between the various pathological categories was evaluated by means of a Kruskal-Wallis test. The samples qualified as nondiagnostic at the consensus review procedure of the pathologists were excluded from this analysis. The determined μt are presented as median and interquartile range (IQR). Interobserver variability of histopathology and OCT was assessed by measuring agreement between the three pathologists and the three OCT observers, respectively. The interobserver variability of histopathology was assessed by calculating the Fleiss generalized Kappa, an interobserver variability test for categorical data: both overall Kappa (Kappa for all pathological categories combined) and category Kappa (specific Kappa for each category). The interobserver variability of OCT analysis was assessed by calculating the intraclass correlation coefficient (ICC), an interobserver variability test for continuous data. For both outcomes (Kappa and ICC), the following interpretation of agreement better than expected by chance alone was used: fair 0.00 to 0.20, moderate 0.21 to 0.45, substantial 0.46 to 0.75, almost perfect 0.76 to 0.99, and perfect 1.00. Negative value indicates less than chance agreement.23 Statistical analyses were performed in cooperation with the biostatistics department of our clinic, using the Statistical Package for Social Sciences, version 16.0 (SPSS, Chicago, Illinois). For all analyses, p < 0.05 was considered statistically significant. 3.ResultsIn total, 76 OCT scans from 54 bladder tissue samples obtained in 20 procedures on 18 patients were available for analysis. Demographic and pathological characteristics are summarized in Table 1. Table 1Demographic and pathological characteristics. TUR: transurethral resection of bladder tumor. Ta: noninvasive papillary tumors confined to urothelium. T1: tumors invading subepithelial connective tissue (lamina propria) but not muscularis propria. T2: tumors invading muscularis propria. Tis: carcinoma in situ (highly aggressive flat tumor).
The independent as well as consensus diagnosis of pathological grade of the samples is displayed in Table 2. Overall, 11 samples (20.4%) were classified as nondiagnostic by the pathologists’ consensus review procedures and were excluded for the Kruskal-Wallis analysis, while the remaining 43 samples (60 OCT scans, 16 patients, and 18 procedures) were included. The median 95% CI of the fitted μt (consensus review procedure) was 0.06 mm−1 (IQR 0.04 to 0.10 mm−1), indicating accurate fitting procedures. The median attenuation coefficient of normal/benign tissue was 5.75 mm−1 (IQR 4.77 to 6.14 mm−1) versus 5.52 mm−1 (IQR 3.47 to 5.90 mm−1), 4.85 mm−1 (IQR 4.25 to 6.50 mm−1) and 5.62 mm−1 (IQR 5.01 to 6.29 mm−1), for grade 1, 2, and 3 UC, respectively [H(3) = 1.29, p = 0.732] (Fig. 2). Fig. 2Box plot of attenuation coefficients for different pathological categories. Horizontal lines represent median values, boxes indicate IQR, and error bars indicate range. 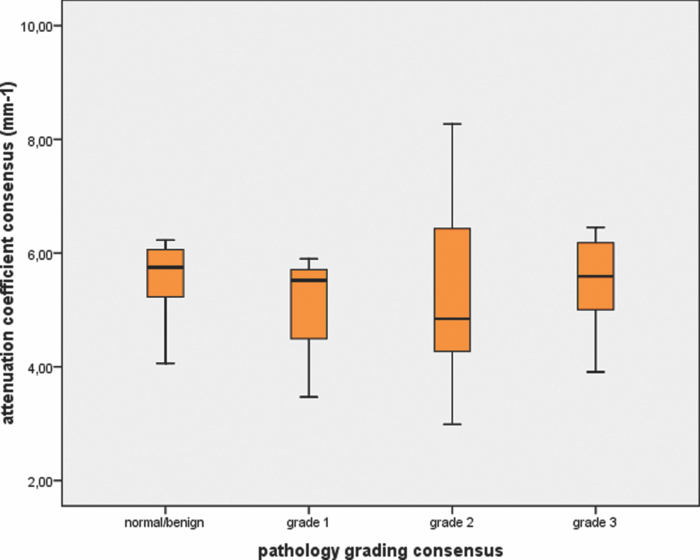 Table 2Pathological grade – independent and consensus diagnosis.
The interobserver agreement on the OCT data, evaluated by intraclass correlation, was “almost perfect” (ICC 0.87, 95% CI 0.82 to 0.92, and p < 0.001). The overall agreement for histopathology, calculated by Fleiss-generalised Kappa, was “substantial” (Kappa 0.63, 95% CI 0.54 to 0.70, and p < 0.001). The Kappa and corresponding pathologist's agreements for the different histopathological categories are summarized in Table 3. Table 3Kappa and corresponding pathologist's agreement of the different pathological categories.
4.DiscussionAlthough prior research17 showed a difference in backscattering (e.g., OCT signal amplitude) in an OCT image containing both a normal and hyperplastic region, and another image containing both a normal and neoplastic region, we could not demonstrate such a difference in the attenuation coefficient of bladder cancer tissue in this human ex-vivo study. Xie, Zeidel, and Pan assumed in their theoretical model that nuclei were the main source of scattering, and that nuclear morphological changes occurring in carcinogenesis (increased nuclearcytoplasm ratio, loss of polarity) could be detected by OCT based on measured backscattering. With a controllable bladder tumor model in Fisher rats, they showed that the calculated backscattering increased less than 20% in hyperplastic lesions, but more than 60% for neoplastic lesions compared to normal urothelium. The backscattering change between hyperplastic and dysplastic lesions was insufficient to discriminate these stages.17 Note that changes in cellular morphology do not necessarily cause similar changes in μt and backscattering, because the former depends on the scattering phase function in the backscattering direction, which in turn is a strong function of particle size. Several factors, some inherent to an ex-vivo experimental setting, might account for the lack of difference in μt between the different pathological types in the current study. First, bladder cancer is a morphologically heterogeneous disease, and different grades may exist within one tumor.18, 24 Though OCT and histopathology both result in cross sectional images of the sample, it is very difficult to obtain a histological section of 4 μm thickness in a sample of 5×5 mm at the exact same point where the OCT imaging took place, even if imaged areas would have been marked with ink. This discrepancy in region of interest might therefore account for difficulties in correlation of the μ t with pathological grade. Moreover, histopathological grading can be based on just a few altered cells in a specimen, whereas OCT analysis averages morphology over a complete OCT image. Second, the relatively low Kappa value of histopathology indicates that grading of (some of) the samples was not straightforward. Despite the fact that we used consensus histopathological diagnosis to optimize the reference standard, this subjective nature of histopathology might hamper correlation. It must be acknowledged that the OCT analysis also has a subjective element, i.e., the choice of the region of interest. Third, finding the right orientation of the biopsy (i.e., to identify the mucosal surface) can be difficult, especially in cold cup biopsies, which tend to be rather small (2×2 mm on average). For “warm” biopsies (biopsies obtained by resection), cauterization effects helped with the orientation, and the noncauterized side was regarded as the mucosal site. Nevertheless, this cauterization can induce changes in μt and also account for artifacts in the OCT data. Moreover, the optical properties of excised tissue can change from live tissue. Although we took care to image the biopsies as soon as possible after resection, our present protocol did not allow faster processing than within 1 to 3 h after the procedure. To minimize any changes in optical properties, the biopsies were kept in isotonic saline solution after resection and during OCT imaging. Furthermore, the samples were measured in a relaxed state and not stretched and pinned, which would better mimic the in-vivo situation in the human bladder. Hermes conducted an ex-vivo study on qualitative analysis of OCT for bladder cancer, which enabled detailed tissue characterization, and they did measure the specimens under gentle tension by clamping them on cork.11 Due to the small size of the specimens, this was not possible in the current study. In addition, we measured the samples at room temperature, and since the optical properties of tissue are temperature dependent,25 this may also have influenced the μt in our study. However, the effect of temperature on μt is most prominent in tissue with high-lipid content,26 thus in bladder tissue, this effect most probably will be minimal. Our current protocol did not allow deliberately taking biopsies of normal tissue. Consequently, a paired comparison of μt of normal versus tumor tissue within individual patients (i.e., patients as their own control) was not possible. Nevertheless, for four patients, biopsies were taken that were classified as normal/benign and for which a biopsy classified as UC was also available. In a post-hoc test, we did compare the median μt of the normal sample with the median μt of the tumor sample (five samples in total for each group, data not shown). In one patient only, the tumor sample revealed a higher μt (6.70 mm−1) than the normal sample (4.31 mm−1). In the other three patients, the μt of the tumor sample was either equal to or lower than the μt of the normal tissue. However, sample size was too small to draw statistically sound conclusions. In addition, we made a subanalysis on the 20 biopsies from tumors that were confined to the urothelium without invasion in the lamina propria or muscularis propria (pTa tumors). In these tumors, morphological changes occur solely in the most superficial layer of the bladder (i.e., urothelium). We assumed that measuring μt for the complete depth of the sample would be inaccurate for these tumors. Therefore, we only determined the μt from the most superficial layer identified in the B-scan. Within these 20 samples (three samples with grade 1, 13 with grade 2, and four with grade 3), no difference in median μt was found for the different grades (data not shown). This study did confirm the high interobserver variability of histopathological grading. This was especially noticeable for grade-1 tumors, which is also acknowledged in the literature.18 Because of this well known interobserver variability, an objective assessment of grade would be desirable because of its importance for prognosis and thus management. We could demonstrate that the interobserver variability for OCT analysis was much lower than that of pathology. Some of the factors that may (at least in part) account for the lack of differences in μt in our study, like orientation of the biopsies, cauterization effects, and the effect of tissue relaxation of the biopsies, are typical for an ex-vivo setting. Since these factors can be circumvented in an in-vivo approach using a cystoscopically guided fiber-based catheter to obtain the OCT data, further in-vivo investigation of our hypothesis is warranted. 4.1.Significance of This StudyEven though our hypothesis could not be confirmed, this study revealed a number of points that are worth stressing. Most importantly, the correlation of in-vivo measured μt in suspicious lesions with histopathology may be challenging because of the heterogeneity of bladder cancer and the (only) “substantial” agreement of the gold standard. Moreover, our study shows that the translation of theoretical considerations and controlled animal studies17 to a clinically realistic, heterogeneous patient population is far from straightforward. Finally, if an in-vivo study (which is about to start in our center) would show a positive outcome, we can conclude that our present study mostly reflects limitations due to ex-vivo circumstances, rather than limitations of OCT technology, which could be an important factor in future study designs. 5.ConclusionWe could not confirm our hypothesis that morphological changes occurring in malignant bladder tissue can be assessed in a quantitative way by determining the attenuation coefficient by OCT in this ex-vivo study. Because this lack of correlation may (at least in part) be due to environmental factors typical in an ex-vivo setting (orientation of the biopsy, cauterization effects, and relaxed bladder wall), further in-vivo testing is warranted. AcknowledgmentsWe would like to thank J. von der Thüsen and B. Ramakers from the Department of Pathology, Academic Medical Center Amsterdam, for their efforts in analyzing the pathology slides. In addition, we would like to thank L. Dam for her assistance in OCT imaging, N. van Geloven for her assistance in statistical analysis, and M.J.C.van Gemert for his constructive review of the manuscript. Faber is funded by a personal grant in the “Vernieuwingsimpuls” program (AGT07544) by the Netherlands Organization of Scientific Research (NWO) and the Technology Foundation STW. ReferencesS. J. Cina,
J. I. Epstein,
J. M. Endrizzi,
W. J. Harmon,
T. M. Seay, and
M. P. Schoenberg,
“Correlation of cystoscopic impression with histologic diagnosis of biopsy specimens of the bladder,”
Hum. Pathol., 32 630
–637
(2001). https://doi.org/10.1053/hupa.2001.24999 Google Scholar
M. S. Soloway,
“Expectant treatment of small, recurrent, low-grade, noninvasive tumors of the urinary bladder,”
Urol. Oncol., 24 58
–61
(2006). Google Scholar
J. A. Witjes,
D. O. Melissen, and
L. A. Kiemeney,
“Current practice in the management of superficial bladder cancer in the Netherlands and Belgian Flanders: a survey,”
Eur. Urol., 49 478
–484
(2006). https://doi.org/10.1016/j.eururo.2005.11.010 Google Scholar
R. J. Sylvester,
A. P. van der Meijden,
W. Oosterlinck,
J. A. Witjes,
C. Bouffioux,
L. Denis,
D. W. Newling, and
K. Kurth,
“Predicting recurrence and progression in individual patients with stage Ta T1 bladder cancer using EORTC risk tables: a combined analysis of 2596 patients from seven EORTC trials,”
Eur. Urol., 49 466
–475
(2006). https://doi.org/10.1016/j.eururo.2005.12.031 Google Scholar
M. Babjuk,
W. Oosterlinck,
R. Sylvester,
E. Kaasinen,
A. Bohle, J. Palou-Redorta,
“EAU guidelines on non-muscle-invasive urothelial carcinoma of the bladder,”
Eur. Urol., 54 303
–314
(2008). https://doi.org/10.1016/j.eururo.2008.04.051 Google Scholar
M. C. Hall,
S. S. Chang,
G. Dalbagni,
R. S. Pruthi,
J. D. Seigne,
E. C. Skinner,
J.S. Wolf Jr., P. F. Schellhammer,
“Guideline for the management of nonmuscle invasive bladder cancer (stages Ta, T1, and Tis): 2007 update,”
J. Urol., 178 2314
–2330
(2007). https://doi.org/10.1016/j.juro.2007.09.003 Google Scholar
G. J. Tearney,
M. E. Brezinski,
J. F. Southern,
B. E. Bouma,
S. A. Boppart, and
J. G. Fujimoto,
“Optical biopsy in human urologic tissue using optical coherence tomography,”
J. Urol., 157 1915
–1919
(1997). https://doi.org/10.1016/S0022-5347(01)64900-0 Google Scholar
A. Sergeev,
V. Gelikonov,
G. Gelikonov,
F. Feldchtein,
R. Kuranov,
N. Gladkova,
N. Shakhova,
L. Snopova,
A. Shakhov,
I. Kuznetzova,
A. Denisenko,
V. Pochinko,
Y. Chumakov, and
O. Streltzova,
“In vivo endoscopic OCT imaging of precancer and cancer states of human mucosa,”
Opt. Express, 1 432
–440
(1997). https://doi.org/10.1364/OE.1.000432 Google Scholar
S. P. Lerner,
A. C. Goh,
N. J. Tresser, and
S. S. Shen,
“Optical coherence tomography as an adjunct to white light cystoscopy for intravesical real-time imaging and staging of bladder cancer,”
Urol., 72 133
–137
(2008). https://doi.org/10.1016/j.urology.2008.02.002 Google Scholar
Z. Wang,
C. S. Lee,
W. C. Waltzer,
J. Liu,
H. Xie,
Z. Yuan, and
Y. Pan,
“In vivo bladder imaging with microelectromechanical-systems-based endoscopic spectral domain optical coherence tomography,”
J. Biomed. Opt., 12 034009
(2007). https://doi.org/10.1117/1.2749744 Google Scholar
B. Hermes,
F. Spoler,
A. Naami,
J. Bornemann,
M. Forst,
J. Grosse,
G. Jakse, and
R. Knuchel,
“Visualization of the basement membrane zone of the bladder by optical coherence tomography: feasibility of noninvasive evaluation of tumor invasion,”
Urol., 72 677
–681
(2008). https://doi.org/10.1016/j.urology.2008.02.062 Google Scholar
M. J. Manyak,
N. D. Gladkova,
J. H. Makari,
A. M. Schwartz,
E. V. Zagaynova,
L. Zolfaghari,
J. M. Zara,
R. Iksanov, and
F. I. Feldchtein,
“Evaluation of superficial bladder transitional-cell carcinoma by optical coherence tomography,”
J. Endourol., 19 570
–574
(2005). https://doi.org/10.1089/end.2005.19.570 Google Scholar
D. J. Faber,
F. J. van der Meer,
M. C. G. Aalders, and
T. G. van Leeuwen,
“Quantitative measurement of attenuation coefficients of weakly scattering media using optical coherence tomography,”
Opt. Express, 12 4353
–4365
(2004). https://doi.org/10.1364/OPEX.12.004353 Google Scholar
F. J. van der Meer,
D. J. Faber,
J. Perree,
G. Pasterkamp,
S. D. Baraznji, and
T. G. van Leeuwen,
“Quantitative optical coherence tomography of arterial wall components,”
Lasers Med. Sci., 20 45
–51
(2005). https://doi.org/10.1007/s10103-005-0336-z Google Scholar
C. Xu,
J. M. Schmitt,
S. G. Carlier, and
R. Virmani,
“Characterization of atherosclerosis plaques by measuring both backscattering and attenuation coefficients in optical coherence tomography,”
J. Biomed Opt., 13 034003
(2008). https://doi.org/10.1117/1.2927464 Google Scholar
F. J. van der Meer,
D. J. Faber,
M. C. Aalders,
A. A. Poot,
I. Vermes, and
T. G. van Leeuwen,
“Apoptosis- and necrosis-induced changes in light attenuation measured by optical coherence tomography,”
Lasers Med. Sci., 25 259
–267
(2010). https://doi.org/10.1007/s10103-009-0723-y Google Scholar
T. Xie,
M. Zeidel, and
Y. Pan,
“Detection of tumorigenesis in urinary bladder with optical coherence tomography: optical characterization of morphological changes,”
Opt. Express, 10 1431
–1443
(2002). Google Scholar
R. Engers,
“Reproducibility and reliability of tumor grading in urological neoplasms,”
World J. Urol., 25 595
–605
(2007). https://doi.org/10.1007/s00345-007-0209-0 Google Scholar
M. May,
S. Brookman-Amissah,
J. Roigas,
A. Hartmann,
S. Storkel,
G. Kristiansen,
C. Gilfrich,
R. Borchardt,
B. Hoschke,
O. Kaufmann, and
S. Gunia,
“Prognostic accuracy of individual uropathologists in noninvasive urinary bladder carcinoma: a multicentre study comparing the 1973 and 2004 World Health Organisation classifications,”
(2009) Google Scholar
W. M. Murphy,
K. Takezawa, and
N. A. Maruniak,
“Interobserver discrepancy using the 1998 World Health Organization/International Society of Urologic Pathology classification of urothelial neoplasms: practical choices for patient care,”
J. Urol., 168 968
–972
(2002). https://doi.org/10.1016/S0022-5347(05)64553-3 Google Scholar
F. Mostofi,
L. H. Sobin, and
H. Torloni,
“Histological typing of urinary bladder tumors,”
International Classification of Tumors, 19th World Health Organization, Genova, Switzerland(1973). Google Scholar
G. Sauter,
F. Algaba, and
M. Amin,
“Tumors of the urinary system: non-invasive urothelial neoplasias,”
WHO Classification of Tumors of the Urinary System and Male Genital Organs, IARCC Press, Lyon, France
(2004). Google Scholar
S. R. Munoz and
S. I. Bangdiwala,
“Interpretation of Kappa and B statistics measures of agreement,”
J. Appl. Stat., 24 105
–111
(1997). https://doi.org/10.1080/02664769723918 Google Scholar
L. Cheng,
R. M. Neumann,
A. Nehra,
B. E. Spotts,
A. L. Weaver, and
D. G. Bostwick,
“Cancer heterogeneity and its biologic implications in the grading of urothelial carcinoma,”
Cancer, 88 1663
–1670
(2000). https://doi.org/10.1002/(SICI)1097-0142(20000401)88:7<1663::AID-CNCR21>3.0.CO;2-8 Google Scholar
J. W. Pickering,
S. Bosman,
P. Posthumus,
P. Blokland,
J. F. Beek, and
M. J. van Gemert,
“Changes in the optical properties (at 632.8 nm) of slowly heated myocardium,”
Appl. Opt., 32 367
–371
(1993). https://doi.org/10.1364/AO.32.000367 Google Scholar
F. J. van der Meer,
D. J. Faber,
I. Cilesiz,
M. J. van Gemert, and
T. G. van Leeuwen,
“Temperature-dependent optical properties of individual vascular wall components measured by optical coherence tomography,”
J. Biomed. Opt., 11 041120
(2006). https://doi.org/10.1117/1.2333613 Google Scholar
|


