
|
|
1.IntroductionSubchondral bone provides structural support for the overlying articular cartilage, and it is involved in absorbing and transferring mechanical loads during joint loading. During growth, subchondral bone consists of a mixture of cancellous bone and calcified cartilage, which is remodeled in to bone during maturation.1 Bone tissue consists primarily of mineral, type-1 collagen, water, and cells. The mechanical properties of cancellous bone are closely associated with the volume fraction of the bone and its extracellular matrix, including the collagen content.2, 3 Collagen provides bone with its tensile strength and a matrix for the deposition of mineral.2, 4 There is predominantly collagen type 1 in bone, but a small amount of types 3 and 5 are also present.2, 5, 6 The metabolism of bone collagen is most active in the subchondral bone.7 This may be caused by the gradual arrangement of the collagen network and remodeling of the subchondral bone during maturation. The composition, structure, and mechanical properties of the bone are known to change during growth and maturation.3, 4, 8, 9, 10 Fourier transform infrared (FTIR) microspectroscopy is a technique capable of producing chemical microscopic images of biological tissue sections. In FTIR microspectroscopy, infrared light absorption is measured point by point from the microscopic section, and an infrared absorption spectrum is determined at each pixel. Chemical composition, molecular structures, conformations, and molecular interactions can be analyzed from IR absorption spectra for each image pixel.11, 12 FTIR microspectroscopy has been used in recognition of various diseases,12 both for clinical diagnostics and laboratory studies.13 The technique can be used to detect the concentration of certain biological molecules, e.g., proteins, of the sample by assessing the integrated area under the specific peak in the absorption spectrum. This is known as quantitative FTIR analysis. One limitation with this approach is the direct dependence of the results on the sample thickness. Therefore, ratios of peak areas are generally reported. On the other hand, the overall shape or position of absorption peaks can be analyzed. In this approach, in addition to changes in molecule concentration, differences in molecular structures can be seen. Analysis of spectral shapes and positions can be called qualitative FTIR microspectroscopy. During growth and maturation of equine subchondral bone, biochemical changes of the amount of mineral, collagen, and collagen cross-links have been reported.9 According to these observations, major and rapid changes in equine subchondral bone occur during the first months of life, while further adaptation is slower, and skeletal maturation is reached around the age of four years.14 FTIR microspectroscopy has been reported to be a sensitive tool for determining the local chemical composition of bone, the relative amounts of its constituents, their molecular nature, distribution, and orientation of various components.6, 15, 16 Age-dependent changes in FTIR spectral parameters of healthy and diseased human bone have earlier been summarized by Boskey and Mendelsohn.6 In addition, significant correlations between absorption bands and their relative intensity in organic bone matrix with aging have been reported.10 With a qualitative approach based on clustering analysis, it is possible to extract additional novel information regarding changes, not only in the concentration of molecules, but also in the molecular structures. Clustering is a multivariate technique for statistical data analysis, similar to image analysis and pattern recognition. It has been applied in various fields.17, 18 The goal of clustering is to do a partition of the initial dataset (IR spectra in this study) into a number of disjoint clusters, based on the measurement of the similarity between objects using a distance measure function. If the clustered data are a set of vectors (spectra), then the similarity is measured as the distance between the vectors. To date, clustering analysis (qualitative analysis) based on FTIR microspectroscopy has not been conducted for bone. Moreover, only little is known about the spectroscopic age-related changes in subchondral bone.19 The purpose of the present study was to investigate changes in the composition of decalcified equine subchondral bone samples during growth and maturation using FTIR microspectroscopy. We hypothesized that FTIR microspectroscopy is able to detect both quantitative and qualitative differences in the collagen phase of bone during maturation. 2.Materials and Methods2.1.Experimental DesignEquine subchondral bone samples were collected from an existing sample base of normal equine joints and included newborns (NB, n = 6), immature (age range 5 to 11 months, n = 15), and adult horses (age range 6 to 10 years, n = 8) (Table 1). The study protocol was approved by the ethical committees at Utrecht University, the Netherlands, and Massey University, New Zealand. Specimens were taken from two differently loaded sites of the proximal articular surface of the proximal phalanx of the left metacarpophalangeal joint [Fig. 1]. Site 1, which is located at the medial dorsal articular margin of the proximal joint surface, is subjected to intermittent high peak loading conditions. In contrast, site 2, which is located at the midregion of the medial cavity of the proximal joint surface, is exposed to lower-level but constant joint loading [Fig. 1].20 Osteochondral plugs (diameter 4 mm) were removed using a custom-built hollow drill in random orientation, but with the long axis perpendicular to the articular surface of the proximal phalangeal bone from the two predefined locations. The plugs were subsequently sectioned perpendicular to the articular surface with a dentist's drill (KaVo Electrotechnic, Leutkirch, Germany) equipped with a 24/0.1 (diameter/thickness in millimeters) circular blade (Busch GmbH, Engleskirchen, Germany) into two equal halves consisting of articular cartilage and approximately 10 to 20 mm of subchondral bone. One half, used for the analysis in the present study, was decalcified in 10% ethylenediaminetetraacetic acid (EDTA) supplemented with 4% formaldehyde and 0.1-M sodium phosphate buffer (pH 7.4) for 12 days at 4ºC, and thereafter dehydrated in ethanol and embedded in paraffin.4 These samples were chosen since they have been analyzed using polarized light microscopy (PLM) in an earlier study.4 Samples were divided into three age groups: newborn (NB), immature, and adult horses. With this division, the groups represented three distinct phases in life, with fewer confounding factors present (Table 1). Fig. 1(a) Sampling sites of cylindrical osteochondral plugs from the proximal articular surface of the proximal phalangeal bone of the left metacarpophalangeal joint. Located at the medial dorsal margin of the joint surface, site 1 is not loaded during standing or in a slowly moving animal, but is subjected to high intermittent peak loading during overextension at high speeds and jumping. Site 2, in the mediocentral area, is continually loaded when the limb is weight bearing, but experiences lower peak forces than site 1. 20 (b) FTIR spectrum of decalcified subchondral bone from an adult horse, indicating the wavenumbers of interest in this study, i.e., the amide I band (1584 to 1720 cm−1) and amide II band (1500 to 1584 cm−1). 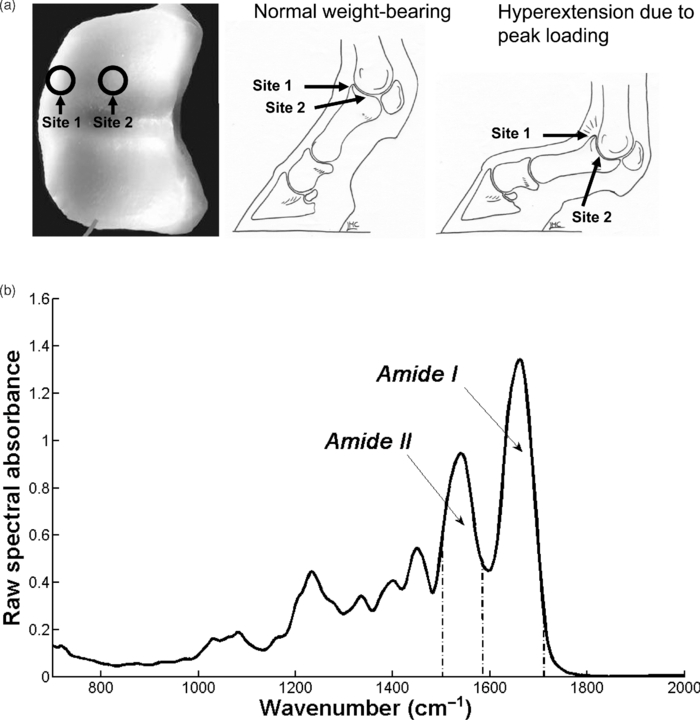 Table 1Age groups and corresponding numbers of horses and analyzed sections at site 1 and site 2.
2.2.Fourier Transform Infrared MicrospectroscopyThin sections of 5 μm were cut and placed on ZnSe glasses for FTIR microspectroscopy measurements. Paraffin was dissolved from the sections with xylene prior to the measurements.21 Infrared transmittance spectra were acquired using a FTIR imaging system (Perkin Elmer Spotlight 300, Perkin Elmer, Shelton, Colorado). This system comprises a classical FTIR spectrometer coupled with a light microscope, a computer-controlled sample stage, and a linear array detector. The spatial resolution was 25 μm and the spectral resolution was 4 cm−1. Two repeated scans were used for data collection, and spectra were collected over the region of 2000 to 700 cm−1. A typical spectrum of the demineralized subchondral bone is shown in Fig. 1. The protein peaks, i.e., amide I and amide II, mainly arise from collagen type 1.15 2.3.Quantitative AnalysisIn the quantitative FTIR analysis, the average baseline-corrected absorbance spectra for each individual sample were extracted from two rectangular regions of interest (ROI) (Fig. 2). Region 1 (R1) was chosen just below the cartilage-bone interface, and region 2 (R2) was chosen in the deeper subchondral bone. Spectra of pixels containing no bone were set to zero and excluded from the calculations of the average spectrum. 2-D spatial images (2-D chemical maps), presenting integrated absorbance peak area over the amide I band (1584–1720 cm−1), were created with Matlab software (v. 7.8., Mathworks, Incoporated, Natick, Massachusetts) (Fig. 2). Fig. 2Amide I absorbance images of newborn (left), immature (middle), and adult (right) equine subchondral bone samples. Region 1 (R1) was chosen just below the articular cartilage-bone interface, and region 2 (R2) was located in the deeper subchondral bone.  The spatial collagen content of the samples was quantified by measuring the integrated absorbance of the Amide I peak (1584–1720 cm−1) and the Amide II peak (1500–1584 cm−1). Additionally, the collagen maturity, or the ratio of immature to mature collagen-cross links, was estimated by using a combination of the second derivative spectra and peak fitting to determine the sub-peaks at 1660 cm−1 and 1690 cm−1.16, 22 2.4.Qualitative Analysis by ClusteringK-means clustering has been used in many fields to solve optimization problems.23 In the computer science and pattern recognition community, this algorithm is well known as the generalized Lloyd algorithm (GLA) or hard c-means algorithm (Fig. 3). It classifies data points into a predefined number of classes by iteratively recomputing means of classes until the criteria of minimum sum of squared errors (SSQ) are satisfied. It allows the use of different distance measures for the SSQ.24 The output from the algorithm includes the cluster membership map and the centers of each cluster. Means of the clusters can be used to interpret the chemical differences between data groups. In general, a spectral dataset can be considered as a cloud of points in the multidimensional space. K-means clustering regroups spectra that show similar spectral characteristics. Hence, ideally, spectra in different classes demonstrate different spectral signatures, the interclass variance has a maximum value and the intraclass variance is minimal. Fig. 3The standard k-means clustering algorithm was used in this study. The general procedure of this algorithm is shown. More information can be obtained from Refs. 18 and 23. 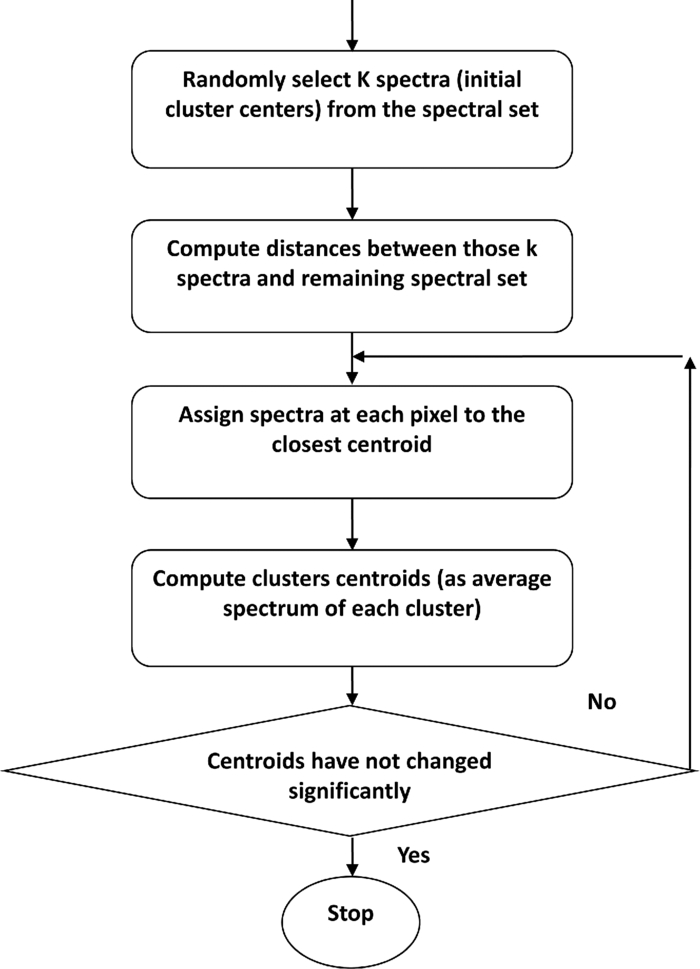 In this study, K-means clustering was used to classify samples into age groups. The number of clusters was set to three, corresponding to the number of initial groups of samples (newborn, immature, and adult). The squared Euclidean distance was chosen to be a measure of dissimilarity between spectra. The k-means algorithm was run 50 times with different random initialization, and the solution with the least cost was chosen. The spectral region between 1200 and 1720 cm−1 was selected for clustering. Before k-means clustering, second derivative spectra were calculated using the Savitzky-Golay algorithm with nine-smoothing points.25 Subsequently, derivative spectra were scaled such that the sum of squared deviation over the indicated wavelength equals unity (vector normalization). Spectra of the two regions of interest (Fig. 2) from the two sites [Fig. 1] were analyzed separately. Clustering was performed both on mean spectra for each sample and pixel by pixel. For analysis, an equal number of spectra from each region was required. Since the regions contained different numbers of bone spectra, 300 individual bone spectra were chosen from each region. If there were more than 300 bone spectra in the region, the pixels were chosen randomly from the data matrix of the region. Spectra from all samples were pooled together into one data matrix, and normalized second derivative spectra were clustered altogether using k-means. All data analysis was performed using the custom written functions created in Matlab 7.8 software (Mathworks, Natick, Massachusetts). 3.Results3.1.Quantitative AnalysisQuantitatively, the absorbance of amide I and amide II peaks increased significantly between the newborn and immature horses at both sites and regions of interest (Fig. 4, upper row). Thereafter, no significant differences were observed as maturation and growth progressed further. Collagen maturity, i.e., the cross-link ratio, calculated as the ratio of 1660 and 1690 cm−1, increased significantly both from the newborn to immature age, as well as from immature to adult age (Fig. 4, bottom row). Fig. 4(a) Anatomical site 1: total absorbance (mean ± SD) of the amide I region (upper row) and collagen cross-links ratio (1660/1690) (bottom row) for each age group and region. (b) Anatomical site 2: total absorbance (mean ± SD) of the amide I region (upper row) and collagen cross-links ratio (1660/1690) (bottom row) for each age group and region. Significant differences based on the Mann-Whitney U-test are indicated (**p < 0.01).  3.2.Qualitative AnalysisSmall differences in the shape of the raw spectrum at the spectral region of the amide I band, as judged by the mean raw spectrum, were visually observed between three age groups of samples [Fig. 5]. In contrast, distinct changes between the age groups that were visually observed in the normalized second derivative spectra could be visually observed at the spatial region of the amide I band [Fig 5]. Based on the k-means clustering of mean spectra, newborn samples and adult samples were classified completely into two different groups at both regions of site 2 (Fig. 6). However, a slightly less distinct classification was observed at site 1 (data not shown). The immature samples constructed their own cluster, but they were also mixed with the two previously mentioned ones. At site 2, region 1 produced a more distinct classification than region 2. Normalization of spectra after taking the second derivative showed no significant influence on the clustering results. Fig. 5(a) Average raw absorbance spectra and (b) second derivative spectra normalized to the vector length (calculated using Savitsky-Golay smoothing technique with nine smoothing points25) of each age group for region 1 of site 2. Similar findings were obtained for region 2 of site 2 and regions of site 1. The arrows indicate the region with distinct spectral differences. 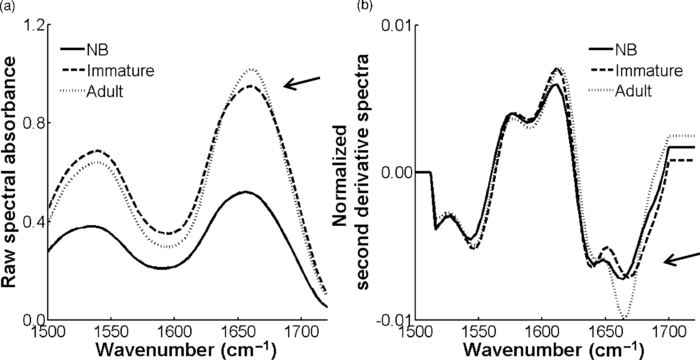 Fig. 6Mean second derivative spectra of the three resulting clusters from all samples at site 2: (a) region 1 and (b) region 2. Color codes of clustering (black, gray, and white) (c) before and (d) after normalization of second derivative spectra show the clustering group for each sample for region 1 of site 2.  The pixel-by-pixel clustering was performed to investigate whether similar results can be obtained by taking into account the spatial variation in spectra within the sample, instead of merely counting the average spectrum from each region. Generally, the results were similar to those with the average spectra. The results show a clear separation between newborn and adult samples (Table 2). More than 50% of spectra in each sample of those groups belong to a certain class. In the immature group, some heterogeneity was still observed. To visually compare the “cluster images,” the results of the cluster analysis from three representative samples (one from each age group) are presented as simple pseudocolor images, where all the spectra in each cluster are assigned a different (particular) color (Fig. 7). Fig. 7Clustering color codes of three age group representatives show the clustering group for each spectrum when clustering pixel by pixel. The relative amount of clusters in each sample is presented as the number of pixels assigned to the particular class divided by the total number of pixels in the sample.  Table 2Results of pixel-by-pixel clustering presented as relative amounts of spectra in each class for samples at region 1 of site 2. Bolded numbers show the biggest class for each sample.
4.DiscussionIn the present study, FTIR microspectroscopy and subsequent cluster analysis were applied to characterize quantitative and qualitative differences in the collagen matrix of equine subchondral bone during growth and maturation. The analyses demonstrated that FTIR microspectroscopy is sensitive to changes in the collagen content of the subchondral bone in growing horses. A rapid increase was shown in the IR absorbance of amide I and amide II after birth, while they remained relatively constant during later stages of maturation and adult life. For the first time, the ability of FTIR microspectroscopy to detect qualitative changes based on clustering in the collagen matrix of subchondral bone was demonstrated. Cluster analysis for the normalized second derivative FTIR spectra was able to divide the newborn and adult samples into two different groups based on the differences in the shape or position of absorption peaks (Fig. 6). Foals of different ages (newborn, immature, and adult) were studied to characterize changes in the collagen network of subchondral bone during maturation. All horses were raised on pasture, which means that they were free to exercise voluntarily 24 h per day. FTIR microspectroscopic analysis indicated that the collagen content of subchondral bone, estimated by the IR absorbance of amide I and amide II peaks, shows rapid increase after birth. Collagen content remains relatively constant at both investigated regions and sites during later maturation and adult life. Similar findings have been reported by Brama based on traditional biochemical evaluation.9 Specifically, they reported a significant increase in the collagen content of demineralized subchondral bone samples during the first five months of life at site 1, while a weaker increase was observed at site 2. From 5 to 11 months of age, the biochemical parameters were essentially constant except for a reduction in water content. The similarity in findings confirms the capability of FTIR microspectroscopy to quantify the amount of collagen molecules pixel-by-pixel. The ratio of 1660/1690 peaks has previously been reported to correspond to the ratio between mature and immature collagen cross-links in bone.16 In this study, we found an increase of the 1660/1690 ratio with age. This can be explained by maturation of the collagen cross-links, and the ratio value reflecting the level of collagen maturation.16, 22 In the present study, we showed for the first time, the potential of FTIR microspectroscopy to detect qualitative differences in the collagen matrix of subchondral bone during maturation and growth. Cluster analysis for normalized second derivative spectra was able to divide newborn and adult subchondral bone samples into two different groups based on differences in the shape or position of absorption peaks. The qualitative analysis was conducted using the k-means clustering method. In practice, the use of second derivative spectra is essential, as minor changes across the specimen are difficult to observe from the raw spectra due to overlap of different constituent bands. Further, as the second derivative spectra increase the resolution, small or subtle features can also be identified. It is also known that the second derivative of a spectrum removes contributions of offset and slope in the original spectrum, as well as reduces the contribution related to a slowly varying baseline in a spectrum.26 Also, although the use of derivatives will not eliminate the scattering component from the spectrum, it discriminates against the scattering component and reduces its effect on quantification.27 To reduce the potential loss in the signal-to-noise ratio (SNR) that might occur when higher order derivatives are used, derivation was used in combination with the Savitzky-Golay polynomial smoothing technique.25 Moreover, a spatial resolution of 25 μm was used for the FTIR imaging, which provides spectra of higher quality than when using a smaller a pixel size, and thus, a superior SNR. Only spectra with an adequate SNR were selected for analysis. In a study by Very, a shift in absorption peaks at 1650 and 1540 cm−1 was demonstrated with aging in human transiliac bone.10 They hypothesized that the qualitative changes would reflect the change in the collagen protein secondary structure.28 In the present study, peak shifts seem to be major contributors for successful clustering, which can reflect an alteration in the collagen structure. We visually observed minor peak shifts near 1660 and 1540 cm−1 toward higher wavenumbers with age. This was captured by the second derivative spectra (Fig. 5). These two bands, observed by some authors, are sensitive to the helicoidal arrangement of proteins29, 30 and collagen cross-links.16 The band near 1660 cm−1 is of particular interest in collagen studies, and has been suggested to correspond to nonreducible (pyridinoline) collagen cross-links in bone.16 The ratio of 1660/1690 cm−1, which corresponds to the collagen maturity, was found to significantly increase with age in this study, which further justifies the alterations found in this band. These possible modifications in bone composition and structure with maturation and aging will be the focus of our further studies to clarify the biological reasons behind these spectral changes. The samples used in this study were taken from the existing sample base, which had earlier been investigated using polarized light microscopy (PLM).4 The samples were embedded in paraffin. Therefore, paraffin was dissolved chemically from the samples prior to FTIR measurements, minimizing the contribution of the paraffin to the FTIR spectra. Even if small amounts of paraffin would remain on the sections, its spectra do not interfere with the current spectral region of interest (1720 to 1500 cm−1).31 Although embedding in polymethyl methacrylate (PMMA) is more common for spectroscopic studies of bone,15 the subtraction of the PMMA spectra from the bone spectra could cause artifacts, hindering cluster analysis. Thus, paraffin embedding with chemical dissolving was justified for this study. Minor changes in the shape and peak locations in FTIR spectra across the specimen are usually difficult to observe, as different constituent bands overlap, and noise is present. Thus, the use of various multivariate methods is essential for the differentiation of chemical spectra and recognition of the patterns. Clustering is one type of multivariate analysis method with significant potential. Cluster analysis of FTIR and Raman32 spectra provides a useful tool for identification and differentiation of various biological components such as bacteria,33, 34 various normal and cancerous tissues,35, 36, 37, 38 and other diseased tissues.12, 39 Even disease progression stages have been investigated.40 Present quantitative analysis, based on integrated area and ratios, is used to study actual changes in collagen content between age groups. Thus, in quantitative analysis, samples cannot be separated into different groups without a-priori knowledge of some properties of samples. In contrast, with cluster analysis samples can be divided into different groups based solely on spectral differences, which reflects the actual biological distribution of samples in the groups. Clustering techniques are divided into two general groups: partitional and hierarchical.17, 18 Hierarchical methods produce a hierarchy of clusters, where a child cluster is totally contained in its parents. Partitional clustering creates classes with no hierarchical structure. Several clustering algorithms have been applied to the IR spectroscopic data so far: hierarchical clustering (HCA), k-means and, the less used fussy C-means (FCM) clustering. Hierarchical clustering (HCA) is the most widely used clustering technique in biomedical IR spectroscopy. This is a “hard” clustering method like k-means (i.e., each object of clustering is assigned to only one cluster), but it creates nested clusters. Lasch 11 compared these three clustering techniques on the IR spectra of cancerous tissue. The best correlation between the histopathology and cluster images was observed if the data were processed with HCA, while the results produced by k-means and FCM also have very high quality. The major drawback of HCA is its high computational complexity, especially with large-scale datasets.11, 18 It is also known that HCA is not capable of correcting possible misclassification, and thus the algorithm is more sensitive to noise and outliers.17 In the present study, we did not focus on the problem of structural tissue differentiation within the sample or study of hierarchy of tissue types. Instead, the goal was to investigate whether age-specific changes could be observed in decalcified subchondral bone samples, based on the clustering of average IR spectra and large spectral datasets acquired in pixel-by-pixel clustering of the tissue. By knowing the number of desired classes beforehand and having a large amount of data, we were able to use the simple but effective k-means algorithm. Cluster analysis of the second derivative spectra completely separated the newborn and adult samples, while the immature horse samples yielded a mixed class, generating a class of its own. A better classification was observed at site 2 than at site 1. This might be explained by the fact that site 2 is a constantly loaded site, while site 1 is loaded only intermittently. Although site 1 is subjected to higher loads, this site would only be subjected to these higher loads during higher gait speeds, a situation less frequently encountered during normal maturation on pasture than during athletic performance. All the horses used in this study were raised on pasture solely and were not subjected to an exercise level comparable to athletic performance. To conclude, these results show that, quantitatively, the collagen content of equine subchondral bone increases during the early phases of growth and maturation. Furthermore, distinct structural changes in the collagen molecules were observed between the newborn and adult subchondral bone samples using qualitative FTIR analysis. These results are encouraging, since they reflect the potential of FTIR clustering techniques to detect the qualitative and quantitative changes in bone. AcknowledgmentsThis study was funded by Kuopio University Hospital, the Ministry of Education, Finland (University of Eastern Finland grant, projects 5741, 61/627/2005, and 25/627/2006), Academy of Finland (projects 127198, 113112, 213548, and 216231) and the European Commission (219980). ReferencesX. Wei,
T. Rasanen, and
K. Messner,
“Maturation-related compressive properties of rabbit knee articular cartilage and volume fraction of subchondral tissue,”
Osteoarth. Cart., 6
(6), 400
–409
(1998). https://doi.org/10.1053/joca.1998.0143 Google Scholar
A. J. Bailey,
T. J. Sims,
E. N. Ebbesen,
J. P. Mansell,
J. S. Thomsen,
L. Mosekilde,
“Age-related changes in the biochemical properties of human cancellous bone collagen: relationship to bone strength,”
Calcif. Tissue Int., 65
(3), 203
–210
(1999). https://doi.org/10.1007/s002239900683 Google Scholar
D. B. Burr,
“The contribution of the organic matrix to bone's material properties,”
Bone, 31
(1), 8
–11
(2002). https://doi.org/10.1016/S8756-3282(02)00815-3 Google Scholar
J. T. Holopainen,
P. A. Brama,
E. Halmesmaki,
T. Harjula,
J. Tuukkanen,
P. R. van Weeren,
H. J. Helminen, and
M. M. Hyttinen,
“Changes in subchondral bone mineral density and collagen matrix organization in growing horses,”
Bone, 43
(6), 1108
–1114
(2008). https://doi.org/10.1016/j.bone.2008.07.254 Google Scholar
J. A. Buckwalter,
M. J. Glimcher,
R. R. Cooper, and
R. Recker,
“Bone biology. II: Formation, form, modeling, remodeling, and regulation of cell function,”
Instr. Course Lect., 45 387
–399
(1996). Google Scholar
A. Boskey and
R. Mendelsohn,
“Infrared analysis of bone in health and disease,”
J. Biomed. Opt., 10
(3), 031102
(2005). https://doi.org/10.1117/1.1922927 Google Scholar
J. P. Mansell and
A. J. Bailey,
“Abnormal cancellous bone collagen metabolism in osteoarthritis,”
J. Clin. Invest., 101
(8), 1596
–1603
(1998). Google Scholar
P. A. Brama,
R. A. Bank,
J. M. Tekoppele, and
P. R. Van Weeren,
“Training affects the collagen framework of subchondral bone in foals,”
Vet. J., 162
(1), 24
–32
(2001). https://doi.org/10.1053/tvjl.2001.0570 Google Scholar
P. A. Brama,
J. M. TeKoppele,
R. A. Bank,
A. Barneveld, and
P. R. van Weeren,
“Biochemical development of subchondral bone from birth until age eleven months and the influence of physical activity,”
Equine Vet. J., 34
(2), 143
–149
(2002). https://doi.org/10.2746/042516402776767150 Google Scholar
J. M. Very,
R. Gibert,
B. Guilhot,
M. Debout, and
C. Alexandre,
“Effect of aging on the amide group of bone matrix, measured by FTIR spectrophotometry, in adult subjects deceased as a result of violent death,”
Calcif. Tissue Int., 60
(3), 271
–275
(1997). https://doi.org/10.1007/s002239900228 Google Scholar
P. Lasch,
W. Haensch,
D. Naumann, and
M. Diem,
“Imaging of colorectal adenocarcinoma using FT-IR microspectroscopy and cluster analysis,”
Biochim. Biophys. Acta, 1688
(2), 176
–186
(2004). Google Scholar
C. Krafft,
G. Steiner,
C. Beleites, and
R. Salzer,
“Disease recognition by infrared and Raman spectroscopy,”
J. Biophoton., 2
(1–2), 13
–28
(2009). https://doi.org/10.1002/jbio.200810024 Google Scholar
L. Wang and
B. Mizaikoff,
“Application of multivariate data-analysis techniques to biomedical diagnostics based on mid-infrared spectroscopy,”
Anal. Bioanal. Chem., 391
(5), 1641
–1654
(2008). https://doi.org/10.1007/s00216-008-1989-9 Google Scholar
M. R. Van Der Harst,
C. H. van de Lest,
J. Degroot,
G. H. Kiers,
P. A. Brama, and
P. R. van Weeren,
“Study of cartilage and bone layers of the bearing surface of the equine metacarpophalangeal joint relative to different timescales of maturation,”
Equine Vet. J., 37
(3), 200
–206
(2005). https://doi.org/10.2746/0425164054530678 Google Scholar
A. Boskey and
N. Pleshko Camacho,
“FT-IR imaging of native and tissue-engineered bone and cartilage,”
Biomat., 28
(15), 2465
–2478
(2007). https://doi.org/10.1016/j.biomaterials.2006.11.043 Google Scholar
E. P. Paschalis,
K. Verdelis,
S. B. Doty,
A. L. Boskey,
R. Mendelsohn, and
M. Yamauchi,
“Spectroscopic characterization of collagen cross-links in bone,”
J. Bone Miner. Res., 16
(10), 1821
–1828
(2001). https://doi.org/10.1359/jbmr.2001.16.10.1821 Google Scholar
R. Xu and
D. Wunsch,
“Survey of clustering algorithms,”
IEEE Trans Neural Netw., 16
(3), 645
–678
(2005). https://doi.org/10.1109/TNN.2005.845141 Google Scholar
P. N. Tan,
M. Steinbach, and
V. Kumar,
“Cluster analysis: basic concepts and algorithms,”
Introduction to Data Mining, Addison-Wesley, New York
(2006). Google Scholar
C. P. Tarnowski,
M. A. Ignelzi Jr., M. D. Morris,
“Mineralization of developing mouse calvaria as revealed by Raman microspectroscopy,”
J. Bone Miner Res., 17
(6), 1118
–1126
(2002). https://doi.org/10.1359/jbmr.2002.17.6.1118 Google Scholar
P. A. Brama,
D. Karssenberg,
A. Barneveld, and
P. R. van Weeren,
“Contact areas and pressure distribution on the proximal articular surface of the proximal phalanx under sagittal plane loading,”
Equine Vet. J., 33
(1), 26
–32
(2001). https://doi.org/10.2746/042516401776767377 Google Scholar
X. Bi,
G. Li,
S. B. Doty, and
N. P. Camacho,
“A novel method for determination of collagen orientation in cartilage by Fourier transform infrared imaging spectroscopy (FT-IRIS),”
Osteoarthr. Cart., 13
(12), 1050
–1058
(2005). https://doi.org/10.1016/j.joca.2005.07.008 Google Scholar
E. P. Paschalis,
R. Recker,
E. DiCarlo,
S. B. Doty,
E. Atti, and
A. L. Boskey,
“Distribution of collagen cross-links in normal human trabecular bone,”
J. Bone Miner. Res., 18
(11), 1942
–1946
(2003). https://doi.org/10.1359/jbmr.2003.18.11.1942 Google Scholar
J. A. Hartigan and
M. A. Wong,
“Algorithm AS 136: A K-means clustering algorithm,”
J. Royal Stat. Soc. Series C (Appl. Stat.), 28
(1), 100
–108
(1979). Google Scholar
H. H. Bock,
“Origins and extensions of the k-means algorithm in cluster analysis,”
Electron. J. Hist. Prob. Stat., 4
(2),
(2008). Google Scholar
A. Savitzky and
M. J. E. Golay,
“Smoothing and differentiation of data by simplified least squares procedures,”
Anal. Chem., 36
(8), 1627
–1639
(1964). https://doi.org/10.1021/ac60214a047 Google Scholar
F. Holler,
D. H. Burns, and
J. B. Callis,
“Direct use of second derivatives in curve-fitting procedures,”
Appl. Spectrosc., 43
(5), 877
–882
(1989). https://doi.org/10.1366/0003702894202292 Google Scholar
A. J. Owen,
“Uses of Derivative Spectroscopy,”
Agilent Technologies, Santa Clara, CA
(1995). Google Scholar
Y. Ozaki,
A. Mizuno, and
F. Kauneuchi,
“Structural differences between type I and type IV collagen in biological tissues studied in vivo by attenuated total reflection/Fourier transform infrared spectroscopy,”
Appl. Spectrosc., 46
(4), 626
–630
(1992). https://doi.org/10.1366/0003702924125104 Google Scholar
C. Chadefaux,
A.-S. Le Ho,
L. Bellot-Gurlet, and
I. Reiche,
“Curve-fitting Micro-ATR-FTIR studies of the amide I and II bands of type I collagen in archaeological bone materials,”
e-Ps, 6 129
–137
(2009). Google Scholar
J. Kong and
S. Yu,
“Fourier transform infrared spectroscopic analysis of protein secondary structures,”
Acta Biochim. Biophys. Sin (Shanghai), 39
(8), 549
–559
(2007). https://doi.org/10.1111/j.1745-7270.2007.00320.x Google Scholar
A. Tfayli,
O. Piot,
A. Durlach,
P. Bernard, and
M. Manfait,
“Discriminating nevus and melanoma on paraffin-embedded skin biopsies using FTIR microspectroscopy,”
Biochim. Biophys. Acta, 1724
(3), 262
–269
(2005). Google Scholar
C. Xie,
J. Mace,
M. A. Dinno,
Y. Q. Li,
W. Tang,
R. J. Newton, and
P. J. Gemperline,
“Identification of single bacterial cells in aqueous solution using confocal laser tweezers Raman spectroscopy,”
Anal. Chem., 77
(14), 4390
–4397
(2005). https://doi.org/10.1021/ac0504971 Google Scholar
A. Oust,
T. Moretro,
C. Kirschner,
J. A. Narvhus, and
A. Kohler,
“FT-IR spectroscopy for identification of closely related lactobacilli,”
J. Microbiol. Meth., 59
(2), 149
–162
(2004). https://doi.org/10.1016/j.mimet.2004.06.011 Google Scholar
B. Dzuiba,
A. Babuchowki,
D. Nalecz, and
M. Niklewicz,
“Identification of lactic acid bacteria using FTIR spectroscopy and cluster analysis,”
Int. Dairy J., 17
(3), 183
–189
(2007). https://doi.org/10.1016/j.idairyj.2006.02.013 Google Scholar
C. M. Krishna,
G. D. Sockalingum,
R. A. Bhat,
L. Venteo,
P. Kushtagi,
M. Pluot, and
M. Manfait,
“FTIR and Raman microspectroscopy of normal, benign, and malignant formalin-fixed ovarian tissues,”
Anal. Bioanal. Chem., 387
(5), 1649
–1656
(2007). https://doi.org/10.1007/s00216-006-0827-1 Google Scholar
E. Ly,
O. Piot,
R. Wolthuis,
A. Durlach,
P. Bernard, and
M. Manfait,
“Combination of FTIR spectral imaging and chemometrics for tumour detection from paraffin-embedded biopsies,”
Analyst, 133
(2), 197
–205
(2008). https://doi.org/10.1039/b715924b Google Scholar
C. Krafft,
M. Kirsch,
C. Beleites,
G. Schackert, and
R. Salzer,
“Methodology for fiber-optic Raman mapping and FTIR imaging of metastases in mouse brains,”
Anal. Bioanal. Chem., 389
(4), 1133
–1142
(2007). https://doi.org/10.1007/s00216-007-1453-2 Google Scholar
K. Ali,
Y. Lu,
C. Christensen,
T. May,
C. Hyett,
R. Griebel,
D. Fourney,
K. Meguro,
L. Resch, and
R. K. Sharma,
“Fourier transform infrared spectromicroscopy and hierarchical cluster analysis of human meningiomas,”
Intl. J. Mol. Med., 21
(3), 297
–301
(2008). Google Scholar
A. Salman,
J. Ramesh,
V. Erukhimovitch,
M. Talyshinsky,
S. Mordechai, and
M. Huleihel,
“FTIR microspectroscopy of malignant fibroblasts transformed by mouse sarcoma virus,”
J. Biochem. Biophys. Meth., 55
(2), 141
–153
(2003). https://doi.org/10.1016/S0165-022X(02)00182-3 Google Scholar
J. Kneipp,
M. Beekes,
P. Lasch, and
D. Naumann,
“Molecular changes of preclinical scrapie can be detected by infrared spectroscopy,”
J. Neurosci., 22
(8), 2989
–2997
(2002). Google Scholar
|


