
|
|
1.IntroductionBiosensors, which are capable of detecting and quantifying biomarkers in body fluids, help in understanding the role these proteins play in disease diagnosis or prognosis. The body fluids contain large amounts of proteins of a varied nature. Therefore, the sensor should be immune to the presence of interfering agents in the biological fluid. In most of the biosensors, the analyte is detected by selectively immobilizing it on the transducer surface. In such biosensors, when the detection is based on characteristic fluorescence, one of the problems is interference of unwanted fluorescence from the biological fluid. In regular enzyme-linked immunosorbent assay (ELISA), this problem is avoided by washing out the biological fluid from the well plates and in bead-based xMAP technology, beads are removed from the biological fluid. In the case of evanescent wave excitation- or chemiluminescence-based methods, fluorescence/luminescence is produced extremely close to the transducer surface.1, 2 Therefore, the evanescent wave/induced fluorescence- or chemiluminescence-based fiber-optic biosensors have the potential to detect analytes even in the presence of biological fluids. The analytes can be detected by directly dipping the fiber-optic probes in biological fluids; therefore, it uses limited amounts of samples. In last two decades, significant progress has been made in the field of evanescence wave-induced fluorescence/chemiluminescence-based fiber-optic biosensors.1, 2, 3, 4, 5, 6, 7, 8, 9, 10, 11, 12, 13, 14, 15 Despite these advantages, the fiber-optic biosensors have been used, most of the time, only in detection of various kinds of biological analytes.5, 6, 8, 11, 12, 13, 14, 15, 16 Work on quantitative estimation of bioanalytes using fiber-optic sensors is very limited.17 This is due to problem of probe-to-probe signal variability in fiber-optic systems.1 An ideal quantifying biomarker detector requires probe-to-probe signal reproducibility in identical conditions. It has been demonstrated that by using a combination of two tappers the probe-to-probe signal reproducibility can be improved.1 Further theoretical work and experimental results have also demonstrated that a combination of a taper and a constant diameter probe part further enhances the signal.16, 18, 19 In this study, we have used such an evanescent wave-induced fluorescence-based combination tapered fiber-optic biosensor (CTFOB) probe. Another limitation of tapered fiber-optic probe is use of small-diameter fibers (<100 μm). Further tapering of such a small diameter fiber makes these probes very fragile and inhibits its use outside the lab environment. Use of polystyrene fiber probe can be a robust alternative.13 Experiments in our lab have shown that strong autofluorescence associated with polystyrene fiber probe significantly reduces signal to background. In this study, we used 300-μm-diam rugged CTFOB probes, fabricated in our lab from a 600-μm silica-silica multimode fiber.16 In our setup, fluorescence signal was generated by adopting the sandwich assay to CTFOB probes.20 Most of the existing fluorescence/chemiluminescence systems use fluorimeter setup for detection of the fluorescence/luminescence signal.2, 8, 9, 11, 12, 13, 14, 15 We have used a charged-coupled device (CCD) based spectrometer to record the full spectral profile of the fluorescence signal.6, 10, 16 The Least squares fitting method was used to extract a signal from recorded fluorescence spectral profile with the significantly enhanced signal-to-background ratio. Another advantage of our CTFOB probes will be significantly lower cost and their use as on-site fast disposable sensing probes. Multiplexing is also possible with the use of a bundle of CTFOB probes capable of detecting different proteins.21 To establish proof of principle of the utility of a CTFOB dip probe for quantitative estimation of a serum protein, we demonstrated quantitative detection of interleukin IL-6, a cytokine, in serum samples collected from a lupus patient and a lymphoma patient. Cytokines are hormone like polypeptides that are secreted in the course of immunologic and inflammatory responses.22 They function as intercellular signals, are produced by a variety of different cell types, and regulate both local and systemic inflammatory responses. Cytokines are also immunoregulators in wound healing and immune responses. 2.Materials and Methods2.1.MaterialsAll reagents and chemicals were either of analytical grade or chemically pure. Recombinant human IL-6, recombinant human IL-8, and purified antihuman IL-6 capture (Clone MQ2–13A5) antibodies and detection (Clone MQ2–39C3) antibodies were obtained from Biolegend (San Diego, California). Tween-20 was obtained from Sigma Aldrich (St. Louis, Missouri). Ethylenediaminetetraacetic acid (EDTA), sulfosuccinimidyl 4-[N-maleimidomethyl]cyclohexane-1-carboxylate (sulfo-SMCC), and 3-aminopropyltriethoxysilane (APTS) were obtained from Pierce (Rockford, Illinois). β-mercaptoethylamine HCl (MEA), hydrofluoric acid (50%), egg albumin (EA) powder, affinity pure goat antibovine serum albumin, NaOH, acetone, and phosphate-buffered saline (PBS) were obtained from Fisher Scientific (Pittsburgh, Pennsylvania, USA). The amine-reactive Alexa Fluor 488 fluorophore was obtained from Molecular Probes (Eugene, Oregan) and CS-800 spin columns from Princeton Separations (Adelphia, New Jersey). 2.2.Methods2.2.1.Antibody-dye conjugationA mixture of antihuman IL-6 “detection” antibodies (0.5 mg/ml) and an optimum concentration (a dye-to-protein molar ratio of 30) of Alexa Flour 488 was prepared in PBS containing 0.1 M sodium bicarbonate (pH 8.3). The reaction mixture was incubated for 2 h at room temperature with constant shaking. The labeled antibody conjugates were separated from residual dye by use of a gel-filtration spin column (CS-800). The degree of labeling (dye-to-protein ratio) of the labeled antibody was 14. A solution of labeled “detection” anti-IL-6 antibody (1 μg/ml) was prepared with dilution buffer containing PBS and 1 mg/ml of EA. 2.2.2.CTFOB dip-probe preparationQuantitative measurement required identical fabrication of the probes. Each probe was an multimode optical silica/silica fiber, 8 cm long (Polymicro Technologies, Phoenix, Arizona) with a core diameter of 600 μm. Approximately 1.5 cm of protective polyimide buffer surrounding the fiber was removed from one end by burning it off with a Bunsen burner. The fiber was then decontaminated by sonication in a soap solution. This was followed by sonication in deionized water to remove any soot on the surface of the fiber. The cladding of the probe was removed by immersing the 1.5-cm uncoated part in 10% hydrofluoric acid. Some acid ascended by capillarity into the space between fiber probe and polyimide buffer. Capillary action tapered the section between the etched probe and cladded fiber. CTFOB dip probes with core diameters of 300 μm were obtained by adjusting the time of immersion. After being removed from the hydrofluoric acid, the probes were sonicated for 5 min in water, 10 min in 1 M NaOH, and for 5 min in water, and 2 min in acetone. To verify that the fabricated probes were identical, the taper angle for each probe was measured by use of a microscope. The average tapered angle for the probes was 0.058±0.002 rad. Appropriate antibodies were then immobilized on the surface of the probe. 2.2.3.Antibody immobilizationDuring antibody immobilization, the orientation of attached antibodies is controlled to avoid the problem of mixed avidity because an antibody-binding site oriented toward the probe surface may cause it to be unavailable for binding its intended target. To avoid mixed avidity, the immunoglobulin (IgG antibody) is attached to the probe surface from its fab portion. Furthermore, the fluorescence signal in the CTFOB dip probe is produced by evanescent field, which decays exponentially with distance from the probe surface. Therefore, efficient signal generation requires the smallest possible distance between dye molecules and the probe surface. In view of these factors, a single cross-linker was used to immobilize IgG on the probe surface.16 Sulfhydryl residues were introduced into the hinge region of the immunoglobulin (IgG antibody) for conjugation with the maleimide-activated probe surface.23 The cleaned probes were kept for 1 min in 2% APTS solution in dry acetone. APTS was used to derivatize the fiber surface with primary amines. These amines subsequently reacted with the hetero-bifunctional cross-linker, sulfo-SMCC, resulting in a maleimide-activated probe surface capable of reacting with sulfhydryl groups on antibodies. A sulfo-SMCC solution (4.5 mM) was prepared in PBS-EDTA (10 mM EDTA). The probes were placed into the solution for 60 min and then cleaned with the PBS-EDTA solution. To expose the sulfhydryl group of the antihuman IL-6, the capture antibodies were reduced by mixing 0.1 mg/ml of antibody solution in PBS-EDTA with MEA (50 mM). The mixture was incubated for 90 min at 37°C. After incubation, the reduced antibody molecules were desalted by use of a gel-filtration spin column (CS-800). The reduced capture antibody extract was diluted in PBS-EDTA to a concentration of 10 μg/ml. Maleimide-activated probes were incubated in reduced antibody solution for 4 h at room temperature. After being removed from the capture antibody solution, the probes were washed with PBS-EDTA. 2.2.4.Serum samplesThe two serum samples used were part of a larger study for biomarker discovery. Because these investigations have involved the serum/plasma samples collected from human subjects, in accordance with the Helsinki Declaration, we followed the Health Insurance Portability and Accountability Act Privacy and Security Rules for the research, obtained the informed consent from the subjects, and this research was approved by the institutional review board (IRB Protocol No. X090224006) of the University of Alabama at Birmingham. Analysis was performed on small aliquots of samples collected for routine laboratory tests. For the current study, serum samples were obtained from a patient with lupus and from a patient with lymphoma before they were treated with chemotherapy. Handling and processing was similar for the samples. In brief, blood samples were collected without anticoagulant into red-top Vacutainers and allowed to coagulate for 20–30 min at room temperature. Sera were separated by centrifugation, and the specimens were immediately divided into portions, frozen, and stored in a dedicated −80°C freezer. No more than two freeze-thaw cycles were allowed before testing of samples. 2.2.5.Standard sample preparationsRecombinant human IL-6 was used as a standard for a calibration curve. To avoid changes of sample concentrations due to adsorption on the container walls, a dilution buffer containing PBS and EA (1 mg/ml) was used to prepare IL-6 solutions at various standard concentrations (5, 10, 20, 50, 75, 100, 150, 200, 500, and 1000 pM). 2.2.6.Signal detection setupA schematic of the setup for signal detection is shown in Fig.1. A laser diode (Nichia, Tokyo, Japan) of 476 nm was used as an excitation source. Output from laser diode was collimated by mounting it in a collimation tube (Thorlabs Inc., Newton, New Jersey). To block any red-tail emission from the diode, a dichroic bandpass filter (Edmund Optics, Barrington, New Jeresy) with peak transmission at 476 nm and bandwidth of 10 nm was placed in front of the laser. The laser tube was mounted at one port of the collection chamber, and the CTFOB dip probe was mounted on a diagonally opposite port by use of a SMA-adaptable, bare-fiber terminator (Thorlabs Inc., Newton, New Jersey). This arrangement allowed convenient changing of the dip probes for different experiments. One end of the fluorescence collection fiber was mounted on a collection chamber port at a right angle to the laser port and dip-probe port; the other end was mounted on to the collection port of a miniature CCD-based fiber-optic spectrometer (model HR2000, Ocean Optics Inc., Dunedin, Florida). A short-focal-length focusing/collection lens (FCL) was used to focus the laser beam onto a 600-μm core dip probe. The evanescent wave-induced fluorescence from the probe surface coupled back into the probe fiber. The same FCL lens acted as a lens for fluorescence collection and collimation. A dichroic short-pass filter (Maier Photonics Inc., Manchester, Vermont) was placed in the laser beam path, making a 45-deg angle with the laser beam. Fig. 1Block diagram of the experimental setup: LD, laser diode; BF, bandpass filter; ND, neutral density; SF, short-pass filter; LF, long-pass filter; FL and FCL. 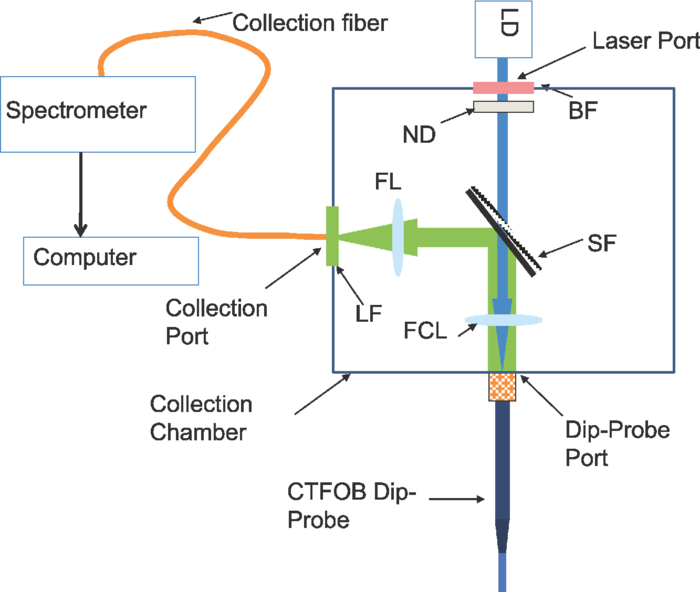 Because the peak emission wavelength for the Alexa 488 dye was 530 nm, a short-pass filter with high reflectivity (95%) at wavelengths of >488 nm and high transmission (90%) for the excitation wavelength at 476 nm was chosen. The short-pass filter allowed the laser light to pass but reflected the collected fluorescence toward the collection port. A focusing lens (FL) focused the fluorescence into the collection fiber. A 488-nm laser line long-pass filter (Edmund Optics, Barrington, New Jersey) was placed in front of the collection fiber. This filter has 99% transmission for wavelengths of >500 nm, but small transmission (0.0001%) for wavelengths of 500 nm. This arrangement improved the signal-to-noise ratio by blocking scattered light from the diode laser. The spectrometer was interfaced to a notebook computer, which collected the spectra. 2.2.7.Signal generation and recordingProbes with immobilized “capture” antibodies were incubated in sample solutions for an appropriate time at room temperature. After removal from the sample (serum or standard) solution, probes were washed for 2 min in a buffer containing PBS and 0.02% Tween-20. After drying the probes, the background signal spectrum was recorded. The CCD-based spectrometer was used to record signal spectra. The probes were incubated for an appropriate time at room temperature in labeled “detection” anti-IL-6 antibody solution (1 μg/ml). Probes were washed for 2 min, then dried before recording the signal spectral profile. The probes were washed for an additional 2 min and dried before the signal was rerecorded. If a probe showed no signal change, then there was no further washing. Otherwise, 2-min washings and subsequent signal recordings continued until no change in signal was observed. Typically, no more than two 2-min washings were required. 2.2.8.Signal extraction by least-squares fitting methodThe signal spectrum profile is a mixture of two profiles: an autofluorescence (background) profile f B(λ) from nonspecific bindings and the characteristic fluorescence profile f Fl(λ) of labeled “detection” antibodies. Mathematically, the recorded signal spectral profile f Signal(λ) is a linear combination of the two: Eq. 1[TeX:] \documentclass[12pt]{minimal}\begin{document}\begin{equation} f_{{\rm signal}} \left(\lambda \right) = a \times f_{\rm B} \left(\lambda \right) + b \times f_{{\rm Fl}} \left(\lambda \right) \end{equation}\end{document}A standard fluorescence spectral profile (entire spectrum) f Fl(λ) of Alexa 488 was recorded after immobilizing only the labeled “detection” antibodies on the probe surface. The background spectral profile (entire spectrum) f B(λ) for each probe was recorded before incubating the probe in labeled detection antibodies. After this incubation, the signal spectral profile (entire spectrum) fSignal(λ) for each probe was recorded. Least-squares fitting to obtain coefficients a and b was achieved by use of the “solver method” of Microsoft Excel. The sum shown in Eq. 2 was obtained from the data of the three recorded profiles, signal fSignal(λ), background fB(λ), and standard profile fFl(λ). Initially guessed values of a and b were used, Eq. 2[TeX:] \documentclass[12pt]{minimal}\begin{document}\begin{equation} \sum {\{ {f_{{\rm Signal}} \left(\lambda \right) - \left[ {a \times f_{\rm B} \left(\lambda \right) + b \times f_{{\rm Fl}} \left(\lambda \right)} \right]}\}^2.} \end{equation}\end{document}By minimizing the sum shown in Eq. 2 by use of a “solver method,” actual values of coefficients a and b were obtained. The ratio of coefficients, b/a, for each probe was taken as the normalized value of the fluorescence signal of that probe. 2.2.9.Bead-based xMAP technologyxMAP technology (Luminex Corp., Austin, Texas) combines the principles of a sandwich immunoassay with fluorescent beads, allowing individual and multiplex analysis of up to 100 different analytes in a single microtiter well. The technique involves polystyrene microspheres internally dyed with differing amounts of two spectrally distinct fluorophores to create a family of 100 different, spectrally addressed sets of beads. Each bead set can be conjugated with a capture antibody specific for a unique target protein. In a multiplexed assay, antibody-conjugated beads are allowed to react with sample (serum or standard). After washing of the beads, detection antibodies are added to a microtiter plate well to form a “capture sandwich” immunoassay. The assay solution is analyzed by a fluorometric array reader, which obtains two fluorescence readings for each bead: one that identifies a bead as a member of one of the 100 sets and another that measures the amount of fluorescent dye, phycoerythrin (PE), bound to the detection antibody. The amount of green fluorescence is proportional to the amount of analyte captured in the immunoassay. Bio-Plex Manager software correlates each bead set to the assay reagent coupled to it. Extrapolating to a standard curve allows quantitation of each analyte in the sample. The xMAP assay for human cytokines IL-2, IL-4, IL-6, IL-8, IL-10, IFN-γ, TNF-α, and granulocyte macrophage colony-stimulating factor (Human Cytokine 8-Plex Assay, Bio-Rad, Hercules, California) was accomplished in 96-well microplates according to the Bio-Rad protocol, as previously described. Samples were analyzed by use of the Bio-Plex suspension array kit (Bio-Rad Laboratories, Hercules, California). Beads, immobilizing by purified antigen (by the vendor), were incubated with sera diluted 1:4, and quantitation was accomplished by incubating the beads with PE-conjugated rabbit antihuman Abs (IgG). The minimum cytokine detection level for these kits was <5 pg/ml. The values were presented as mean ± SE (pg/mL). For these studies, only the xMAP values for IL-6 were utilized to compare the estimates of IL-6 obtained by CTFOB. 3.Results and Discussion3.1.Reduction of Nonspecific SignalsIn fluorescence-based techniques, two main sources of unwanted fluorescence signals can be autofluorescence from nonspecific binding (NSB) of proteins and the false fluorescence from NSB of labeled detection antibodies or residual dye molecules. As we have discussed, the background spectral profile due to autofluorescence can be discriminated against the characteristic fluorescence spectral profile. By using the least-squares fitting method described above, the actual characteristic fluorescence contribution is extracted by subtracting the background spectral profile from the total fluorescence signal profile. A false fluorescence signal from NSB of labeled detection antibody molecules can substantially reduce the detection sensitivity. An earlier reported strategy was used to eliminate such false signals.16 A dilution buffer containing PBS and EA (1 mg/ml) was prepared. The labeled detection anti-IL-6 antibodies were diluted with this buffer to the required concentration of 1 μg/ml. A relatively high concentration of EA molecules (>1,000,000:1) would inhibit the nonspecific adsorption of labeled detection antibodies on the probe surface. 3.2.Reproducibility Test of ProbesVerification of reproducibility of probes after silanization and immobilization is an important aspect of quantitative detection. Six identical probes were prepared by immobilizing capture antibodies. All the probes were incubated in 100 pM IL-6 solution for 1 h. After removal from the sample solution, probes were washed and the background signal was recorded. Later, the probes were incubated for 2 h at room temperature in a solution of labeled detection anti-IL-6 antibody (1 μg/ml). After appropriate washing and drying of the probes, fluorescence signals were recorded. It was found that the variation in fluorescence signal from all the probes was 12% (one standard deviation). This indicates that after silanization and immobilization the probe-to-probe signal variation was not more than 12%. 3.3.Calibration CurveCTFOB dip probes with “capture” anti-IL-6 antibodies immobilized on the surface were used. Four probes were used for signal measurements in each standard IL-6 concentration (5, 10, 20, 50, 75, 100, 150, 200, 500, or 1000 pM). Probes were incubated in respective concentrations of IL-6 solution for 1 h at room temperature. After removal from the sample solution, probes were washed and the background signal was recorded. Later, the probes were incubated for 2 h at room temperature in a solution of labeled detection anti-IL-6 antibody (1 μg/ml). After appropriate washing and drying of the probes, fluorescence spectral profiles were recorded. Least-squares fitting was used to extract the true IL-6 signal from recorded profiles of the probes. The recorded profiles fitted well to the function shown in Eq. 1. Goodness of fitting was evaluated by measuring R 2 for each probe. The smallest value of [TeX:] $R^2= 0.994$ . It was found that signal changes linearly up to 150 pM, beyond this point the signal starts saturating. Two possible factors that can lead to saturation of signal are: the limited numbers of captureantibodies available on the probe surface and the depletion of evanescent wave power along the probe length due to increased absorption at higher concentration. To further verify the cause of saturation, an identical test probe was prepared by incubating it for 1 h in 10 nM solution of IL-6 and subsequently incubating it in a solution of labeled detection anti-IL-6 antibody (1 μg/ml). Variation of fluorescence signal of the test probe with laser power was recorded. It was found that the fluorescence signal changes to perfectly linear with laser power. This observation rules out the saturation effect due to depletion of evanescent wave power; therefore, we can conclude that the saturation of signal for values of >150 pM was due to the limited number of capture antibodies available on the probe surface. A linear calibration curve was plotted from the computed average signals of various values of concentration from 5 to 150 pM (Fig. 2). A linear curve was fitted to the calibration curve with [TeX:] $R^2 = 0.9992$ . To further estimate the accuracy of calibration curve, the concentration of each standard sample was also estimated from its signal value. It can be seen in Table 1, that the estimated values from the calibration curve are quite similar to the corresponding actual sample concentration values. Fig. 2Calibration curve plotted from average fluorescence signal of various concentrations. A linear curve was fitted to the experimental curve with [TeX:] $R^2 = 0.9992$ .  Table 1Actual concentration values and estimated concentration values (from fluorescence signal) of standard IL-6 samples used to plot calibration curve.
3.4.Negative Control ProbeThe specificity of the developed CTFOB dipprobes in detecting IL-6 was evaluated with a negative control probe. Four control probes were prepared by immobilizing anti-IL-6 antibodies. Two were incubated for 1 h at room temperature in the presence of cytokine IL-8 (1 nM), and two probes were incubated in PBS alone. After being washed, the probes were incubated for 2 h at room temperature in a solution containing labeled detection anti-IL-6 antibody. Signals of the probes were recorded after they had been washed and dried. The signals were extracted by the least-squares fitting method with [TeX:] $R^2 \ge 0.994$ . None of the probes showed an appreciable signal. Absence of a signal, even in the presence of a high concentration of another cytokine (IL-8), demonstrated high specificity of these probes for detection of IL-6. To evaluate the efficacy of immobilized “capture” antibodies, two negative control probes were prepared without immobilization of “capture” anti-IL-6 antibodies. To make these probes chemically comparable to IL-6 detection probes, “capture” goat anti-BSA antibodies were immobilized on the probe surfaces. The probes were incubated for 2 h at room temperature in a solution with a high concentration (1 nM) of IL-6. After washing, the probes were incubated for 2 h in solution of labeled detection anti-IL-6 antibody. Subsequently, the probes were washed, and signals were recorded and extracted by the least-squares fitting method with [TeX:] $R^2 \ge 0.994$ . No appreciable signal was noted for any of the probes. By comparing these results for control probes to those obtained from the probes for IL-6 detection, the signal for the IL-6 probes was determined to be specifically due to interaction of IL-6 with immobilized capture anti-IL-6 antibodies. The findings also demonstrated that reduction of antibodies with MEA does not change the efficacy of immobilized capture anti-IL-6 antibodies. 3.5.Statistical Analysis of CTFOB DataFor assessing the performance of the developed CTFOB dip probes, a receiver operating characteristics (ROC) curve was plotted for the data generated by various probes.24 The algorithm to generate ROC parameters was written in Microsoft Excel. Data from 31 probes were used, and the 25 probes used to generate the dose-response curve were expected to give positive signals. Six control probes were not expected to give a signal. The ROC curve for CTFOB dip probes is shown in Fig. 3. Statistical analysis on the signals generated by these probes indicated a maximum accuracy of 97% with 83% specificity; 100% sensitivity was obtained at threshold signal value of 0.01 in arbitrary units. Specificity was 100% at the average signal (0.014 ± 0.007) obtained from the probes incubated for 1 h in the lowest concentration (5 pM) of standard IL-6 solution. The margin of error of the average signal was computed for a 95% confidence level. These results indicate that developed CTFOB dip probes detect cytokine IL-6 with 100% specificity at concentration levels as low as 5 pM. 3.6.Detection of IL-6 in Serum Samples by CTFOB Dip ProbesTwo serum samples were used. Sample 1024 was from a lupus patient, and sample 1027 was from a lymphoma patient. Capture anti-IL-6 antibodies were immobilized on the surface of eight identical dip probes. Four probes were used for measurements in each serum sample. For higher signal levels, the probes were incubated in 50 μl of the respective serum for 2 h at room temperature. Probes were washed and dried after removal from the serum solution, and the background signal was recorded. After appropriate washing, the probes were incubated in detection antibodies for 2 h. Fluorescence spectral profiles were recorded after appropriate washing. Least-squares fitting was used to extract the true IL-6 signal from recorded profiles of the eight probes. Goodness of fitting was evaluated by measuring R 2 for each probe. The smallest value was [TeX:] $R^2 = 0.995$ . Recorded signal profiles from probes incubated in samples 1024 and 1027 are shown in Figs. 4 and 5, respectively. The signal of each sample was taken as the average of the signals extracted from four probes incubated in the serum sample. Measured signal (2-h incubation) values for samples 1024 and 1027 were 0.033 ± 0.005 and 0.012 ± 0.002, respectively. Corresponding computed signals for 1 h incubation were 0.0165 ± 0.0025 (sample 1024) and 0.006 ± 0.001 (sample 1027), respectively. The margin of error of the average signal was computed for a 95% confidence level. Signal value from lupus sample (1024) corresponds to IL-6 concentration of 5.9 ± 0.6 pM (143 ± 15 pg/ml) with 100% specificity while signal value from lymphoma sample (1027) was in the nondetectable limit. Fig. 4Recorded spectral profile of the fluorescence collected from a probe incubated in serum from a lupus patient (1024). The signal spectral profile was separated from the background profile by use of least-squares fitting, with [TeX:] $R^2 = 0.998$ . The overlapping solid line with extracted signal is the actual spectral profile of labeled antibodies.  Fig. 5Recorded spectral profile of the fluorescence collected from a probe incubated in serum from a lymphoma patient (1027). The signal spectral profile was separated from the background spectral profile by use of least square fitting, with [TeX:] $R^2 = 0.996$ . The overlapping solid line with extracted signal is the actual spectral profile of labeled antibodies. 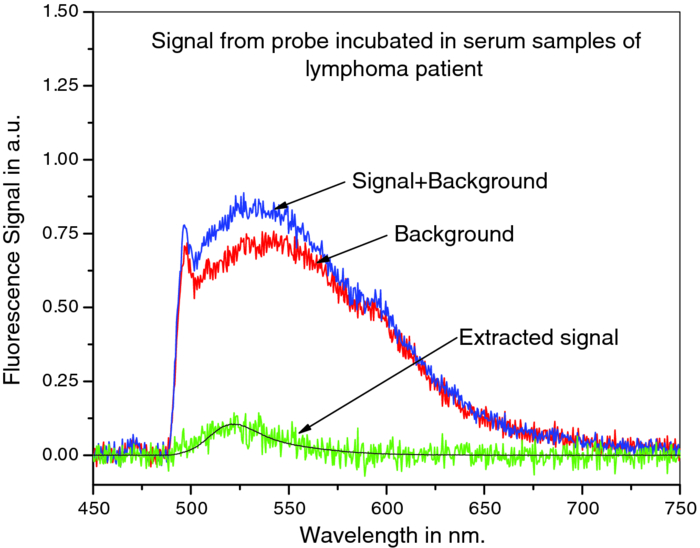 4.ConclusionsBy use of the CTFOB dip probe, we were able to determine presence or absence of IL-6 in serum samples from a lupus patient (sample 1024) and a lymphoma patient (sample 1027). The estimated absolute concentration of IL-6 in the lupus sample (1024) was 5.9 ± 0.6 pM, whereas in lymphoma sample (1027) the probes indicated that IL-6 concentration is below the detectable limit. The results were verified by measuring the IL-6 concentrations by use of xMAP technology. xMAP technique also confirms that the lupus sample (1024) contained elevated levels of IL-6, whereas lymphoma sample (1027) contained suppressed amounts of IL-6. However, the absolute values of IL-6 concentrations, measured by xMAP technology, are different from those obtained by CTFOB dip probes. This discrepancy in absolute values could be due to the changed matrix condition of serum samples by buffer solution used in the xMAP technique. Additionally, the ROC analysis suggests that the dip probes can detect IL-6 concentrations of 5 pM or above with 100% specificity. Finally, we conclude that the CTFOB dip probes are capable of quantitative detection of IL-6 in serum/plasma samples with high specificity. The results of this study provide information for guiding further studies in utilizing these CTFOB dip probes to measure other analytes in body fluids with high specificity and sensitivity. AcknowledgmentsThis work is supported by funds from the National Institute of Health/National Cancer Institute (NCI) to Dr. R. Kapoor (Grant No. 1R03CA136061–01A1) to Dr. U. Manne (Grant No. RO1-CA98932–01 and No. 2U54-CA118948–03), and from the Early Detection Research Network of NCI to Dr. W. E. Grizzle (Grant No. U24-CA086359). We thank Dr. Donald L. Hill, Division of Preventive Medicine, University of Alabama at Birmingham, for his critical review of this paper. ReferencesG. P. Anderson,
J. P. Golden, and
F. S. Ligler,
“A fiber optic biosensor: combination tapered fibers designed for improved signal acquisition,”
Biosens. Bioelectron., 8
(5), 249
–256
(1993). https://doi.org/10.1016/0956-5663(93)80012-E Google Scholar
M. Magrisso,
O. Etzion,
G. Pilch,
A. Novodvoretz,
G. Perez-Avraham,
F. Schlaeffer, and
R. Marks,
“Fiber-optic biosensor to assess circulating phagocyte activity by chemiluminescence,”
Biosens. Bioelectron., 21
(7), 1210
–1218
(2006). https://doi.org/10.1016/j.bios.2005.05.006 Google Scholar
J. P. Golden,
L. C. Shriverlake,
G. P. Anderson,
R. B. Thompson, and
F. S. Ligler,
“Fluorometer and tapered fiber optic probes for sensing in the evanscent wave,”
Opt. Eng., 31
(7), 1458
–1462
(1992). https://doi.org/10.1117/12.58764 Google Scholar
J. P. Golden,
G. P. Anderson,
S. Y. Rabbany, and
F. S. Ligler,
“An evanescent wave biosensor. II. Fluorescent signal acquisition from tapered fiber optic probes,”
IEEE Trans. Biomed. Eng., 41
(6), 585
–591
(1994). https://doi.org/10.1109/10.293246 Google Scholar
J. P. Golden,
E. W. Saaski,
L. C. ShriverLake,
G. P. Anderson, and
F. S. Ligler,
“Portable multichannel fiber optic biosensor for field detection,”
Opt. Eng., 36
(4), 1008
–1013
(1997). https://doi.org/10.1117/1.601146 Google Scholar
R. Kapoor,
N. Kaur,
E. T. Nishanth,
S. W. Halvorsen,
E. J. Bergey, and
P. N. Prasad,
“Detection of trophic factor activated signaling molecules in cells by a compact fiber-optic sensor,”
Biosens. Bioelectron., 20
(2), 345
–349
(2004). https://doi.org/10.1016/j.bios.2004.02.004 Google Scholar
O. S. Wolfbeis,
“Fiber-optic chemical sensors and biosensors,”
Anal. Chem., 78
(12), 3859
–3873
(2006). https://doi.org/10.1021/ac060490z Google Scholar
S. H. Ko and
S. A. Grant,
“A novel FRET-based optical fiber biosensor for rapid detection of Salmonella typhimurium,”
Biosens. Bioelectron., 21
(7), 1283
–1290
(2006). https://doi.org/10.1016/j.bios.2005.05.017 Google Scholar
A. Leung,
P. M. Shankar, and
R. Mutharasan,
“A review of fiber-optic biosensors,”
Sens. Actuators B, 125
(2), 688
–703
(2007). https://doi.org/10.1016/j.snb.2007.03.010 Google Scholar
R. Kapoor,
“CCD based fiber-optic spectrometer detection,”
Biosensors and Biodetection, 435
–445 Humana Press, Jotowa, NJ
(2009). https://doi.org/10.1007/978-1-60327-567-5_25 Google Scholar
A. Petrosova,
T. Konry,
S. Cosnier,
I. Trakht,
J. Lutwama,
E. Rwaguma,
A. Chepurnov,
E. Muhlberger,
L. Lobel, and
R. S. Marks,
“Development of a highly sensitive, field operable biosensor for serological studies of Ebola virus in central Africa,”
Sens. Actuators B, 122
(2), 578
–586
(2007). https://doi.org/10.1016/j.snb.2006.07.005 Google Scholar
O. Salama,
S. Herrmann,
A. Tziknovsky,
B. Piura,
M. Meirovich,
I. Trakht,
B. Reed,
L. I. Lobel, and
R. S. Marks,
“Chemiluminescent optical fiber immunosensor for detection of autoantibodies to ovarian and breast cancer-associated antigens,”
Biosens. Bioelectron., 22
(7), 1508
–1516
(2007). https://doi.org/10.1016/j.bios.2006.07.003 Google Scholar
K. D. King,
G. P. Anderson,
K. E. Bullock,
M. J. Regina,
E. W. Saaski, and
F. S. Ligler,
“Detecting staphylococcal enterotoxin B using an automated fiber optic biosensor,”
Biosens. Bioelectron., 14
(2), 163
–170
(1999). https://doi.org/10.1016/S0956-5663(98)00108-0 Google Scholar
G. P. Anderson,
K. D. King,
K. L. Gaffney, and
L. H. Johnson,
“Multi-analyte interrogation using the fiber optic biosensor,”
Biosens. Bioelectron., 14
(10–11), 771
–777
(2000). https://doi.org/10.1016/S0956-5663(99)00053-6 Google Scholar
T. Konry,
A. Novoa,
Y. Shemer-Avni,
N. Hanuka,
S. Cosnier,
A. Lepellec, and
R. S. Marks,
“Optical fiber immunosensor based on a poly(pyrrole-benzophenone) film for the detection of antibodies to viral antigen,”
Anal. Chem., 77
(6), 1771
–1779
(2005). https://doi.org/10.1021/ac048569w Google Scholar
R. Kapoor and
C. W. Wang,
“Highly specific detection of interleukin-6 (IL-6) protein using combination tapered fiber-optic biosensor dip-probe,”
Biosens. Bioelectron., 24
(8), 2696
–2701
(2009). https://doi.org/10.1016/j.bios.2009.01.046 Google Scholar
L. A. Tempelman,
K. D. King,
G. P. Anderson, and
F. S. Ligler,
“Quantitating staphylococcal enterotoxin B in diverse media using a portable fiber-optic biosensor,”
Anal. Biochem., 233
(1), 50
–57
(1996). https://doi.org/10.1006/abio.1996.0006 Google Scholar
N. Nath and
S. Anand,
“Evanescent wave fiber optic fluorosensor: effect of tapering configuration on the signal acquisition,”
Opt. Eng., 37
(1), 220
–228
(1998). https://doi.org/10.1117/1.601709 Google Scholar
K. Sun and
R. Kapoor,
“Optimum taper length for maximum fluorescence signal from an evanescent wave fiber optic biosensor,”
Proc. SPIE, 6582 68520u
(2008). Google Scholar
G. M. Wyatt,
H. A. Lee, and
M. R. A. Morgan, Immunoassays for Food-Poisoning Bacteria and Bacterial Toxins, 29
–67 Chapman & Hall, London
(1992). Google Scholar
D. R. Walt,
“Molecular biology—Bead-based fiber-optic arrays,”
Science, 287
(5452), 451
–452
(2000). https://doi.org/10.1126/science.287.5452.451 Google Scholar
T. M. Battaglia,
J. F. Masson,
M. R. Sierks,
S. P. Beaudoin,
J. Rogers,
K. N. Foster,
G. A. Holloway, and
K. S. Booksh,
“Quantification of cytokines involved in wound healing using surface plasmon resonance,”
Anal. Chem., 77
(21), 7016
–7023
(2005). https://doi.org/10.1021/ac050568w Google Scholar
G. T. Hermanson, Bioconjugate Techniques, 463
–465 Academic Press, San Diego
(1996). Google Scholar
T. Fawcett,
“An introduction to ROC analysis,”
Pattern Recogn. Lett., 27
(8), 861
–874
(2006). https://doi.org/10.1016/j.patrec.2005.10.010 Google Scholar
|


