|
|
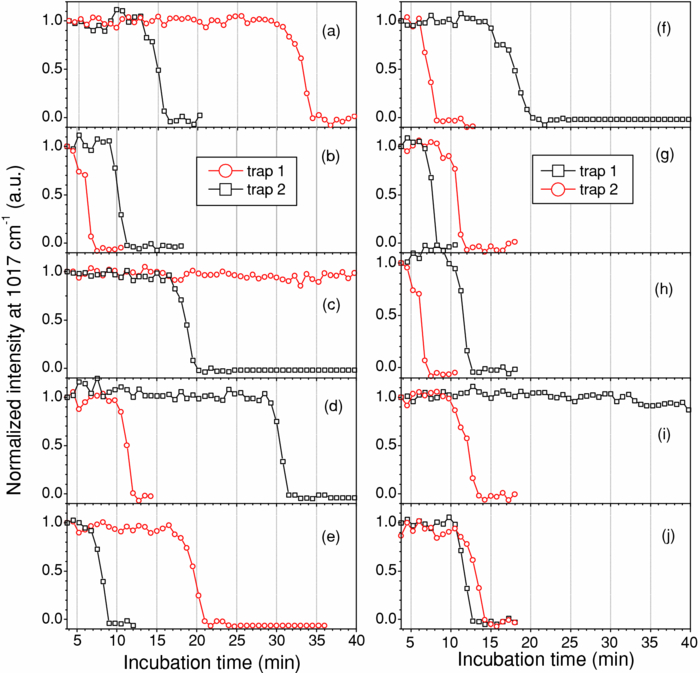
1.IntroductionNoninvasive monitoring of living cells in a physiological medium at the molecular level is essential for the analyses of cellular dynamics and heterogeneity of individual cells.1, 2 The combination of near-infrared Raman spectroscopy with optical tweezers, called Raman tweezers, allows rapid, noninvasive analyses of individual particles held in an optical trap in a liquid with a temporal resolution of up to 2s.3, 4, 5 Single-trap Raman tweezers use a single laser beam for both trapping and Raman spectroscopy3, 4, 5 or use one beam for trapping and another beam of different wavelength for Raman excitation or imaging.6 Recently, single-trap Raman tweezers have found wide application in identification and sorting of single microorganisms,7 chromosomes and mitochondria,8, 9 and cancer cells,10, 11 as well as monitoring dynamic processes of spore germination and bacterial lysis.12, 13 Single-trap Raman tweezers have also been combined with CARS spectroscopy14 and microfluidic devices.15, 16, 17 However, single-trap Raman tweezers can only analyze one captured cell at a time and cannot simultaneously monitor two closely separated cells or two correlated portions of a large cell. It is known that individual microbial cells are interfered with by neighboring cells and physiologically change with their microenvironments. As an example, in budding yeast the parent cell is connected to the daughter cell and there is a dynamic molecule exchange between them.18, 19 It was known that the nucleus of the parent cell splits and migrates into the daughter cell, and the daughter cell continues to grow until it separates from the parent cell, forming a new cell.18 However, it is not clear how the replicated chromosomes are properly segregated and move to the daughter cell dynamically.19 Simultaneously probing molecular compositions of individual cells with Raman spectroscopy might provide valuable information about interaction between the budding cells. On the other hand, individual cells in a genetically homogenous culture show remarkable cellular heterogeneity in their biochemical, physiological, or behavioral properties under the macroscopically same condition.1, 2 As an example, germination of bacterial spores in response to the presence of nutrient germinants is highly heterogeneous in a population.20, 21 Bacterial spores are metabolically dormant and very resistant to a variety of harsh conditions, and can survive for many years.22 When specific nutrients present, spores can rapidly return to active growth through germination, a crucial event in spores’ return to life.22 The binding of germinants to specific receptors triggers the release of many-spore small molecules, including the large depot of dipicolinic acid chelated with Ca2 + (CaDPA). It was found that the duration between the addition of nutrient germinant and the release of CaDPA changes from cell to cell for a genetically homogenous population, even though the environment is macroscopically same. It is unclear where this heterogeneity exactly comes from, but it is relevant to the activation of spore's receptors.22 Apparently, the removal of variations in the complex microenvironment in which individual cells physically locate would eliminate the unknown effects of local nutrient concentration, temperature, and pH values on the heterogeneity. Here, we will show that dual-trap Raman tweezers allows monitoring two Bacillus thuringiensis (Bt) spores separated by ∼3 μm in a liquid nutrient medium and recording their time-lapse Raman spectra respectively. Multiple-beam optical traps have recently been developed for holding and manipulating two or more microscopic particles.23, 24, 25 Dual-trap optical tweezers have been applied for improving the spatial resolution of optical-trap force spectroscopy of single biomolecules,23, 26 and for characterizing bacterial motility.27 The correlated motions of two-interacting microspheres in dual-trap optical tweezers were measured.23 Multibeam optical tweezers can be created by using spatial light modulators28, 29, 30 and computer-controlled scanning reflectors.31, 32 However, biochemical properties of the interacting microscopic objects held in dual traps have not been explored. This paper reports on the development of a dual-trap Raman tweezers system for the manipulation and analysis of two living cells in direct contact or separated by a few micrometers. The novelty of this setup is the combination of dual-beam optical tweezers with Raman spectroscopy, which allows simultaneous acquisition of Raman spectra of two trapped cells. In order to record Raman spectra of the two closely trapped particles simultaneously, we used an imaging spectrograph to separate their Raman scattering lights onto different rows of a CCD camera. We demonstrate that dual-trap Raman tweezers could be used to monitor the dynamic growth of budding yeast cells, as well as monitor the heterogeneity in the release of CaDPA during the germination of two Bt spores under nearly identical microenvironment. The use of a low power near-infrared diode laser keeps the noninvasive advantages of single-trap Raman tweezers. Because two cells can be monitored simultaneously, it significantly reduces the experimental routines, especially for hour-long observations.3, 12 2.Materials and MethodsThe experimental setup is shown in Fig. 1. A diode laser beam (λ = 785 nm) was divided into two beams with a 50–50% beamsplitter, which were recombined with another beamsplitter but with a small angular separation in vertical (y) direction. A dichroic mirror (DM2) was used to introduce the dual laser beams into the objective (100x, numerical aperture NA = 1.30) of an inverted microscope to form dual-beam optical traps, through a pair of lenses L1 and L2 (both with f = 15 cm) and a dichroic mirror (DM1).11 The separation of two traps can be adjusted between 1 and 10 μm with M2 and a beamsplitter (BS2). Typically, the laser power of each trap was ∼5 mW. Two polystyrene beads (2 μm diam) were captured in the dual traps, and the images of the trapped particles can be viewed through a video camera, as shown in the inset of Fig. 1. Backward Raman scatterings from two trapped particles were collected and focused onto different positions of an entrance slit of an imaging spectrograph with a lens L3 (f = 5 cm). The Raman image spots of the two spheres were then imaged on and detected by different rows of a liquid nitrogen-cooled CCD (Roper Scientific Inc., SPEC-10:100BR). The functions of the imaging spectrograph were to disperse Raman spectra onto the CCD camera horizontally and to focus the two Raman imaging spots to different vertical rows of the CCD camera. The CCD camera (1340×100 pixels, with a pixel size of 20×20 μm) can be programmed to operate in either image mode or spectral mode. When operated in spectral mode, the vertical pixels can be binned with selected columns of pixels (to get two separate spectra) or unbinned (to get 100 spectra). Background spectra were collected without particles in both traps and subtracted from the Raman spectra of two trapped particles. And, two identical polystyrene beads (2.0 μm diam) were used to calibrate the spectral responses and wavenumbers of the two channels.3, 4 Fig. 1Experimental setup. A single laser beam was divided with a beamsplitter (BS1), then recombined with a small angular separation with BS2, and introduced into an inverted microscope to form dual optical traps. Backward Raman scattering lights from two trapped particles were focused onto the entrance slit of an imaging spectrograph, which were imaged on different rows of a CCD camera. DM1, DM2—dichroic mirror, Obj—objective, M1, M2—mirrors, L1, L2, L3—optical lens. The inset is the image of two polystyrene beads trapped in dual traps separated by ∼6 μm.  3.Results and DiscussionFigure 2 shows the images of Raman spectral light from two polystyrene beads captured in dual traps (separated by ∼6 μm), recorded by the CCD camera that was operated in the image mode. Raman light from each particle was dispersed in a narrow range of horizontal row pixels and can be well separated vertically. The brightest spots correspond to the strongest Raman band at 1001 cm−1 of the polystyrene spheres. Figure 2 shows Raman spectra of two particles when the CCD camera was operated in the unbinned spectral mode. The results from these plots indicated that the dual-trap Raman tweezers were operated in a confocal configuration; the spectrum of a particle at a position under the microscope was imaged to the row pixels of the CCD camera with a specific column. There was no cross influence between two traps as long as their vertical separation was adjusted to be larger than the spot size (1–2 μm) of each focused beam. In order to determine how many rows of the CCD camera were needed to record the Raman spectrum of a particle in one trap, we plotted the dependence of Raman intensity on y-axis (column pixels) while selecting the row pixel at 1001 cm−1. Figure 2 shows two peaks appearing at column pixels, corresponding to two trapped particles. The bandwidth of each peak was measured with a Guassian fit to be 2.5 pixels, corresponding to a spatial spot of ∼1.5 μm under the microscope. This spot size was determined by the size of the focus of each trap, slightly smaller than the particle size. Thus, the spatial resolution of the dual-trap Raman tweezers was ∼3 CCD pixels. After finding these parameters, we set the CCD camera in the spectral mode as two divisions, each binning 3–4 vertical pixels for each trap, which allowed only two spectra acquired with an exposure time and the spectral resolution was >6 cm−1. Fig. 2(a) Raman spectral images of two trapped beads on the CCD camera with an acquisition time of 1 s, (b) three-dimensional Raman spectra of two trapped polystyrene particles, and (c) spatial dependence of Raman intensity of dual trapped particles along vertical direction of the CCD camera at 1001 cm−1. The laser power was ∼5 mW at each trap.  We applied the dual-trap Raman tweezers for monitoring the dynamic growth of a budding yeast cell in a culture medium. Yeast cells (Saccharomyces cerevisiae) were first cultured in a yeast extract peptone dextrose (YEPD) medium for 12 h at 35°C and then transferred to a microscope sample holder that contains a low-fluorescence medium kept at the same temperature for time-lapse analysis. As shown in the insets of Fig. 3, a budding yeast consisting of a parent cell and a daughter cell, was randomly selected such that the parent cell was trapped with one beam and the daughter cell with another beam. The insets of Fig. 3 show that the daughter cell held in dual trap was still growing, and the cell size increased slightly during a 40-min period. Figures 3 and 3 show Raman spectra of the daughter and parent cells at different times after they were transferred to the new culture medium. The time-lapse Raman spectra contain rich dynamic information of various molecular components in the budding yeast, including the nucleus bands (1093, 812, and 783 cm−1), protein bands (1654 cm−1 for amide I and 1306 cm−1 for amide III), lipid and protein CH bands (1445 cm−1), as well as phenylalanine band at 1004 cm−1 and tyrosine band at 1602 cm−1.33 The spectra data in Figs. 3 and 3 show that (i) the spectra between daughter and parent cells were distinctly different, indicating that they have different molecular compositions, and (ii) the molecular compositions of both the daughter and parent cells were changing during the budding process.34 For example, the lipid and protein CH band at 1445 cm−1 increased in both cells, indicating cell growth upon incubation. (iii) The nucleus bands (1093, 812, and 783 cm−1) of the daughter cell were significantly increased, while the change in these bands of the parent cells was relatively small, indicating much faster growth in daughter cell. This can also be verified from the obvious size increase of the daughter cell (see the inset time-lapse images in Fig. 3). We were able to scan the dual beams across the majority portion of the budding cell using a pair of rapidly scanning Galvano mirrors (see Fig. 1) without moving the cells during the spectral acquisition so that the possibility of the accumulation of small internal organelles in the laser beams was reduced. We can also adjust the vertical separation of the dual traps by mirror M2 or BS2 as shown in Fig. 1. Fig. 3Time-lapse Raman spectra of the daughter cell and parent cell of a budding-yeast cell in dual traps. The inset images are for (a) the daughter and (b) parent cells at 1, 20, and 40 min, respectively. The bright laser spots in the image at 1 min were spectrally blocked in the images at 20 and 40 min. The Raman acquisition time was 60 s. 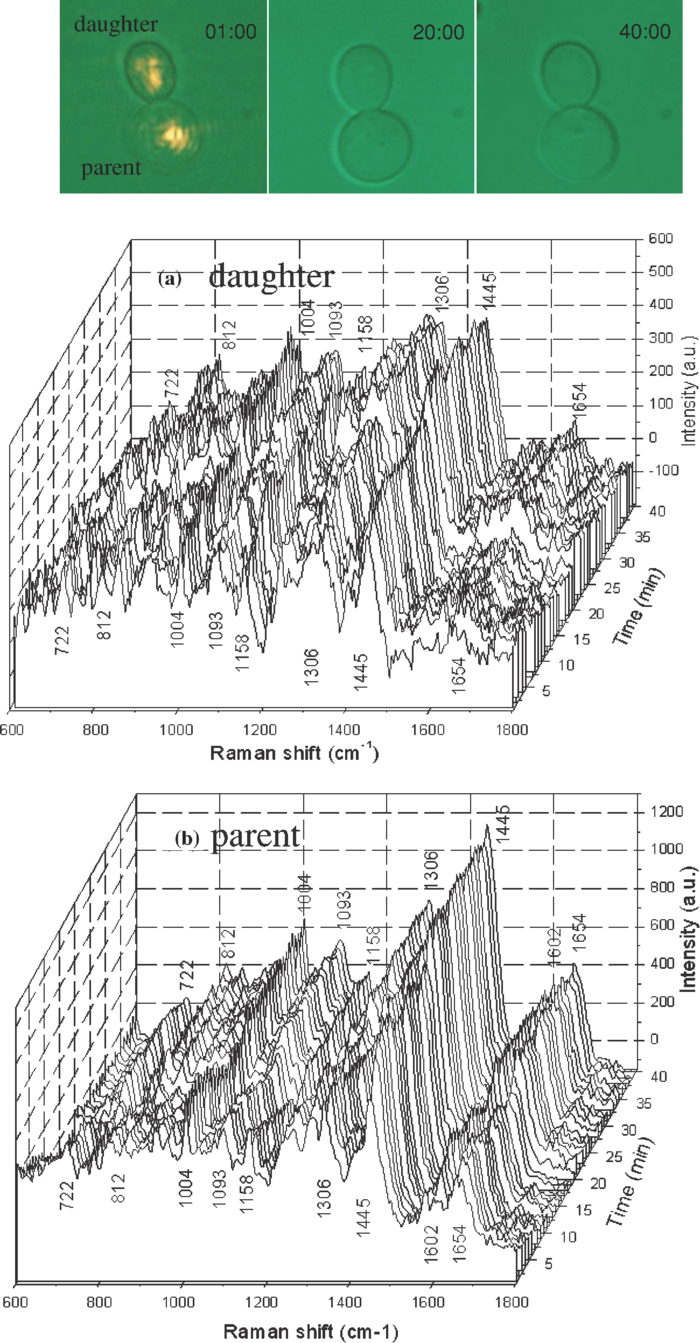 We also applied dual-trap Raman tweezers for monitoring dynamic germination of two Bt spores in a close separation of ∼3 μm in response to the addition of L-alanine nutrient. The Bt spores were prepared and heat activated as described in Refs. 3 and 20. A small amount of Bt spores were added to preheated 25 mM Tris buffer plus 10 mM L-alanine germinant in a sample holder kept at 37°C. Following the addition, two spores were captured in dual traps and Raman spectra were continuously acquired with an acquisition time of 60 s for a total period of 60 min. Figures 4 and 4 show the time-lapse Raman spectra of spores 1 and 2 captured in dual traps, respectively, in which the CaDPA specific bands at 824, 1017, 1395, and 1572 cm−1 were marked.3 Beside the mentioned CaDPA bands, the 1450 cm−1 band is assigned to both CaDPA and the CH vibration of lipids and proteins, and the band 1655 cm−1 is assigned to amid I vibration of proteins.16, 20 Figure 4 shows relative intensities of the CaDPA bands at 1017, 824, and 1572 cm−1 of two Bt spores as the function of the incubation time. The results indicated that (i) when the spores released their CaDPA from the core, all Raman bands (such as 1017, 824, and 1572 cm−1) that are associated with CaDPA decreased simultaneously, and (ii) the time required for spore 1 to complete the CaDPA release upon the exposure to L-alanine was significantly different from that for spore 2, indicating significant cellular heterogeneity in spore germination. Figure 4 shows relative intensities of the Raman bands at 1450 and 1655 cm−1 of two germinating Bt spores as the function of the incubation time. It can be observed that the timing for the decrease of the 1450 cm−1 band is the same as that of CaDPA release for the same spore. However, the intensity of the 1450 cm−1 band did not drop to zero as the other CaDPA band (i.e., 1017 cm−1 band) but remained relatively unchanged after the completion of CaDPA release. This suggests the lipids and proteins still remain inside the spore membrane, even though the CaDPA molecules completely move out of the germinated spore cell during the germination process. The slow change (but no drop to zero) in protein amid band at 1655 cm−1 before and after CaDPA release also supported this conclusion. Fig. 4(a,b) Time-lapse Raman spectra of two individual Bt spores captured in dual traps after the addition of 10 mM of L-alanine; (c) relative intensities of the 824, 1017, and 1572 cm−1 CaDPA bands of two Bt spores as the function of the incubation time; (d) Raman intensities of the 1450 and 1655 cm−1 bands verse incubation time. Note that the time axes in (a,b) was reversed compared to those in (a,b).  We repeated about ten runs of the measurement and observed similar results. Figure 5 shows the results of the repetitive experiments. Two out of twenty spores did not germinate during the observation time of ∼1 h. The data indicated that (i) the time required for an individual spore to complete the release of CaDPA from its core region after the addition of germinant (10 mM L-alanine) varied from individual runs of experiment, and (ii) in the same run of experiment, individual spores in dual traps that was separated by only a few micrometers also had different timing for the Raman intensity of the CaDPA band to drop to zero. Because two spores in one run of the measurement experienced nearly identical microenvironment, the heterogeneity in their germination time truly reflected their intrinsic heterogeneous properties. The intrinsic mechanisms of spore germination and the origin of heterogonous germination time of individual spores are still not fully understood,22, 35 but it may be affected by several factors, including different levels of germination receptor (GR) per spore, the stochastic binding/triggering of GRs by L-alanine, and the variation of local concentration of the germinants, incubation temperature, and pH values where an individual spore locates. The application of dual-trap Raman tweezers system has two significant advantages: (i) the removal of the unknown effects of the variations in local nutrient concentration, temperature, and pH values on heterogonous germination time of individual spores, and (ii) reduction in the experimental routines for hour-long observation because each run of experiments can monitor and analyze two individual cells. Without dual-trap system, it would take up to 20 h to monitor the germination processes of 20 individual spores. But it actually took about 10 h for 10 pairs of spores in the current work. 4.ConclusionWe have demonstrated a dual-trap Raman tweezer system for probing cellular dynamics and heterogeneity of two living cells in direct contact or close separation in a liquid medium. The closest spatial separation of the dual beams was measured to be ∼1.5 μm, and the spectral resolution was >6 cm−1. The dual-trap Raman tweezers allow monitoring the dynamic growth of single budding yeast cells during mitosis by monitoring the nucleus and other cellular components. It also allowed observing dynamic germination and heterogeneity in the release of CaDPA of two B. thuringiensis spores in a close separation. Dual-trap Raman tweezers would find broad applications in monitoring dynamic behaviors of interacting cells. It significantly reduces the experimental routines for hour-long monitoring of single cell physiology because two single cells can be monitored at the same time. AcknowledgmentsWe are grateful to Dr. Pengfei Zhang, Shushi Huang, and Lixin Peng for the participation in some spore experiments. This work was supported by a grant from Guangxi Science and Technology Department of China (Grant No. 0895001-1-1). ReferencesB. F. Brehm-Stecher and
E. A. Johnson,
“Single-cell microbiology: tools, technologies, and applications,”
Microbiol. Mol. Biol. Rev., 68 538
–559
(2004). https://doi.org/10.1128/MMBR.68.3.538-559.2004 Google Scholar
S. V. Avery,
“Microbial cell individuality and the underlying sources of heterogeneity,”
Nat. Rev./Microbiol., 4 577
–587
(2006). https://doi.org/10.1038/nrmicro1460 Google Scholar
L. Kong,
P. Zhang,
P. Setlow, and
Y. Q. Li,
“Characterization of bacterial spore germination using integrated phase contrast microscopy, Raman spectroscopy and optical tweezers,”
Anal. Chem., 82 3840
–3847
(2010). https://doi.org/10.1021/ac1003322 Google Scholar
C. A. Xie,
M. A. Dinno, and
Y. Q. Li,
“Near-infrared Raman spectroscopy of single optically trapped biological cells,”
Opt. Lett., 27 249
–251
(2002). https://doi.org/10.1364/OL.27.000249 Google Scholar
M. Lankers,
J. Popp, and
W. Kiefer,
“Raman and fluorescence spectra of single optically trapped microdroplets in emulsions,”
Appl. Spectrosc., 48 1166
–1168
(1994). https://doi.org/10.1366/0003702944029569 Google Scholar
C. Creely,
G. Volpe,
G. Singh,
M. Soler, and
D. Petrov,
“Raman imaging of floating cells,”
Opt. Express, 13 6105
–6110
(2005). https://doi.org/10.1364/OPEX.13.006105 Google Scholar
C. A. Xie,
D. Chen, and
Y. Q. Li,
“Raman sorting and identification of single living micro-organisms with optical tweezers,”
Opt. Lett., 30 1800
–1802
(2005). https://doi.org/10.1364/OL.30.001800 Google Scholar
J. Ojeda,
C. A. Xie,
Y. Q. Li,
F. E. Bertrand,
J. Wiley, and
T. J. McConnell,
“Chromosomal analysis and identification based on optical tweezers and Raman spectroscopy,”
Opt. Express, 14 5385
–5393
(2006). https://doi.org/10.1364/OE.14.005385 Google Scholar
H. Y. Tang,
H. Y. Yao,
G. W. Wang,
Y. Wang,
Y. Q. Li, and
M. F. Feng,
“NIR Raman spectroscopic investigation of single mitochondria trapped by optical tweezers,”
Opt. Express, 15 12708
–12716
(2007). https://doi.org/10.1364/OE.15.012708 Google Scholar
J. W. Chan,
D. S. Taylor,
T. Zwerdling,
S. M. Lane,
K. Ihara, and
T. Huser,
“Micro-Raman spectroscopy detects individual neoplastic and normal hematopoietic cells,”
Biophys. J., 90 648
–656
(2006). https://doi.org/10.1529/biophysj.105.066761 Google Scholar
H. Yao,
Z. Tao,
M. Ai,
L. Peng,
G. Wang,
B. He, and
Y. Q. Li,
“Raman spectroscopic analysis of apoptosis of single human gastric cancer cells,”
Vib. Spectrosc., 50 193
–197
(2009). https://doi.org/10.1016/j.vibspec.2008.11.003 Google Scholar
L. Peng,
D. Chen,
P. Setlow, and
Y. Q. Li,
“Elastic and inelastic light scattering from single bacterial spores in an optical trap allows the monitoring of spore germination dynamics,”
Anal. Chem., 81 4035
–4042
(2009). https://doi.org/10.1021/ac900250x Google Scholar
D. Chen,
L. Shelenkova,
Y. Q. Li,
C. Kempf, and
A. Sabelnikov,
“Laser tweezers Raman spectroscopy potential for studies of complex dynamic cellular processes: single cell bacterial lysis,”
Anal. Chem., 81 3227
–3238
(2009). https://doi.org/10.1021/ac8023476 Google Scholar
J. W. Chan,
H. Winhold,
S. M. Lane, and
T. Huser,
“Optical trapping and coherent anti-Stokes Raman scattering (CARS) spectroscopy of submicron-size particles,”
IEEE J. Quantum Electron., 11 858
–863
(2005). https://doi.org/10.1109/JSTQE.2005.857381 Google Scholar
K. Ramser,
J. S. Enger,
M. Goksör,
D. Hanstorp,
K. Logg, and
M. Käll,
“A microfluidic system enabling Raman measurements of the oxygenation cycle in single optically trapped red blood cells,”
Lab Chip, 5 431
–436
(2005). https://doi.org/10.1039/b416749j Google Scholar
S. S. Huang,
D. Chen,
P. L. Pelczar,
V. R. Vepachedu,
P. Setlow, and
Y. Q. Li,
“Levels of Ca2+-dipicolinic acid in individual Bacillus spores determined using microfluidic Raman tweezers,”
J. Bacteriol., 189 4681
–4687
(2007). Google Scholar
A. Y. Lau,
L. P. Lee, and
J. W. Chan,
“An integrated optofluidic platform for Raman-activated cell sorting,”
Lab Chip, 8 1116
–1120
(2008). https://doi.org/10.1039/b803598a Google Scholar
C. Pearson,
P. Maddox,
E. D. Salmon, and
K. Bloom,
“Budding yeast chromosome structure and dynamics during mitosis,”
J. Cell Biol., 152 1255
–1266
(2001). https://doi.org/10.1083/jcb.152.6.1255 Google Scholar
M. Gardner,
D. Bouck,
L. Paliulis,
J. Meehl,
E. O'Toole,
J. Haase,
A. Soubry,
A. Joglekar,
M. Winey,
E. D. Salmon,
K. Bloom, and
D. Odde,
“Chromosome congression by Kinesin-5 motor-mediated disassembly of longer kinetochore microtubules,”
Cell, 135 894
–906
(2008). https://doi.org/10.1016/j.cell.2008.09.046 Google Scholar
D. Chen,
S. S. Huang, and
Y. Q. Li,
“Real-time detection of kinetic germination and heterogeneity of single Bacillus spores by laser tweezers Raman spectroscopy,”
Anal. Chem., 78 6936
–6941
(2006). Google Scholar
S. C. Stringer,
M. D. Webb,
S. M. George,
C. Pin, and
M. W. Peck,
“Heterogeneity of times required for germination and outgrowth from single spores of nonproteolytic Clostridium botulinum,”
Appl. Env. Microb., 71 4998
–5003
(2005). https://doi.org/10.1128/AEM.71.9.4998-5003.2005 Google Scholar
P. Setlow,
“Spore germination,”
Curr. Opin. Microbiol., 6 550
–556
(2003). https://doi.org/10.1016/j.mib.2003.10.001 Google Scholar
J. R. Moffitt,
Y. R. Chemla,
D. Izhaky, and
C. Bustamante,
“Differential detection of dual traps improves the spatial resolution of optical tweezers,”
Proc. Natl. Acad. Sci. USA, 103 9006
–9011
(2006). https://doi.org/10.1073/pnas.0603342103 Google Scholar
M. P. Macdonald,
G. C. Spalding, and
K. Dholakia,
“Microfluidic sorting in an optical lattice,”
Nature, 421 421
–424
(2003). https://doi.org/10.1038/nature02144 Google Scholar
M. Polin,
D. G. Grier, and
S. R. Quake,
“Anomalous vibrational dispersion in holographically trapped colloidal arrays,”
Phys. Rev. Lett., 96 088101
(2006). https://doi.org/10.1103/PhysRevLett.96.088101 Google Scholar
E. A. Abbondanzieri,
W. J. Greenleaf,
J. W. Shaevitz,
R. Landick, and
S. M. Block,
“Direct observation of base-pair stepping by RNA polymerase,”
Nature, 438 460
–465
(2005). https://doi.org/10.1038/nature04268 Google Scholar
T. L. Min,
P. J. Mears,
L. M. Chubiz,
C. V. Rao,
I. Golding, and
Y. R. Chemla,
“High-resolution, long-term characterization of bacterial motility using optical tweezers,”
Nat. Methods, 6 831
–835
(2009). https://doi.org/10.1038/nmeth.1380 Google Scholar
D. G. Grier,
“A revolution in optical manipulation,”
Nature, 424 810
–816
(2003). https://doi.org/10.1038/nature01935 Google Scholar
H. Melville,
G. Milne,
G. Spalding,
W. Sibbet,
K. Dholakia, and
D. McGlloin,
“Optical trapping of three-dimensional structures using dynamic holograms,”
Opt. Express, 11 3562
–3567
(2003). https://doi.org/10.1364/OE.11.003562 Google Scholar
R. L. Eriksen,
V. R. Daria, and
J. Glückstad,
“Fully dynamic multiple-beam optical tweezers,”
Opt. Express, 10 597
–602
(2002). Google Scholar
C. Mio,
T. Gong,
A. Terray, and
D. W. M. Marr,
“Design of a scanning laser optical trap for multiparticle manipulation,”
Rev. Sci. Instrum., 71 2196
–2200
(2000). https://doi.org/10.1063/1.1150605 Google Scholar
K. Visscher,
S. P. Gross, and
S. M. Block,
“Construction of multiple-beam optical traps with nanometer-resolution position sensing,”
IEEE J. Quantum Electron., 2 1066
–1076
(1996). https://doi.org/10.1109/2944.577338 Google Scholar
C. Xie,
N. Nguyen,
Y. Zhu, and
Y. Q. Li,
“Detection of the recombinant proteins in single transgenic microbial cells using laser tweezers and Raman spectroscopy,”
Anal. Chem., 79 9269
–9275
(2007). https://doi.org/10.1021/ac0710329 Google Scholar
C. Pearson,
P. Maddox,
E. D. Salmon, and
K. Bloom,
“Budding yeast chromosome structure and dynamics during mitosis,”
J. Cell Biol., 152 1255
–1266
(2001). https://doi.org/10.1083/jcb.152.6.1255 Google Scholar
P. F. Zhang,
W. Garner,
X. Yi,
J. Yu,
Y. Q. Li, and
P. Setlow,
“Factors affecting the variability in the time between addition of nutrient germinants and rapid DPA release during germination of spores of Bacillus species,”
J. Bacteriol., 192 3608
–3619
(2010). Google Scholar
|