
|
|
1.IntroductionAtherosclerotic plaque is the underlying cause of most heart attacks and strokes.1 Atherosclerosis was once viewed primarily as a lipid disorder. Recently, it has come to be viewed more as an inflammatory disease.2 However, these two views are not contradictory, as lipoprotein accumulation and degradation by inflammatory cells, principally monocyte-derived macrophages, is perhaps the central event in the development of atherosclerotic plaque.3 Macrophages can be beneficial, removing lipoproteins from atherosclerotic plaque via their scavenging function.4 Conversely, they can be harmful, releasing toxic products of peroxidative lipoprotein metabolism into the plaque.5 The key lipoprotein in this process is oxidized low density lipoprotein (oxLDL), which induces lipid loading of cultured macrophages transforming them into foam cells.6, 7 Initially, most of this oxLDL is contained within foam cell lysosomes primarily in the form of the peroxidized lipid-protein complex ceroid.8 Ceroid is thought to have detergent properties that dissolve membranes, causing cell injury and necrosis, and causing release of the toxic complex into the core of the plaque. Extravasation of ceroid results in plaque progression and ultimately plaque irreversibility.9 Pappenheimer and Victor were first to report the presence of ceroid in atherosclerotic plaque.10 Since then, several reports have described ceroid in the full spectrum of atherosclerotic lesions.11, 12, 13 Ceroid is a golden yellow, granular or globular, lipoid pigment. In tissue, it is identified histochemically by insolubility in lipid solvents and stainability with neutral lipid dyes.14, 15, 16 Ceroid is also characterized by the emission of intense yellow autofluorescence when excited with ultraviolet or visible light.17, 18 This definition, however, provides no information as to the origin or chemical nature of ceroid, and its in vivo composition remains largely speculative. This is because ceroid is insoluble in aqueous and organic solvents, and cannot be extracted from the atherosclerotic plaque and purified for conventional chemical analysis. In this study we have characterized the chemical nature of ceroid deposits in situ in atherosclerotic plaques using a combination of fluorescence and Raman spectroscopy. Raman spectra result from molecular vibrations and consist of unique combinations of sharp bands that enable identification of the chemical species involved.19 The utility of Raman spectroscopy for probing the composition of human tissue is well established.20, 21 One of the great advantages of this technique is it provides information about the concentration of biochemicals in their native microenvironments, nondestructively, without the need for homogenization, extraction, purification, or the use of dyes or labels.22 Raman spectroscopy has been applied to the biochemical characterization of individual lipoproteins.23 Here we apply it to biochemical characterization of ceroid,24 focusing on several chemical species postulated in the literature to comprise ceroid.17 These species include products of LDL modification that shed light on the process of lipoprotein degradation in atherosclerotic plaque, such as the Fenton reaction,25 myeloperoxidase (MPO) pathways,26, 27 and the Maillard glycation reaction.28 This in turn provides insight into the pathogenesis of atherosclerosis, and may suggest avenues to induce regression or prevent progression of atherosclerotic plaques with medical therapy. 2.Materials and Methods2.1.Tissue SamplesRaman spectra were collected from human coronary artery and aorta tissue samples obtained from explanted recipient heart specimens or at autopsy. To minimize the effects of tissue degradation, the samples were collected within 30 min of surgical excision or autopsy, rinsed with phosphate-buffered saline (PBS), snap frozen in liquid nitrogen, and stored at –85°C until use. Immediately prior to data acquisition, samples were mounted in Histoprep (Colorado Histoprep, Fort Collins, Colorado), and 6-μm-thick cryomicrotome sections were cut and mounted on 1-mm-thick MgF2 flats (Moose Hill Enterprises Incorporated, Sperryville, Virginia) for spectral microscopy. Contiguous tissue sections were mounted on glass slides, lipid extracted (in 50, 75, and 100% ethanol), rehydrated (in 50 and 25% ethanol), and stained with Oil Red O (ORO) (Poly Scientific Research and Development Corporation, Bay Shore, New York). A total of 66 ceroid deposits were examined: 39 deposits in five samples of coronary artery and 27 deposits in six samples of aorta from 11 patients. Previous studies have shown no significant change in the Raman spectra of atherosclerotic plaque pre- and postfreezing (unpublished data). This should also be true of ceroid deposits, which are already end-oxidized and have deposited in the tissue in an insoluble form. 2.2.Chemical SpeciesRaman spectra were acquired from known chemical constituents of atherosclerotic plaque as well as several chemical species postulated in the literature to comprise ceroid deposits. Spectra of cholesteryl linoleate, cholesteryl oleate, cholesterol, collagen, β-carotene, and calcium hydroxyapatite were obtained as previously described.29 The remaining spectra were acquired from chemicals purchased from Sigma (Saint Louis, Missouri) unless otherwise stated. These include: high-density lipoprotein (HDL) (human plasma) and LDL (human plasma); Cu2+-oxLDL and MPO/H2O2/NO2-oxLDL (courtesy of Hoff); MPO/H2O2/HOCl-oxLDL (courtesy of Hazen); diacetyl dityrosine (courtesy of Sayre); the Maillard reaction product synthesized according to the method of McPherson.;30 the antioxidants L-ascorbic acid, α-tocopherol and retinal palmitate; and hemoglobin (human, Ao ferrous). 2.3.InstrumentationThe fluorescence and Raman spectra of all tissues and chemical species were acquired using the confocal spectral microscopy system shown in Fig. 1 and described previously.31 Briefly, 830-nm light from a Ti:sapphire laser (Coherent Innova 90C/Spectra Physics 3900S, Coherent Incorporated, Santa Clara, California) with a typical power of 150 mW was used to excite the Raman scattering. A 63× objective (0.9 NA) focuses the excitation beam and collects the Raman scattered light in a backscattering geometry. The collected light was passed through a confocal pinhole to achieve a spatial resolution of ~(2 μm)3, filtered by a holographic Raman notch filter (Kaiser Optical Systems, Ann Arbor Michigan), launched into a spectrograph (Chromex 250IS/SM spectrograph monochromator, Albuquerque, New Mexico), and detected using a liquid-nitrogen-cooled charge-coupled device detector (Princeton Instruments, Princeton, New Jersey). The spectrograph has a turret that holds gratings for a range of measurements. For the Raman studies, a 600-grooves/mm grating blazed at 1 μm was used along with the 140-μm spectrograph entrance slit setting, providing ~8-cm–1 spectral resolution. Fig. 1Schematic representation of the confocal Raman and fluorescence spectral microscopy instrumentation.  Simply by switching the excitation source, the filters/ beamsplitters, and spectrograph grating, the system can be used for fluorescence spectral microscopy. For fluorescence measurements, 476-nm excitation light with typical power of 5 mW was delivered to the system via fiber optics from an argon ion laser (Coherent Innova 700, Coherent Incorporated, Santa Clara, California). A 600-grooves/mm grating blazed at 500 nm was used for the fluorescence measurements. The switch between Raman and fluorescence can be made in <1 min. 2.4.Data ProcessingFluorescence data were typically collected for 0.5–5 s. Raman spectra were collected for 60–500 s to ensure a signal-to-noise ratio adequate to observe species present at low concentrations, such as LDL peroxidation, nitration, and glycation products, which were not detected in the previous Raman ceroid study.32 Often the ceroid deposits had to be photobleached for several minutes to reduce the intense background fluorescence before acquiring a Raman spectrum. All spectral data processing was performed in MATLAB 5.31 (MathWorks, Natick, Massachusetts). Both Raman and fluorescence data were corrected for the spectral response of the system using a tungsten light source and were frequency calibrated using the Raman lines of toluene (Raman) or a mercury lamp (fluorescence). Cosmic rays were removed with a derivative filter and the small background from the MgF2 flat subtracted. Raman data were fit with a fifth-order polynomial, which was subtracted from the spectra (in addition to the small background from the MgF2) to remove the fluorescence background. Raman spectra were also corrected for acquisition time and laser power. 2.5.Spectral ModelingThe chemical composition of the ceroid deposits was determined by analyzing each Raman spectrum with a model. The model uses the Raman spectra of the chemical species described before, called basis spectra. Non-negative least-squares fitting yields the contribution (fit coefficient) of each basis spectrum to the Raman spectrum of the ceroid deposit. The fit coefficients are direct reflections of the concentration of chemical species present in the ceroid deposit. Fit coefficient errors associated with our modeling approach, the noise in the data, and the Raman scattering cross section of each component were assessed using an analytical formula described previously.33 Model components with fit coefficients less than the error were excluded from analysis, and each Raman spectrum was refit using only those model components with significant fit coefficients. Additional errors in the fit coefficients may be present due to variations in the turbidity of the pure chemical species used to generate the basis spectra and the fluorescence background removal. 3.Results3.1.Raman Spectra of Low-Density Lipoprotein and Its Modification ProductsRaman spectra of LDL and its modification products are shown in Fig. 2a. These spectra all have features in common, as they all contain LDL. However, there are distinct Raman bands that indicate differences due to peroxidation, nitration, and glycation effects. Figure 2b displays difference spectra, calculated by subtracting one Raman spectrum from another, for several of the more similar spectra, highlighting distinct Raman bands that reflect changes in lipid and protein structure that ensue during specific modification processes. Fig. 2(a) Raman spectra of LDL and its modification products represented in this study. From bottom to top, the spectra are native LDL, Cu2+-oxLDL (Fenton Reaction), MPO/H2O2/HOCl-oxLDL, MPO/H2O2/NO2-oxLDL, diacetyl dityrosine, and Maillard reaction. (b) Difference spectra, calculated by subtracting one Raman spectrum from another, highlight distinct Raman bands that reflect changes in lipid and protein structure ensuing during specific modification processes. From bottom to top, the spectra are (native LDL) – (Cu2+-oxLDL), (native LDL) – (MPO/H2O2/HOCl-oxLDL), (Cu2+-oxLDL) – (MPO/H2O2/HOCl-oxLDL), and (MPO/H2O2/NO2-oxLDL) – (diacetyl dityrosine). Arrows denote Raman bands, discussed in the text, at 1440, 1632, 1655, and 1670 cm−1.  As shown in Fig. 2b, the 1655-cm−1 band, due to a C=C stretching mode indicative of unsaturated bonds, decreases in intensity in the spectra of both Cu2+-oxLDL (Fenton reaction) and MPO/H2O2/HOCl-oxLDL (MPO-hypochlorite pathway) when compared to the spectrum of native LDL.34 This loss of unsaturation, characteristic of lipid oxidation, is also evident in the 1440-cm–1 region, assigned predominately to a CH2 scissoring mode. The broad band at 1655 cm−1 in the spectrum of MPO/H2O2/HOCl-oxLDL may represent an interplay between the amide-1 vibration, the lipid C=C stretching mode, and other undetermined bands. The appearance of a band at 1670 cm–1 in the spectrum of Cu2+-oxLDL may indicate a shift from cis to trans isomers ensuing during lipid peroxidation.34 The spectrum of Cu2+-oxLDL exhibits a unique band at 1632 cm−1, possibly related to a C=C stretching vibration of conjugated trienes34 or C=O stretch produced by ketone formation.32 This band was present in the Raman spectrum of thermally oxidized lipid published by van der Pol., presented in the context of a study that also employed a combination of fluorescence and Raman spectroscopy to characterize ceroid deposits.32 Although their research elegantly demonstrated the approach, products of lipid peroxidation were not detected. This is likely due to differences in the acquisition times employed in the two studies. 3.2.Ceroid CompositionCeroid deposits were presumptively identified by comparison of a phase contrast image of an unstained tissue section used for spectroscopy and a lipid-extracted ORO stained contiguous section. A fluorescence spectrum was obtained from each deposit so identified to confirm fluorescence features characteristic of ceroid. Figure 3 shows the data used to identify one ceroid deposit: a phase contrast image [Fig. 3a]; the corresponding lipid-extracted ORO-stained section [Fig. 3b]; and the fluorescence spectrum acquired from the deposit, highlighted by a box in Fig. 3a [Fig. 3c]. A Raman spectrum was collected from each ceroid deposit identified, and the spectrum fit with a spectral model that yielded the contribution of native and modified LDLs and other chemical species to the ceroid deposit. The accuracy of the model can be qualitatively determined by observing the residual, calculated by subtracting the model fit from the Raman spectrum of the deposit. Figure 3d shows the Raman spectrum of the ceroid deposit presented in Fig. 3a. The model fit and residual are also shown. The small size of the residual indicates a good fit. Although the model employed in this analysis was able to account for the majority of the spectral features observed, small amounts of structure were present in the residuals, indicating that chemical species are present in the deposits at low concentrations or with small Raman scattering cross sections that are not contained in our current model. Fig. 3(a) Phase contrast image of a ceroid deposit in a coronary artery plaque (size bar 25 μm). (b) White-light image demonstrating a positive ORO stain for ceroid following lipid extraction. (c) fluorescence spectrum acquired from the deposit, and (d) Raman spectrum acquired from the deposit (solid line) with corresponding model fit (open circles) and residual (below). 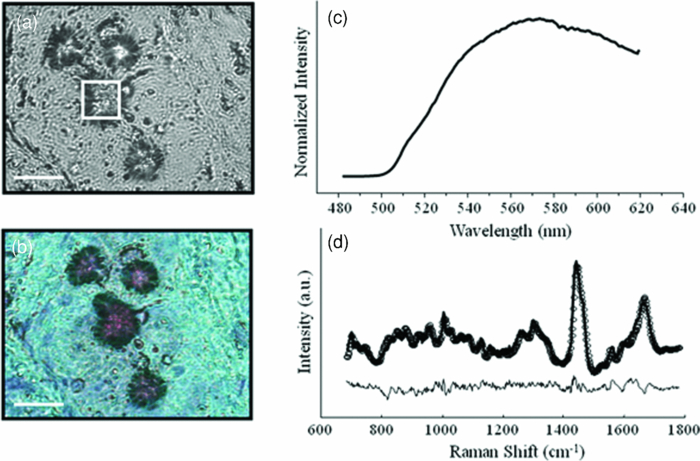 Histograms showing the average composition of the ceroid deposits examined in aorta and coronary artery plaques are shown in Figs. 4a and 4b, respectively. The most notable finding in our study is that a variety of mechanisms of LDL modification suggested by in vitro studies are confirmed to contribute to ceroid formation in vivo. In accordance with in vitro predictions, LDL appears within the deposits primarily in its peroxidized form (less native LDL than all LDL peroxidation products detected). Large amounts of free cholesterol and cholesteryl esters are also seen in the deposits because they are byproducts of LDL catabolism within macrophages.3 The primary forms of modified LDL detected in both coronary artery and aortic plaques are products of the Fenton reaction (Cu2+-oxLDL) and MPO-hypochlorite pathway (MPO/H2O2/HOCl- oxLDL). These two peroxidation products occurred in similar concentrations within the deposits and represented approximately 40 and 30% of the total LDL (native and peroxidized) in the aorta and coronary artery deposits, respectively. Our Raman studies indicate that MPO-mediated LDL modification in ceroid occurs predominately via the hypochlorite rather than the nitric oxide pathway, although diacetyl dityrosine is present in small amounts within the deposits. Fig. 4Histograms displaying the average composition of ceroid deposits in (a) aorta and (b) coronary artery plaques. The two standard deviation confidence intervals are shown for each model component. 1. Cu2+-oxLDL (Fenton reaction), 2. MPO/H2O2/HOCl-oxLDL, 3. MPO/H2O2/NO2 –oxLDL, 4. diacetyl dityrosine, 5. Maillard reaction, 6. cholesterol, 7. cholesteryl linoleate, 8. cholesteryl oleate, 9. HDL, 10. LDL, 11. α-Tocopherol, 12. retinal palmitate, 13. ascorbic acid, 14. β-carotene, 15. collagen, 16. hemoglobin, and 17. calcification.  The presence of collagen, seen in particular in aortic samples [Fig. 4a], is in agreement with ultrastructural studies that have shown ceroid like lipid droplets and protein modification products in association with collagen within atherosclerotic plaques.35 Several antioxidants have been implicated in both the inhibition and promotion of ceroid formation. As shown in Fig. 4, in our Raman studies retinal palmitate and ascorbic acid were detected in ceroid deposits, while α-tocopherol and β-carotene were not. 4.DiscussionMechanistic insight into ceroid formation is complicated by the fact that it cannot be extracted and purified for chemical analysis. Furthermore, a wide variety of chemical species that emulate ceroid fluorescence can be produced in different in vitro model systems. On the basis of such studies, numerous routes of ceroid formation have been proposed.24 In this study, we analyzed the chemical composition of ceroid deposits in situ within atherosclerotic plaques, without the need for extraction, using a combination of fluorescence and Raman spectral microscopy. This approach allowed assessment of the physiological relevance of several of the in vitro models of ceroid formation. The Fenton reaction, in which LDL is peroxidized by a hydroxyl radical formed in the presence of the ferrous ion, is one of the earliest proposed and most broadly accepted mechanisms of ceroid formation.25 Our results now provide direct evidence of a key role for the Fenton reaction in ceroid formation. As expected, the concentration of native LDL and Cu2+-oxLDL are inversely correlated in the ceroid deposits examined. The presence of hemoglobin in the deposits further supports the role of the Fenton reaction in ceroid formation, confirming a source of iron. The presence of hemoglobin, seen in Fig. 4, is consistent with both the previous Raman study of ceroid32 and histochemical studies reporting the colocalization of ceroid and hemoglobin.36 An alternate pathway of LDL modification in ceroid is via MPO, an oxidative lysosomal enzyme present in macrophages. MPO-mediated LDL modification can occur via hypochlorite (HOCl), a two-electron oxidant formed in the presence of H2O2, which generates a high-uptake LDL primarily by peroxidizing the protein component.26 In contrast, LDL modification by MPO and H2O2 in the presence of nitric oxide (NO2) generates a high uptake LDL, in which the lipids are peroxidized and the proteins are nitrated.27 Other protein nitration products, such as dityrosine, have also been suggested to play a role in ceroid formation.37 Our Raman studies indicate that MPO-mediated LDL modification in ceroid occurs predominately via the hypochlorite rather than the nitric oxide pathway, although diacetyl dityrosine is present in small amounts within the deposits. Reactions between various carbohydrates present in atherosclerotic plaques, termed glycation or Maillard reactions, also give rise to a group of moieties with fluorescence similar to that of ceroid.28 Although a role has been suggested in ceroid formation, Maillard reaction products are not detected in the ceroid deposits in our Raman studies. Several antioxidants have been implicated in both the inhibition and promotion of ceroid formation. For example, α-tocopherol, generally considered an endogenous antioxidant in LDL, has been implicated in the reduction of the ferric ion necessary to initiate LDL peroxidation through the Fenton reaction.38 There are other antioxidants whose roles in atherogenesis and, particularly ceroid formation, are controversial, including ascorbic acid, β-carotene, and retinal palmitate.39, 40, 41 As shown in Fig. 4, in our Raman studies retinal palmitate and ascorbic acid were detected in ceroid deposits, while α-tocopherol and β-carotene were not. α-tocopherol and β-carotene are present in native LDL,42 but were not present in the modified LDL-rich ceroid deposits. There are at least two possible explanations for this finding. It may indicate that α-tocopherol and β-carotene functioned as antioxidants, and that α-tocopherol- and β-carotene-containing LDLs were not oxidized and therefore did not end up in ceroid deposits. Alternatively, α-tocopherol and β-carotene may have functioned in a pro-oxidant capacity and were consumed during the process of ceroid formation. Thus, from this study it is difficult to assess the roles of α-tocopherol and β-carotene in ceroid formation. Conversely, the persistence of retinal palmitate and ascorbic acid within ceroid deposits suggests that they did not play a role as antioxidants or in the formation of ceroid. 5.ConclusionsThe combination of Raman and fluorescence spectral microscopy allows in situ analysis of tissue biochemistry not achievable by any other means. In this study, knowledge of the composition of ceroid deposits so obtained provides insight into the underlying mechanisms of ceroid formation, thereby advancing understanding of the atherosclerotic disease process. However, this approach has the potential to provide insight into numerous aspects of disease progression and pathogenesis, not only in atherosclerosis, but in other disease processes as well.43 AcknowledgmentsThe authors thank Michael S. Feld of the George R. Harrison Spectroscopy Laboratory at the Massachusetts Institute of Technology for his unwaivering support of this work and of our entire body of work to date in biomedical spectroscopy. He has contributed his time, expertise, and unique perspective to all of our endeavors and has been a true mentor to us and, either directly or indirectly, to everyone working in the field of biomedical optics. The authors also thank Henry F. Hoff, of the Lerner Research Institute, Department of Cell Biology, Cleveland Clinic Foundation, Stanley L. Hazen of The Cleveland Clinic Heart Center, Cleveland Clinic Foundation, and Lawrence M. Sayre of the Department of Chemistry, Case Western Reserve University for the contribution of chemicals to include in our spectral model and valuable discussions. This research was supported by the NIH National Center for Research Resources Program Grant No. P41-RR-02594 and Pathology Associates of University Hospitals. ReferencesM. A. Munger and
D. W. Hawkins,
“Atherothrombosis: epidemiology, pathophysiology, and prevention,”
J. Am. Pharm. Assoc., 44
(2 Suppl 1), S5
–12
(2003). Google Scholar
quiz S12
–13
(2004) Google Scholar
P. S. Mullenix, C. A. Andersen, and
B. W. Starnes,
“Atherosclerosis as inflammation,”
Ann. Vasc. Surg., 19
(1), 130
–138
(2005). https://doi.org/10.1007/s10016-004-0153-z Google Scholar
D. J. Rader and
E. Pure,
“Lipoproteins, macrophage function, and atherosclerosis: beyond the foam cell?,”
Cell Metab, 1
(4), 223
–230
(2005). https://doi.org/10.1016/j.cmet.2005.03.005 Google Scholar
W. G. Jerome and
P. G. Yancey,
“The role of microscopy in understanding atherosclerotic lysosomal lipid metabolism,”
Microsc. Microanal., 9
(1), 54
–67
(2003). https://doi.org/10.1017/S1431927603030010 Google Scholar
M. J. Mitchinson, R. Y. Ball, K. L. Carpenter, and
J. H. Enright,
“Macrophages and ceroid in human atherosclerosis,”
Eur. Heart J., 11 116
–121
(1990). Google Scholar
U. P. Steinbrecher, H. F. Zhang, and
M. Lougheed,
“Role of oxidatively modified LDL in atherosclerosis,”
Free Radic. Biol. Med., 9
(2), 155
–168
(1990). https://doi.org/10.1016/0891-5849(90)90119-4 Google Scholar
J. L. Witztum and
D. Steinberg,
“Role of oxidized low density lipoprotein in atherogenesis,”
J. Clin., 88
(6), 1785
–1792
(1991). Google Scholar
R. Y. Ball, J. P. Bindman, K. L. Carpenter, and
M. J. Mitchinson,
“Oxidized low density lipoprotein induces ceroid accumulation by murine peritoneal macrophages in vitro,”
Atheroscler., 60
(2), 173
–181
(1986). https://doi.org/10.1016/0021-9150(86)90009-2 Google Scholar
P. Gupta, A. A. Soyombo, A. Atashband, K. E. Wisniewski, J. M. Shelton, J. A. Richardson, R. E. Hammer, and
S. L. Hofmann,
“Disruption of PPT1 or PPT2 causes neuronal ceroid lipofuscinosis in knockout mice,”
Proc. Natl. Acad. Sci. U.S.A., 98
(24), 13566
–13571
(2001). https://doi.org/10.1073/pnas.251485198 Google Scholar
A. M. Pappenheimer and
J. Victor,
“Ceroid pigment in human tissues,”
Am. J. Pathol., 22
(2), 395
–413
(1946). Google Scholar
R. C. Burt,
“The incidence of acid-fast pigment (ceroid) in aortic atherosclerosis,”
Am. J. Clin. Pathol., 22
(2), 135
–139
(1952). Google Scholar
W. S. Hartroft,
“Pathogenesis and significance of hemoceroid and hyaloceroid, two types of ceroidlike pigment found in human atheromatous lesions,”
J. Gerontol., 8
(2), 158
–166
(1953). Google Scholar
M. J. Mitchinson,
“Insoluble lipids in human atherosclerotic plaques,”
Atheroscler., 45
(1), 11
–15
(1982). https://doi.org/10.1016/0021-9150(82)90167-8 Google Scholar
W. S. Hartroft and
E. A. Porta,
“Ceroid,”
Am. J. Med. Sci., 250
(3), 324
–345
(1965). https://doi.org/10.1097/00000441-196509000-00011 Google Scholar
M. Wolman,
“Lipid pigments (chromolipids): their origin, nature, and significance,”
Pathobiol. Ann., 10 253
–267
(1980). Google Scholar
A. Pearse, Histochemistry, Theoretical and Applied, Churchill Livingstone Inc, New York
(1985). Google Scholar
M. J. Mitchinson, D. C. Hothersall, P. N. Brooks, and
C. Y. De Burbure,
“The distribution of ceroid in human atherosclerosis,”
J. Pathol., 145
(2), 177
–183
(1985). https://doi.org/10.1002/path.1711450205 Google Scholar
M. Fitzmaurice, J. O. Bordagaray, G. L. Engelmann, R. Richards-Kortum, T. Kolubayev, M. S. Feld, N. B. Ratliff, and
J. R. Kramer,
“Argon ion laser-excited autofluorescence in normal and atherosclerotic aorta and coronary arteries: morphologic studies,”
Am. Heart J., 118
(5 Pt 1), 1028
–1038
(1989). https://doi.org/10.1016/0002-8703(89)90239-1 Google Scholar
C. Raman and
K. Krishnan,
“A new type of secondary radiation,”
Nature, 121 501
–502
(1928). https://doi.org/10.1038/121501c0 Google Scholar
A. Mahadevan and
R. R. Richards-Kortum,
“Raman spectroscopy for the detection of cancers and precancers,”
J. Biomed. Opt., 1 31
–70
(1996). https://doi.org/10.1117/12.227815 Google Scholar
T. J. Romer, J. F. Brennan 3rd, M. Fitzmaurice, M. L. Feldstein, G. Deinum, J. L. Myles, J. R. Kramer, R. S. Lees, and
M. S. Feld,
“Histopathology of human coronary atherosclerosis by quantifying its chemical composition with Raman spectroscopy,”
Circulation, 97
(9), 878
–885
(1998). Google Scholar
G. J. Puppels, F. F. de Mul, C. Otto, J. Greve, M. Robert-Nicoud, D. J. Arndt-Jovin, and
T. M. Jovin,
“Studying single living cells and chromosomes by confocal Raman microspectroscopy,”
Nature, 347
(6290), 301
–303
(1990). https://doi.org/10.1038/347301a0 Google Scholar
J. W. Chan, D. Motton, J. C. Rutledge, N. L. Keim, and
T. Huser,
“Raman spectroscopic analysis of biochemical changes in individual triglyceride-rich lipoproteins in the pre- and postprandial state,”
Anal. Chem., 77
(18), 5870
–5876
(2005). https://doi.org/10.1021/ac050692f Google Scholar
D. Yin,
“Biochemical basis of lipofuscin, ceroid, and age pigment-like fluorophores,”
Free Radic. Biol. Med., 21
(6), 871
–888
(1996). https://doi.org/10.1016/0891-5849(96)00175-X Google Scholar
C. J. Dillard and
A. L. Tappel,
“Fluorescent products of lipid peroxidation of mitochondria and microsomes,”
Lipids, 6
(10), 715
–721
(1971). https://doi.org/10.1007/BF02531296 Google Scholar
M. L. Brennan and
S. L. Hazen,
“Emerging role of myeloperoxidase and oxidant stress markers in cardiovascular risk assessment,”
Curr. Opin. Lipidol., 14
(4), 353
–359
(2003). https://doi.org/10.1097/00041433-200308000-00003 Google Scholar
Z. Liu and
L. M. Sayre,
“Model studies on the modification of proteins by lipoxidation-derived 2-hydroxyaldehydes,”
Chem. Res. Toxicol., 16
(2), 232
–241
(2003). https://doi.org/10.1021/tx020095d Google Scholar
L. Maillard,
“Action des acides amines sure les sucres: formation des melanoidines par voie methodique,”
Seances Acad. Sci., 154 66
–68
(1912). Google Scholar
H. P. Buschman, G. Deinum, J. T. Motz, M. Fitzmaurice, J. R. Kramer, A. Van Der Laarse, A. V. Bruschke, and
M. S. Feld,
“Raman microspectroscopy of human coronary atherosclerosis: biochemical assessment of cellular and extracellular morphologic structures in situ,”
Cardiovasc. Pathol., 10
(2), 69
–82
(2001). https://doi.org/10.1016/S1054-8807(01)00064-3 Google Scholar
J. D. McPherson, B. H. Shilton, and
D. J. Walton,
“Role of fructose in glycation and cross-linking of proteins,”
Biochem., 27
(6), 1901
–1907
(1988). https://doi.org/10.1021/bi00406a016 Google Scholar
K. E. Shafer-Peltier, A. S. Haka, J. T. Motz, M. Fitzmaurice, R. R. Dasari, and
M. S. Feld,
“Model-based biological Raman spectral imaging,”
J. Cell Biochem. Suppl., 39 125
–137
(2002). https://doi.org/10.1002/jcb.10418 Google Scholar
S. W. E. van de Poll, T. C. Bakker Schut, A. Van Der Laarse, and
G. J. Puppels,
“In situ investigation of the chemical composition of ceroid in human atherosclerosis by Raman spectroscopy,”
J. Raman Spectrosc., 33 544
–551
(2002). https://doi.org/10.1002/jrs.865 Google Scholar
O. R. Scepanovic, K. L. Bechtel, A. S. Haka, W. C. Shih, T. W. Koo, A. J. Berger, and
M. S. Feld,
“Determination of uncertainty in parameters extracted from single spectroscopic measurements,”
J. Biomed. Opt., 12
(6), 064012
(2007). https://doi.org/10.1117/1.2815692 Google Scholar
B. Muik, B. Lendl, A. Molina-Diaz, and
M. J. Ayora-Canada,
“Direct monitoring of lipid oxidation in edible oils by Fourier transform Raman spectroscopy,”
Chem. Phys. Lipids, 134
(2), 173
–182
(2005). https://doi.org/10.1016/j.chemphyslip.2005.01.003 Google Scholar
T. Bocan, T. A. Schifani, and
J. R. Guyton,
“Ultrastructure of the human aortic fibrolipid lesion: formation of the atherosclertic lipid-rich core,”
Am. J. Pathol., 123 413
–424
(1986). Google Scholar
F. Y. Lee, T. S. Lee, C. C. Pan, A. L. Huang, and
L. Y. Chau,
“Colocalization of iron and ceroid in human atherosclerotic lesions,”
Atheroscler., 138
(2), 281
–288
(1998). https://doi.org/10.1016/S0021-9150(98)00033-1 Google Scholar
R. Amado, R. Aeschbach, and
H. Neukom,
“Dityrosine: in vitro production and characterization,”
Methods Enzymol., 107 377
–388
(1984). https://doi.org/10.1016/0076-6879(84)07026-9 Google Scholar
K. Yamamoto and
E. Niki,
“Interaction of alpha-tocopherol with iron: antioxidant and prooxidant effects of alpha-tocopherol in the oxidation of lipids in aqueous dispersions in the presence of iron,”
Biochim. Biophys. Acta, 958
(1), 19
–23
(1988). Google Scholar
L. I. Szweda,
“Age-related increase in liver retinyl palmitate. Relationship to lipofuscin,”
J. Biol. Chem., 269
(12), 8712
–8715
(1994). Google Scholar
V. N. Karnaukhov and
T. B. Tatariunas,
“Accumulation of carotenoids with age in tissues of warm-blooded animals,”
Dokl. Akad Nauk SSSR, 203
(5), 1197
(1972). Google Scholar
D. Z. Yin and
U. T. Brunk,
“Oxidized ascorbic acid and reaction products between ascorbic and amino acids might constitute part of age pigments,”
Mech. Age. Dev., 61
(1), 99
–112
(1991). https://doi.org/10.1016/0047-6374(91)90009-O Google Scholar
A. C. Terentis, S. R. Thomas, J. A. Burr, D. C. Liebler, and
R. Stocker,
“Vitamin E oxidation in human atherosclerotic lesions,”
Circ. Res., 90
(3), 333
–339
(2002). https://doi.org/10.1161/hh0302.104454 Google Scholar
A. de Grey,
“Medical bioremediation: prospects for the application of microbial catabolic diversity to aging and several major age-related diseases,”
Age. Res. Rev., 4 315
–338
(2005). https://doi.org/10.1016/j.arr.2005.03.008 Google Scholar
|


