

|
|
1.IntroductionDiffuse reflectance spectroscopy (DRS) and laser-induced fluorescence spectroscopy (LIFS) have shown great promise for the minimally invasive diagnosis of precancer and cancer. 1, 2, 3, 4, 5 In human tissue, LIFS is used to determine the tissue's endogenous fluorophore content, such as the relative amounts of nicotinamide adenine dinucleotide (NADH), collagen, and flavin adenine dinucleotide (FAD). NADH and FAD are byproducts of metabolic activities, and significant changes in NADH and FAD fluorescence could serve as a noninvasive indicator of tumor growth in vivo. 6, 7 DRS in human tissue is commonly analyzed using a physically-based 8, 9, 10, 11, 12, 13 or empirically-based models. 9, 14 A model-based analysis of DRS provides quantitative measures in terms of wavelength-dependent reduced scattering ( [TeX:] ${\rm \mu^\prime}_{\kern-3pts}$ ) and absorption coefficient (μa), representative of the physiological structure and activity of the sampled site. The reduced scattering coefficient in tissue is a wavelength-dependent inverse power law function, representative of the scatterer size distribution and density.15 The absorption coefficient in tissue is a function of the wavelength-dependent absorbers present in the sampled site, and a physically based model can provide physiological parameters such as the blood volume fraction, oxygen saturation, melanin, and vessel diameter. A fiber optic probe placed in contact with the tissue surface is commonly used for spectral acquisition for DRS and LIFS measurements. A common concern for these contact probes is that contact pressure can impact or distort the spectral measurement, especially for the case of skin. For example, by applying pressure using an index finger on an area of the forearm, one notices a blanching of the skin. This indicates blood is being compressed out of the site under pressure. Because both DRS and LIFS are sensitive to local anatomical features and blood content, it is likely that probe pressure effects can impact spectral measurements under certain circumstances (varying pressure magnitude and time of exposure). Various groups have reported probe pressure effects on spectroscopic data in human, mice, and porcine tissue. Drew, Milner, and Rylander reported that pressure induced by vacuum pressure sources on human skin tissue increased optical penetration depth, due to changes in skin's refractive index, thickness, and water content.16 Their results demonstrated that pressure affects skin morphology, suggesting the possibility that pressure will distort measured optical properties. Probe pressure effects on cervical fluorescence spectroscopy measurements have been reported to be insignificant. 17, 18 Contact force on breast tissue optical properties measurements were reported to vary less than 5%.19 However, these results could not be translated directly to human skin due to differences in tissue type, probe geometry, and applied pressure. Shangguan reported that transmittance increased up to 30%, reflectance decreased by 12%, and both absorption and scattering increased by almost twice the original values on in-vitro porcine aorta tissue under pressure of 1.5 kg/cm2.20 Experiments conducted on in-vitro mice thigh tissue showed an increase in [TeX:] ${\rm \mu^\prime }_{\kern-3pts}$ (700 nm) and a decrease in oxygen saturation, blood vessel radius, and Mie slope with increasing pressure.10 Our simple observation and significant probe pressure effects reported by previously mentioned groups suggest that probe pressure may affect in-vivo human skin tissue spectroscopic measurements under certain circumstances. The goal of this study was to investigate probe pressure effects on combined measurements of human skin fluorescence and reflectance spectra. Specifically, we determined the level and time course of probe pressure effects on in-vivo human skin for various anatomical locations. We related these results to current ongoing investigations of these techniques for the noninvasive detection of skin cancer. As human skin morphology varies based on anatomical sites, we acquired measurements on the neck, finger, and forehead. The forehead and neck are common cancerous sites, and thus clinically relevant. Finger has a thicker stratum corneum layer, allowing study on slightly different tissue morphology. These measurements indicate probe pressure effects across anatomical sites with site-specific tissue morphology. We observed that long-term pressure effects on skin spectroscopy measurements are indeed site specific due to different skin tissue morphology and anatomical sites. Short-term probe pressure effects at low pressures are within 10% (standard deviation) on all physiological properties extracted from diffuse reflectance and fluorescence measurements. Short-term probe pressure effects on diagnostic physiological properties are within 5% (standard deviation). Long-term probe pressure effects even at the lowest pressure resulted in significant spectral distortions due to probe-pressure-induced physiological changes on the sampled site. 2.Methods2.1.Experimental SetupWe used a custom-built clinical spectrometer to collect white light reflectance and laser-induced fluorescence from skin sites on human volunteers. This system has been described in detail elsewhere.21 Briefly, the spectrometer system consisted of the following primary components [Fig. 1a]: 1. a tungsten halogen light source (Ocean Optics LS-1; Dunedin, Florida) for DRS, 2. a nitrogen gas laser (Newport VSL-337; Irvine, California) for LIFS, 3. fiber optic switch (Ocean Optics FOS-2×2-TTL; Dunedin, Florida), 4. a spectrograph (Princeton Instruments Acton SP2150i; Trenton, New Jersey), 5. a camera (Princeton Instruments Coolsnap HQ; Trenton, New Jersey), and 6. a 6-around-1 fiber optic probe (Fibertech Optica, NA = 0.22, 200-μm core diameter, 350-μm source-detector separation, 6.35-mm outer diameter; Kitchener Ontario, Canada) with the central fiber illuminating the skin and six surrounding fibers collecting the remitted light, shown in Fig. 1b. The system sequentially collected one reflectance and fluorescence spectrum every half second. Fig. 1(a) System schematic, (b) distal end of optical fiber probe, and (c) diagram of probe housed in a calibrated spring loaded case. The user held the probe by the spring-loaded case. The probe translated alongside the case, with the set crew moving accordingly. The spring was fully extended when the probe was completely extended and vice versa. The location of the set screw indicated the corresponding pressure applied on the skin.  To induce various pressures, we attached a calibrated spring-loaded case to the distal end of the fiber optic probe, shown in Fig. 1c. A pressure scale was marked on the case corresponding to the various pressures applied (P0 being only the weight of the probe, to P5 being the highest pressure applied). We characterized the accuracy of this pressure scale for each position using a separate scale (Adam AQT-600, Adam Equipment, Danbury, Connecticut). Table 1 summarizes the results for pressures ranging from P0 to P5 (9, 22, 42, 77, 124, and 152 [mN/mm2], respectively. Error remained consistent for all pressures, ranging from 10 to 15 g. Pressure P5 of 152 [mN/mm2] is equal to approximately 22 [psi]. Typical pressures used in clinical measurements are mimicked by the P0 pressure. P0 is pressure resulting from only the weight of the probe supported by a flexible fixture, resulting in low pressure with high variance. For simplicity sake, we are reporting only the highest possible weight and pressure for P0. Table 1Pressure range.
2.2.Acquisition Procedure and Volunteer ProfileThree replicates of one-minute measurements were taken on each volunteer's forehead, neck, and finger at each pressure separately. We took three replicate measurements to ensure that pressure effects are consistent. The replicate measurements’ locations did not overlap, but were within close proximity to each other. This is to prevent pressure effects from previous measurements to affect subsequent measurements. There is a half-minute break in-between measurements. We only measured P0 to P3 on the forehead as patients indicated discomfort for P4 and P5. Pressure (P1 to P5) was applied 5 s into the measurement, while P0 was acquired with the probe resting on the site supported by a flexible fixture. Measurements were acquired by the same user to eliminate interuser variability. Five volunteers were involved in the study (University of Texas at Austin, IRB Protocol 2007-04-0099). Volunteers were within the age of 18 to 30, nonsmokers, and with no history of skin cancer. We restricted volunteers to Caucasians (Fitzpatrick skin type 1 to 2) to minimize variability due to skin optical properties across individuals. 2.3.Data AnalysisA lookup table-based inverse model was fit to DRS data 21, 22 to obtain the following physiological parameters: [TeX:] ${\rm \mu^\prime }_{\kern-3pts}$ (630 nm), Mie theory slope, melanin, blood volume fraction (cHb), oxygen saturation (α), and hemoglobin packaging factor (HbF). Briefly, reduced scattering coefficient and Mie theory slope provide insight into the sampled site's density and scatterer size, described by the following equation: Eq. 1[TeX:] \documentclass[12pt]{minimal}\begin{document}\begin{equation} \mu '_{\rm s} (\lambda) = \mu '_{\rm s} (\lambda _0)\, \times \left(\frac{\lambda }{{\lambda _0 }}\right)^{ - B} \quad [{\rm mm}^{ - 1} ], \end{equation}\end{document}Eq. 2[TeX:] \documentclass[12pt]{minimal}\begin{document}\begin{eqnarray} \mu _a^{Hb} (\lambda) &=& cHb\, \times\, 150\, \times\, [\alpha \sigma _{HbO_2 } (\lambda)\nonumber\\ && +\, (1 - \alpha)\sigma _{Hb} (\lambda)]\,\,\, [{\rm mm}^{ - 1} ], \end{eqnarray}\end{document}We applied the model described by Zhang 26 to the LIFS data to extract the intrinsic fluorescence (IF) from the fluorescence spectra distorted by absorption and scattering. NADH and collagen are the main endogenous fluorophores excited in this wavelength region. Using basis spectra of NADH and collagen, a least squares fitting model was fit to the IF data to obtain intrinsic fluorescence contribution by each fluorophore. Figure 2 is a plot of a typical diffuse reflectance spectrum along with the lookup-table inverse model fit and the corresponding LIFS spectrum with IF processing and model fit. These spectra were acquired from the finger. Data acquisition for one minute provides 120 DRS and 120 corresponding LIFS spectra (two spectra per second for 60 s). Fig. 2(a) DRS and (b) corresponding LIFS spectra with model fits. Raw LIFS data (red line) was processed to eliminate distortions due to scattering and absorption, resulting in the IF data (blue line). Least squares models of NADH and collagen basis spectra were fit to the IF (black dashed line). (Color online only.)  DRS and LIFS data were processed, and the described models were fit to the acquired spectra to obtain physiological properties for the time course of one minute. We report the normalized physiological properties over time (Δ) for comparison between sites and pressures using the following formula: where pp(t) refers to the physiological properties at time t, and pp(0) refers to the physiological properties at time t = 0 s. Changes in physiological properties are reported in relation to the percentage change from the optical properties at t = 0 s.3.Results and Discussion3.1.Probe Pressure Effects Observed on Diffuse Reflectance SpectroscopySeveral probe pressure effects were readily observed on the acquired DRS spectra. Figure 3 illustrates typical reflectance spectra acquired at t = 0, 7 (approximately 2 s after pressure was applied), 25, and 60 s collected on the neck [Fig. 3a] and forehead [Fig. 3b]. We noticed consistent and site-specific probe pressure effects. Fig. 3(a) and (b): typical reflectance at t = 0, 7, 2,5 and 60 s. Pressure (P4 on the neck, P2 on the forehead) was applied at approximately t = 5 s. Notice the progression of the DRS spectrum with time. Hemoglobin absorption decreased gradually after probe pressure application.  Absorption due to hemoglobin in the 550-nm region decreased with time, indicating decreased hemoglobin. Figure 3 demonstrates the decreasing progression of hemoglobin absorption in the Q-band (550-nm region) for one minute, with pressure applied at t = 5s. At t = 0 and 7 s (black and red lines, respectively), hemoglobin absorption in the Q-band is more prominent, resulting in a deeper “valley” in the reflectance spectrum compared to DRS spectra at t = 25 and 60 s (green and blue lines, respectively). Oxygen saturation (α) decreased, indicating a change from oxyhemoglobin to deoxyhemoglobin. The dual absorption peaks characteristic of oxyhemoglobin (black and red lines of Fig. 3) transitioned to a single absorption peak characteristic of deoxyhemoglobin (green and blue lines of Fig. 3). This decrease in α was consistent on all sites, shown in Fig. 4. Fig. 4Plot of physiological properties versus time s. Pressure was applied at approximately t = 5 s (black dashed line). Plots between physiological properties (rows) are not on the same scale. Plots of the same physiological properties (columns) between different sites are on the same scale. 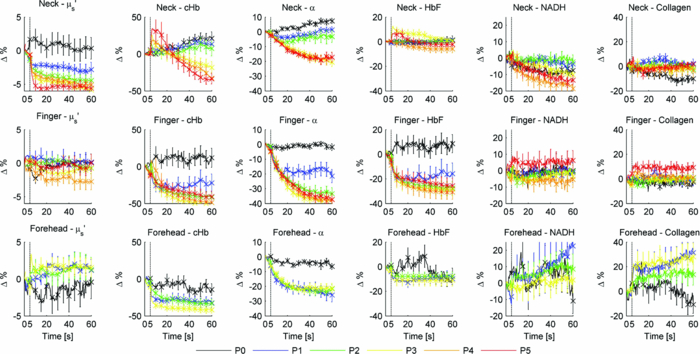 Overall reflectance on the neck decreased during pressure application, indicating a decrease in scattering. In addition, a slight increase in absorption is seen by stronger Q-band absorption features around 540 nm, as shown by the black and red plots (t = 0 and 7 s, respectively) in Fig. 3a. On the other hand, no initial decrease of reflectance was observed on the forehead, as blood is compressed out of the sampling site immediately during pressure application. We hypothesized this site-specific effect is due to differences in tissue morphology, discussed in the next section. 3.2.Probe Pressure Effects on Physiological Properties over TimeFigure 4 summarizes probe pressure effects on each of the physiological parameters (columns) on three different anatomical sites (rows) over time. Each line tracked changes in physiological properties (y axis) over the time course of one minute (x axis) with the various pressures represented by different colors as shown in the legend at the bottom of the figure. Each row corresponds to data acquired at each site (neck, finger, and forehead, respectively from top to bottom). The following sections discuss Fig. 4 in greater detail. 3.2.1.Probe pressure effects on absorptionAbsorption due to hemoglobin decreased with increasing pressure and time, consistent with the changes in reflectance spectrum observed in Fig. 3. The amount of cHb, α, and HbF decreased is proportional with the applied probe pressure, with exceptions on the neck due to differences in anatomical sites. As pressure is applied on the skin, we would expect blood to be compressed out of the sampled site. This reduced hemoglobin absorption explains the decrease in cHb with respect to time on all sites. Notice that the decrease in cHb is proportional with the applied pressure. Higher pressure compressed more blood out of the sampled site, resulting in further decrease of hemoglobin absorption. Oxygen saturation decreased with time on all sites, indicating a change from oxyhemoglobin to deoxyhemoglobin. We hypothesize that probe pressure not only compressed blood out of the sampled site, it also impeded the sampled site from receiving replacement blood, while tissue at the sampled site still undergoes cellular respiration. Blood is gradually compressed out of the sampled site, and coupled with continued oxygen consumption via cellular respiration, these activities resulted in the change of oxygen saturation from oxyhemoglobin to deoxyhemoglobin. Ti and Lin reported probe-pressure-induced spectral changes on diffuse reflectance and fluorescence spectroscopy that may be attributed to decreases in local blood volume, blood oxygenation, and tissue metabolism.27 In-vivo experiments conducted on rat heart and liver tissue showed prominent change from a double-valley feature to a single valley between 500- to 600-nm diffuse reflectance spectra, consistent with our findings. Reif stated that oxygen saturation and blood vessel radius were reported to decrease with increasing pressure on mice thigh muscle,10 consistent with our results. HbF is a correction factor for spectral flattening due to the nonuniform distribution of hemoglobin in the microvasculature of various sizes. 23, 24 HbF is correlated to the blood vessel or packaging size. The drop in HbF indicates a decrease of the averaged vessel size on the sampled site. This is intuitive, as we would expect blood vessels to collapse under probe pressure. We observed multiple site-specific differences of probe pressure effects, consistent with observations of the reflectance spectrum shown in Fig. 3. For P3, P4, and P5, there is an initial increase in cHb and HbF on the neck after probe pressure application, while cHb and HbF on the finger and forehead decreased immediately after probe pressure application. cHb and α on the neck decreased only at pressures higher than P3. On the other hand, measurements on the finger and forehead demonstrated that cHb and α decreased even at lower pressures (P1). HbF on the neck did not decrease as much compared to measurements made on the finger and forehead. We hypothesize that these differences are due to differences in the tissue morphology. Skin tissue on the neck lies on top of bulkier, more muscular tissues than the finger and forehead. On the other hand, there is not as much tissue and muscle between the skin and skull on the forehead. When pressure is applied on the forehead, skin tissue above a less massive epicranius muscle is pushed directly against the skull, clearing blood immediately. When pressure is applied on the neck, skin tissue on top of a more elastic and massive muscle tissue does not compress as much or as fast. This explains why a higher probe pressure on the neck (P3) is required to have the same probe pressure effect on the forehead and finger. Since the neck has massive muscle and is more elastic, the compressed tissue resulted in a temporary increase of sampled blood, which eventually cleared. This explains the initial increase in cHb and HbF on the neck. Similar to cHb at P3, P4, and P5, there is an initial increase of HbF on the neck. It is very unlikely for compressed vessels to actually increase in size. However, it is possible that pressure compressed the sampled tissue and caused the light to sample deeper into the tissue, where blood vessels are larger. Thus, the initial increase of HbF might be due to compression of dermis and sampling deeper and larger blood vessels present in the more muscular neck. 3.2.2.Probe pressure effects on reduced scattering coefficientThe reduced scattering coefficient changed within a much smaller range compared to absorption. On the forehead, [TeX:] ${\rm \mu^\prime }_{\kern-3pts}$ (630 nm) increased with increasing pressure, while it decreased with increasing pressure on the neck. There is no increasing or decreasing trend on the finger, but it changed within a smaller margin (–4 to 2%) compared to the forehead (–4 to 4%) and neck (–6 to 3%). We hypothesize that the decrease in [TeX:] ${\rm \mu^\prime }_{\kern-3pts}$ (630 nm) on the neck with increasing pressure is due to the displacement of water in the epidermis and dermis. Water's index of refraction (n = 1.33) is lower in comparison to the majority of the solid phase of skin (n = 1.43 to 1.53).16 Water content in human skin is variable, around 15% in the stratum corneum layer and up to 70% in the epidermis-dermis junction.16 Drew, Milner, and Rylander reported increased light penetration depth of in-vivo human skin tissue for areas subjected to pressure16 Ex-vivo experiments determined that the tissue's group refractive index increased (from 1.38 to 1.46), and water volume fraction decreased (from 70 to 30%) after pressure application. The increase in group refractive index has been suggested to decrease the index of refraction mismatch, thus decreasing light scattering and [TeX:] ${\rm \mu^\prime }_{\kern-3pts}$ (630 nm). 16, 28 On the forehead, similar compression of the stratum corneum and water displacement occurred. But unlike the neck, the presence of the skull prevents the dermis from collapsing into the hypodermis, causing the sampling depth to reach deeper into the dermis. The total scattering increased because light sampled deeper into the dense connective tissue layer of the dermis, which is rich in high scattering collagen. The corresponding increase in collagen fluorescence signal on the forehead supports this interpretation. Reif reported that the reduced scattering coefficient increased with increasing pressure on mice thigh muscle,10 while our results showed that the pressure effect on [TeX:] ${\rm \mu^\prime }_{\kern-3pts}$ (630 nm) is site specific. Compared to skin tissue, muscle tissue is more uniform and vascularized. Differences mainly due to the different tissue under investigation are expected. 3.2.3.Pressure effects on fluorescenceProbe pressure effects on NADH fluorescence were significant without an increasing or decreasing trend. NADH is a coenzyme present in the cell. It is actively involved in several key physiological activities in the cell, mainly cellular respiration. NADH is the byproduct of the citric acid cycle, and is converted back to NAD+ by oxidative phosphorylation. We would expect changes with oxygen saturation (α) to affect NADH, but our results did not support this. Long-term pressure effects on NADH fluorescence appeared to be site specific (decreased with increasing pressure on the neck, increased with increasing pressure on the forehead). However, high variance in the data (especially forehead) undermines this trend. Like NADH, pressure effects on collagen fluorescence were significant without an increasing or decreasing trend. Our results from the forehead indicated collagen fluorescence increased with pressure and time, but with high standard errors. Collagen is the most abundant protein in the human body. Human skin is rich in collagen and it is more abundant in deeper skin layers. Collagen fluoresces and highly scatters light. We expected collagen fluorescence and [TeX:] ${\rm \mu^\prime }_{\kern-3pts}$ to increase as we sampled deeper into the dermis, where collagen is more abundant. Although collagen fluorescence data have high standard errors, DRS and LIFS data from the forehead support this interpretation. 3.3.Illustration of Skin under Probe PressureFigure 5 provides a simplified cross sectional view of skin under probe pressure with the optical path of sampling light. Normal epidermal thickness ranges from 70 to 90 μm, 29, 30 and normal dermal thickness ranges from 1 mm (eyelids) to 5 mm (back), varying according to the region's functional requirement.31 Fig. 5Cartoon illustration of skin under probe pressure. (a) Cross section of the human skin without probe pressure exposure. (b) and (c): skin cross sections on the neck and forehead, respectively, under probe pressure. Notice light samples of the collagen-rich reticular dermis layer on the forehead.  On the neck, probe pressure compressed blood out of the sampling site, displaced water, and reduced the thickness of epidermis. As water is displaced, group refractive index increased, reducing refractive index mismatch. As a result, hemoglobin absorption and scattering decreased. Similar events took place on the forehead, with one exception. Unlike the neck, the skull on the forehead prevented the dermis from collapsing along with probe pressure into the hypodermis. This caused light to sample the dense connective tissue layer of dermis that is rich in collagen, as shown in Fig. 5c. Blood and water evacuated the pressure site due to compression, and light sampled more collagen from dense connective tissue layers of the dermis. Scattering due to sampling of collagen dominates the decrease of refractive index mismatch, resulting in overall increase of [TeX:] ${\rm \mu^\prime }_{\kern-3pts}$ . This resulted in a decrease of hemoglobin absorption and increase of scattering and fluorescence due to collagen. We are currently conducting experiments and simulations to determine the sampling depth of our probe. Preliminary results conducted on phantoms with optical properties similar to human skin have shown mean sampling depths of approximately 300 μm. It is unlikely for muscle to be sampled on the finger and neck, which predominantly consist of ligaments and fat. Whether sampling depths reach muscle on the forehead will depend on how human skin collapses under probe pressure, which might be different for each individual. While it is possible that muscle on the forehead is sampled, it is very unlikely for the skull to be sampled due to the relatively shallow sampling depth. 3.4.Pressure Effects on Clinical Measurements and Implications on Skin Cancer DiagnosticsThe described combined DRS and LIFS system is currently being tested as a noninvasive diagnostic of skin cancer.32 In this section we explore how probe pressure effects can implicate our clinical measurements and influence skin cancer diagnostics. In other words, we would like to know if probe pressure effects can negatively influence the outcome of skin cancer diagnostics. As discussed in the previous section, our results demonstrate that long-term probe pressure effects can have significant distortions on physiological properties, even at the lowest pressure of P0, as illustrated by the black lines in Fig. 4 (cHb and α increased by 20 and 10% on the neck, and both decreased by 15 and 5% on the forehead). However, short-term light probe pressure (P0) effects are minimal. We focus on the initial portion of light probe pressure (P0) measurements, as it coincides with our clinical measurement acquisition procedure. All of our clinical measurements consisted of an average of three replicates acquired within two seconds after the probe is in contact with the suspected lesion. The probe (contact area diameter = 6.35 mm) is handheld by an operator to be in full contact but not fully resting on the lesion. The resulting clinical acquisition pressure is effectively less than the weight of the probe resting on the lesion (Pclinic ≤ P0), verified using the same weigh balance (Adam AQT-600, Adam Equipment, Danbury, Connecticut). Thus, pressure effects on our clinical measurements rest comfortably within the first two seconds of the pressure P0 measurements. Figure 6 summarizes the percentage mean and standard deviation of physiological properties during the first two seconds under probe pressure P0. Measurements taken during the first two seconds after probe contact pressure (P0) ranged within ±10% for all extracted physiological properties. Pressure effects for diagnostically significant physiological properties are smaller (0 ± 2% for [TeX:] ${\rm \mu^\prime }_{\kern-3pts}$ , 0 ± 5% for HbF). Fig. 6Plots (mean and standard deviation) of physiological property changes for the first 2 s of acquisition.  We developed a logistic regression-based classification algorithm using two physiological properties ( [TeX:] ${\rm \mu^\prime }_{\kern-3pts}$ and HbF) to classify nonmelanoma cancers such as basal cell carcinoma (BCC), actinic keratosis (AK), and squamous cell carcinoma (SCC).32 The physiological properties were chosen by one-way analysis of variance (ANOVA), and ranked so that they showed the highest statistically significant difference between cancerous groups. The reduced scattering coefficient ranked the highest, followed by hemoglobin correction factor. The difference between physiological properties of normal and cancerous groups is large (>25%), such that probe pressure effects on diagnostic features (0 ± 2% for [TeX:] ${\rm \mu^\prime }_{\kern-3pts}$ , 0 ± 5% for HbF) should not negatively influence diagnostic outcome. We think short-term (t < 2 s) light probe pressure (P0) effects should be tolerable for this particular application. However, light probe pressure (P0) will eventually have significant site-specific effects (black lines of Fig. 4). Our results demonstrate that pressures greater than 9 [mN/mm2] (approximately 1.3 psi) for longer than 5 s induced significant distortions in collected spectra, and resulted in significant changes on physiological properties as shown in Fig. 4. This emphasized the importance to acquire measurements immediately on probe contact. We noticed that measurements acquired on the finger and forehead are more prone to motion artifacts. Activities such as blinking, talking, and pulsation can contribute to significant spectral changes. On the other hand, areas with thicker muscle and tissue mass have a larger “buffer” zone, damping noise by motion artifacts. This can be seen in Fig. 6, where standard deviations for measurements on forehead and finger are generally larger compared to the neck. Care must be taken to mitigate motion artifacts while collecting spectra at low pressures. We can request the patient to refrain from speaking and keep their eyes closed during acquisition on the forehead, and avoid sites sensitive to pulsation as best as possible. 3.5.Alternatives to Alleviate Probe Pressure EffectsGiven that the effects of probe pressure can be significant under certain conditions, several alternatives exist to alleviate the effects of pressure. One technique to alleviate probe pressure effects is to reduce pressure by increasing the probe's contact area. Cerussi reported less than 5 and 2% changes in absorption and scattering, respectively, for probe pressure on in-vivo human breast tissue for forces up to 2 N.19 Our results showed much bigger probe pressure effects on absorption for similar amounts of force (P3 = 2.45 N). However, there are significant differences in our probe geometry and sampling depths. Their probe contact area is approximately 3000 mm2 with a source detector separation of 28.5 mm, both substantially larger than our probe's geometry. The much deeper sampling depth contributed to the small probe pressure effects on optical properties. Increasing our sampling depth to a similar distance is not an option, as we would like to sample the human skin that is relatively superficial. However, a larger contact area will distribute the force over a larger area and reduce probe pressure, and as a result might “dampen” probe pressure effects. Another technique that will alleviate probe pressure effects are noncontact probes or imaging systems. 11, 33, 34 Zhu proposed a statistical technique called error removal by orthogonal subtraction (EROS) that reduced variability in spectra from replicates measurements of the same sample.35 Some of the sources of spectra variability are small changes in angle and probe pressure. EROS was reported to reduce complexity and increase accuracy of qualitative classification on colon lesions35 and Barrett's esophagus.36 Our results showed that short-term light probe pressure has negligible effects under clinical measurements conditions, thus we do not think it necessary to add an additional step in our postprocessing procedure. Furthermore, our current diagnostic model only used two parameters, thus reducing model complexity is not necessary. Improvement in diagnostic accuracy makes EROS worth exploring in the future. 4.ConclusionsWe demonstrate that probe pressure affects skin optical and physiological properties measured with DRS and IFS, and these effects depend on the exposure time, pressure magnitude, and anatomical site. We identify short-term (<2 s) and long-term (>30 s) pressure effects, where distortions for the light probe pressures tested (P0 < 0.009 N/mm2) have only a minimal short-term effect (all physiological properties from DRS and LIFS spectroscopic data ranges within 0 ± 10% (mean and standard deviation); however, larger pressures induce significant spectral distortions for both short- and long-term exposures. Light and short-term probe pressure effects are less on diagnostically significant physiological properties (0 ± 2% for [TeX:] ${\rm \mu^\prime }_{\kern-3pts}$ , 0 ± 5% for HbF), and should not negatively influence diagnostic performance. For higher probe pressures (i.e., P ≥ 22 mN/mm2), significant distortions in extracted physiological properties can occur. The reduced scattering coefficient has site-specific variations (6±1% on the neck, 3 ± 2% on the forehead). The absorption coefficient as a function of absorption by cHb, α, and HbF decreases with increasing pressure on all sites, with site-specific variations due to different tissue morphology. Intrinsic fluorescence has large standard errors with no specific trend with pressure changes. Results from the forehead suggest that fluorescence and scattering due to collagen increase with pressure. While pressure effects can be avoided with our current probe design with careful attention to pressure magnitude and exposure duration, future designs might benefit from measures to mitigate the pressure applied to skin for probes with small sampling volumes. AcknowledgmentsFunding for this project was provided in part by an Early Career Translational Research Award from the Wallace H. Coulter Foundation, and a grant from the National Institutes of Health (R01 CA132032). ReferencesN. Shah, A. Cerussi, C. Eker, J. Espinoza, J. Butler, J. Fishkin, R. Hornung, and
B. Tromberg,
“Noninvasive functional optical spectroscopy of human breast tissue,”
Proc. Nat. Acad. Sci. USA, 98 4420
–4425
(Apr. 2001). https://doi.org/10.1073/pnas.071511098 Google Scholar
T. J. Muldoon, M. C. Pierce, D. L. Nida, M. D. Williams, A. Gillenwater, and
R. Richards-Kortum,
“Subcellular-resolution molecular imaging within living tissue by fiber microendoscopy,”
Opt. Express, 15 16413
–16423
(Dec 2007). https://doi.org/10.1364/OE.15.016413 Google Scholar
S. K. Chang, Y. N. Mirabal, E. N. Atkinson, D. Cox, A. Malpica, M. Follen, and
R. Richards-Kortum,
“Combined reflectance and fluorescence spectroscopy for in vivo detection of cervical pre-cancer,”
J. Biomed. Opt., 10 024031
(Mar–Apr 2005). https://doi.org/10.1117/1.1899686 Google Scholar
M. Rahman, P. Chaturvedi, A. M. Gillenwater, and
R. Richards-Kortum,
“Low-cost, multimodal, portable screening system for early detection of oral cancer,”
J. Biomed. Opt., 13 030502
(2008). https://doi.org/10.1117/1.2907455 Google Scholar
Z. Volynskaya, A. S. Haka, K. L. Bechtel, M. Fitzmaurice, R. Shenk, N. Wang, J. Nazemi, R. R. Dasari, and
M. S. Feld,
“Diagnosing breast cancer using diffuse reflectance spectroscopy and intrinsic fluorescence spectroscopy,”
J. Biomed. Opt., 13 024012
(2008). https://doi.org/10.1117/1.2909672 Google Scholar
J. M. Levitt, A. Baldwin, A. Papadakis, S. Puri, J. Xylas, K. Munger, and
I. Georgakoudi,
“Intrinsic fluorescence and redox changes associated with apoptosis of primary human epithelial cells,”
J. Biomed. Opt., 11 064012
(2006). https://doi.org/10.1117/1.2401149 Google Scholar
M. C. Skala, K. M. Riching, A. Gendron-Fitzpatrick, J. Eickhoff, K. W. Eliceiri, J. G. White, and
N. Ramanujam,
“In vivo multiphoton microscopy of NADH and FAD redox states, fluorescence lifetimes, and cellular morphology in precancerous epithelia,”
Proc. Nat. Acad. Sci. USA, 104 19494
–19499
(2007). https://doi.org/10.1073/pnas.0708425104 Google Scholar
G. Zonios, L. T. Perelman, V. M. Backman, R. Manoharan, M. Fitzmaurice, J. Van Dam, and
M. S. Feld,
“Diffuse reflectance spectroscopy of human adenomatous colon polyps in vivo,”
Appl. Opt., 38 6628
–6637
(1999). https://doi.org/10.1364/AO.38.006628 Google Scholar
C. F. Zhu, G. M. Palmer, T. M. Breslin, J. Harter, and
N. Ramanujam,
“Diagnosis of breast cancer using diffuse reflectance spectroscopy: Comparison of a Monte Carlo versus partial least squares analysis based feature extraction technique,”
Lasers Surg. Med., 38 714
–724
(2006). https://doi.org/10.1002/lsm.20356 Google Scholar
R. Reif, M. S. Amorosino, K. W. Calabro, O. A'Amar, S. K. Singh, and
I. J. Bigioa,
“Analysis of changes in reflectance measurements on biological tissues subjected to different probe pressures,”
J. Biomed. Opt., 13 010502
(2008). https://doi.org/10.1117/1.2870115 Google Scholar
C. C. Yu, C. Lau, G. O’Donoghue, J. Mirkovic, S. McGee, L. Galindo, A. Elackattu, E. Stier, G. Grillone, K. Badizadegan, R. R. Dasari, and
M. S. Feld,
“Quantitative spectroscopic imaging for non-invasive early cancer detection,”
Opt. Express, 16 16227
–16239
(Sep 2008). https://doi.org/10.1364/OE.16.016227 Google Scholar
R. H. Wilson, M. Chandra, J. Scheiman, D. Simeone, B. McKenna, J. Purdy, and
M. A. Mycek,
“Optical spectroscopy detects histological hallmarks of pancreatic cancer,”
Opt. Express, 17 17502
–17516
(2009). https://doi.org/10.1364/OE.17.017502 Google Scholar
A. Garcia-Uribe, K. C. Balareddy, J. Zou, and
L. V. Wang,
“Micromachined fiber optical sensor for in vivo measurement of optical properties of human skin,”
IEEE Sensors J., 8 1698
–1703
(Sep-Oct 2008). https://doi.org/10.1109/JSEN.2008.2003306 Google Scholar
J. R. Mourant, I. J. Bigio, J. Boyer, R. L. Conn, T. Johnson, and
T. Shimada,
“Spectroscopic diagnosis of bladder cancer with elastic light scattering,”
Lasers Surg. Med., 17 350
–357
(1995). https://doi.org/10.1002/lsm.1900170403 Google Scholar
J. R. Mourant, T. Fuselier, J. Boyer, T. M. Johnson, and
I. J. Bigio,
“Predictions and measurements of scattering and absorption over broad wavelength ranges in tissue phantoms,”
Appl. Opt., 36 949
–957
(Feb 1997). https://doi.org/10.1364/AO.36.000949 Google Scholar
C. Drew, T. E. Milner, and
C. G. Rylander,
“Mechanical tissue optical clearing devices: evaluation of enhanced light penetration in skin using optical coherence tomography,”
J. Biomed. Opt., 14 064019
(2009). https://doi.org/10.1117/1.3268441 Google Scholar
A. Nath, K. Rivoire, S. Chang, D. Cox, E. N. Atkinson, M. Follen, and
R. Richards-Kortum,
“Effect of probe pressure on cervical fluorescence spectroscopy measurements,”
J. Biomed. Opt., 9 523
–533
(2004). https://doi.org/10.1117/1.1695562 Google Scholar
K. Rivoire, A. Nath, D. Cox, E. N. Atkinson, R. Richards-Kortum, and
M. Follen,
“The effects of repeated spectroscopic pressure measurements on fluorescence intensity in the cervix,”
Am. J. Obstet. Gynecol., 191 1606
–1617
(2004). https://doi.org/10.1016/j.ajog.2004.05.015 Google Scholar
A. Cerussi, S. Siavoshi, A. Durkin, C. Chen, W. Tanamai, D. Hsiang, and
B. J. Tromberg,
“Effect of contact force on breast tissue optical property measurements using a broadband diffuse optical spectroscopy handheld probe,”
Appl. Opt., 48 4270
–4277
(Jul 2009). https://doi.org/10.1364/AO.48.004270 Google Scholar
H. Q. Shangguan, S. A. Prahl, S. L. Jacques, L. W. Casperson, and
K. W. Gregory,
“Pressure effects on soft tissues monitored by changes in tissue optical properties,”
Laser-Tissue Interact., 9 366
–371
(1998). Google Scholar
N. Rajaram, T. J. Aramil, K. Lee, J. S. Reichenberg, T. H. Nguyen, and
J. W. Tunnell,
“Design and validation of a clinical instrument for spectral diagnosis of cutaneous malignancy,”
Appl. Opt., 49 142
–152
(2010). https://doi.org/10.1364/AO.49.000142 Google Scholar
N. Rajaram, T. H. Nguyen, and
J. W. Tunnell,
“Lookup table-based inverse model for determining optical properties of turbid media,”
J. Biomed. Opt., 13 050501
(2008). https://doi.org/10.1117/1.2981797 Google Scholar
R. L. P. van Veen and
H. Sterenborg,
“Correction for in-homogeneously distributed absorbers in spatially resolved diffuse reflectance spectroscopy,”
Photon Migration, Optical Coherence Tomography, and Microscopy, 192
–194 SPIE Press, Bellingham
(2001). Google Scholar
N. Rajaram, A. Gopal, X. J. Zhang, and
J. W. Tunnell,
“Experimental Validation of the Effects of Microvasculature Pigment Packaging on In Vivo Diffuse Reflectance Spectroscopy,”
Lasers Surg. Med., 42 680
–688
(2010). https://doi.org/10.1002/lsm.20933 Google Scholar
R. Graaff, J. G. Aarnoudse, J. R. Zijp, P. M. A. Sloot, F. F. M. Demul, J. Greve, and
M. H. Koelink,
“Reduced light-scattering properties for mixtures of spherical particles: a simple approximation derived from Mie calculations,”
Appl. Opt., 31 1370
–1376
(1992). https://doi.org/10.1364/AO.31.001370 Google Scholar
Q. G. Zhang, M. G. Muller, J. Wu, and
M. S. Feld,
“Turbidity-free fluorescence spectroscopy of biological tissue,”
Opt. Lett., 25 1451
–1453
(Oct 2000). https://doi.org/10.1364/OL.25.001451 Google Scholar
Y. L. Ti and
W. C. Lin,
“Effects of probe contact pressure on in vivo optical spectroscopy,”
Opt. Express, 16 4250
–4262
(Mar 2008). https://doi.org/10.1364/OE.16.004250 Google Scholar
E. K. Chan, B. Sorg, D. Protsenko, M. Oneil, M. Motamedi, and
A. J. Welch,
“Effects of compression on soft tissue optical properties,”
IEEE J. Sel. Top. Quantum Electron., 2 943
–950
(1996). https://doi.org/10.1109/2944.577320 Google Scholar
T. Gambichler, R. Matip, G. Moussa, P. Altmeyer, and
K. Hoffmann,
“In vivo data of epidermal thickness evaluated by optical coherence tomography: Effects of age, gender, skin type, and anatomic site,”
J. Dermatolog. Sci., 44 145
–152
(Dec 2006). https://doi.org/10.1016/j.jdermsci.2006.09.008 Google Scholar
J. Sandby-Moller, T. Poulsen, and
H. C. Wulf,
“Epidermal thickness at different body sites: Relationship to age, gender, pigmentation, blood content, skin type and smoking habits,”
Acta Dermato-Venereologica, 83 410
–413
(Nov 2003). Google Scholar
Rook's Textbook of Dermatology, Blackwell Publishers, Oxford, UK
(2004). Google Scholar
N. Rajaram, J. S. Reichenberg, M. Migden, T. Nguyen, J. W. Tunnell,
“Pilot clinical study for quantitative spectral diagnosis of non-melanoma skin cancer,”
Lasers Surg Med., Google Scholar
J. W. Qin and
R. F. Lu,
“Hyperspectral diffuse reflectance imaging for rapid, noncontact measurement of the optical properties of turbid materials,”
Appl. Opt., 45 8366
–8373
(Nov 2006). https://doi.org/10.1364/AO.45.008366 Google Scholar
W. J. Cottrell, A. R. Oseroff, and
T. H. Foster,
“Portable instrument that integrates irradiation with fluorescence and reflectance spectroscopies during clinical photodynamic therapy of cutaneous disease,”
Rev. Sci. Instrum., 77 064302
(Jun 2006). https://doi.org/10.1063/1.2204617 Google Scholar
Y. Zhu, T. Fearn, D. Samuel, A. Dhar, O. Hameed, S. G. Bown, and
L. B. Lovat,
“Error removal by orthogonal subtraction (EROS): a customised pre-treatment for spectroscopic data,”
J. Chemomet., 22 130
–134
(Feb 2008). https://doi.org/10.1002/cem.1117 Google Scholar
Y. Zhu, T. Fearn, G. Mackenzie, B. Clark, J. M. Dunn, I. J. Bigio, S. G. Bown, and
L. B. Lovat,
“Elastic scattering spectroscopy for detection of cancer risk in Barrett's esophagus: experimental and clinical validation of error removal by orthogonal subtraction for increasing accuracy,”
J. Biomed. Opt., 14 044022
(Jul-Aug 2009). https://doi.org/10.1117/1.3194291 Google Scholar
|


