
|
|
1.IntroductionThe intraoperative imaging of intravascular blood flow and of cortical cerebral perfusion is essential during vascular neurosurgical procedures to guide the surgical progress.1, 2 The diagnostic identification of the appearance, size, and functional extent of perfusion changes is a yet unachieved goal during neurosurgery. Fluorescence angiography has been applied to study the blood flow under in situ conditions. For example, indocyanine green (ICG) angiography is a commercially available method for intraoperative videoangiography.2, 3 Until now this method provided the only widespread approach for optical imaging of the blood flow during surgical procedures. However, ICG angiography also has various disadvantages: (i) The drug is not suitable for all patients; (ii) its detection requires a special light source with an emission of ∼800 nm and a specialized imaging device; and (iii) there is a lack of quantitative accuracy because many processes (such as quenching, photobleaching, and interaction with blood products) affect the fluorescence. Moreover, ICG angiography—as for any marker-based angiography—can be used only every 30 min and the measuring time is limited to the initial passing of the fluorescent dye, limiting its use to morphological studies. In contrast, simple injection of cold normal saline can be applied frequently. Using an image of tiny temperature gradients, a map of differential perfusion can be obtained. In medical diagnostics, a cold bolus approach is used (e.g., to measure cardiac output). In a typical procedure, a cold bolus of saline at ice temperature is injected through a catheter into a blood vessel. The transpulmonary thermodilution uses the Stewart–Hamilton principle, avoiding further invasive techniques.4, 5 Usually, the method utilizes a dual-thermistor technique, which enables direct recording of the temperature difference between the injected cold bolus and the blood as well as the temperature variations in a large artery caused by the dilution of the injected cold bolus.6 The cold bolus approach requires a sensitive temperature measurement. For the purpose of gaining accuracy, the entire procedure is repeated several times and readings are averaged. Consequently, the procedure requires an elapsed time of a few minutes. Notwithstanding the slowness of the measurement, the cold bolus approach is often referred to as the “gold standard” for cardiac output measurement.5 Thermography provides a tool for noncontact imaging of cortical temperature. Usually, thermography is used in many fields to capture images representing spatial distribution of thermal radiation. Thermographic camera systems have advanced in both sensitivity and spatial resolution. Consequently, thermography is an important adjunctive diagnostic tool in medicine,7 such as in breast cancer detection8, 9, 10 and dermatology.11, 12 Thermography was also applied to image the temperature topography of the brain cortex,13 the blood flow through a cranial bypass,14 and to study changes in the cerebral blood flow induced by cortical activation.15, 16 Most of these applications are performed under the assumption that the thermal radiation does not significantly vary during the measurement. To analyze short-time changes in temperature a sequence of thermographic images must be recorded. Watson visualized cerebrovascular occlusion1 and Gorbach studied changes of the cortex temperature during activation by calculation of differences between thermographic images.15 The distribution of temperature changes did roughly correspond to functional areas, but the weak signals were overlapped with other cerebral activations. These papers render a general problem in neurosurgical thermography. The wanted thermal variations are often relatively weak and overlaid by many other processes, including noise or thermal fluctuations. Therefore, sophisticated statistical methods must be applied to separate different information within a complex thermographic image data cube. Besides the subtraction technique, various mathematical methods, such as finite element analysis17 and artificial neural networks,18 have been applied to enhance the contrast in thermography. However, these statistical methods assume that all important data features are effectively described by the selected parameters. In this paper, we demonstrate a new approach to imaging the cortical cerebral perfusion based on the combination of the cold bolus technique with thermographic imaging and principal component analysis (PCA). This method provides diagnostic information and should influence intraoperative decisions with regard to regional perfusion deficits, ischemic areas, or functional perfusion differences. These important temporary perfusion changes might be available intraoperatively and alter operative progress, for example, if vascular procedures have successfully restored flow in the regions of interest or if intraparenchymal devices are positioned within a critically perfused region. 2.Materials and MethodsAll experimental procedures were approved by the Human Ethics Committee of the Technische Universität Dresden. 2.1.PatientThe 28-year-old male patient had a severe head injury and underwent a craniectomy that exposed the cerebral cortex. The head of the patient was fixed in a special head clamp; therefore, only intrinsic minimal movements of the brain surface occurred. Minor spontaneous parenchymal swelling occurred; however, no malignant swelling or cortical damage was apparent. After opening of the dural covering of the brain, visual inspection did not reveal areas of varying perfusion. A cold bolus of normal saline at 4°C temperature in an amount of ∼10 ml was injected into the vena cava via a central venous access. During the interval from 1 min before to 1 min after the injection, a thermographic image sequence of the exposed cortex was recorded. 2.2.Thermographic ImagingTime-resolved thermography is referred to as thermographic imaging. An advanced digital IR camera (A20 M, FLIR Systems GmbH, Germany) was used to image temperature across the cerebral cortex by detecting IR radiation. The camera has a temperature sensitivity of 0.1 K and produces images of 160 × 120 pixels at a maximum acquisition rate of 50 Hz. Thermographic images were registrated in the wavelength range from 7.5 to 13 μm. The camera was mounted on a ceiling stand and placed ∼50 cm above the cortical surface, producing spatial resolution of approximately 500 × 500 μm. Automated image acquisition started after 30 min, stabilizing time 1 min before the cold saline was injected. The image rate was set to 6.125 Hz. In a total acquisition time of 2 min, 735 images were obtained. Individual thermographic images were saved in tagged image file format (TIFF) with 16-bit resolution. For documentation, digital photographs were captured from the brain surface. 2.3.Data AnalysisThe data cube of the captured thermographic images was imported into a MATLAB Package. Data preprocessing, multivariate data analysis, and image processing were carried out using the MATLAB Package (Version 7, The Math Works Inc., Natick, Massachusetts). PCA was performed using the eig function of the MATLAB Package. 3.ResultsThe initial computer tomogram (CT) of the patient is shown in Fig. 1. The subdural hematoma is located between the skull and the right cerebral hemisphere (white arrows), but no additional cortical or subcortical injuries were visible. Fig. 1Initial CT of the head revealing a left-sided subdural hematoma (white arrows) under the skull, leading to intractable intracranial pressure, which necessitated immediate operative evacuation.  Figure 2 shows the white-light image of the cortex [Fig. 2a] and the thermographic average image [Fig. 2b]. The white-light image reveals an exposed right-sided cerebral cortex after removal of an acute subdural hematoma. The blood in the outer and lower areas of the opening is located in the subarachnoid space, an area covered by the translucent arachnoid membrane, which contains cerebrospinal fluid. The subarachnoid space contains all visible vessels. The thermographic image in Fig. 2b represents the distribution of the thermal radiation across the cortex surface. In comparison to the white-light image in Fig. 2a, the coldest sites correspond to regions outside of middle cerebral artery territory. The warmest sites are within the central area supplied by the middle cerebral artery, which is the first and major distribution of the blood coming from the carotid artery. It is of interest that even the unprocessed images are independent of overlaying blood. Fig. 2(a) White-light image of the exposed brain cortex after right-sided temporofrontoparietal trepanation for evacuation of an acute subdural hematoma. ➀ Sylvian fissure separating, ➁ temporal lobe, ➂ frontal lobe, and ➃ indicates the parietal lobe. (b) Averaged thermographic image computed from the whole image sequence. The dashed line surrounds the cortex.  Before thermographic images can be evaluated, a data preprocessing is required. The aim of the preprocessing is the elimination of signals that obviously include no information about the brain cortex and to minimize noise and other distortions. The procedure of data preprocessing is performed in three stages, as illustrated in Fig. 3a. At first, for each individual thermographic image only pixels that represent the brain cortex are selected. The thermographic average image was used to define a temperature threshold to select pixels that represent the brain cortex, which is indicated by the dotted line in Fig. 2b. In a general way, one can see that the image so obtained is a kind of mask, which is used as a filter for all individual thermographic images. The temperature-time function for each pixel of the selected area were smoothed by Savitzky–Golay filter (third order, seven points). The filter eliminates much of the noise in the signal. Fig. 3(a) Flowchart of data preprocessing and (b) the obtained data cube consisting of 735 individual thermographic images. Pixels that do not correspond to the cortex are represented in black.  The mathematical investigation of temperature variations due to the cold bolus were performed by PCA. This technique was applied to a data cube encompassing the time of the cold bolus injection and 25 s after injection. PCA is a multivariate method for data analysis to maximize the signals from regions with the most variance. Being an unsupervised multivariate method, PCA is routinely applied to IR spectroscopic imaging data sets to compress data and to develop classification models.19 PCA was used because it provides a rapid way to assess variation within a multidimensional data set. Other methods of multivariate data analysis, including factor analysis (FA) or cluster analysis (CA), were tested as well. Although PCA and FA are similar and both reduce the dimensionality of a data set, they achieve this goal in fundamentally different ways. PCA assumes no explicit statistical model underlying the variance of the original thermographic data set. In CA, the original variances are decomposed to common factors. Unique variances, such as changes due to the cold bolus, are not of interest in FA. Although our analysis revealed that FA is more stable against outliers (e.g., distortions in a thermographic image) than PCA, we decided to apply PCA because the cold bolus was much more pounced in the PCA results. Another popular and widely used approach is the k-means CA. This method better highlights the similarities between the variables. For this reason, the relative weak cold bolus signal could be not extracted by k-means CA. Furthermore, two additional problems are associated with k-means CA. First; the number of clusters must be assumed before starting CA, and second, CA is an iteration process and takes much more calculation time than PCA. This could be critical in terms of an application during live surgery, where the results must be presented in as quickly as possible. Principal components (PCs) of the thermographic imaging data cube are formed by loading plots and score maps. The loading plots correspond to time-dependent temperature, where the variation is highest and weights the signals in the positive and negative directions. The score map reveals the weight of the loading plot for each pixel of the image. The highest loading plots correspond to a temperature profile where the variation is greatest. PCA is applied on the raw data matrix without normalization and mean centering. Although both methods of data preprocessing are commonly used in PCA to highlight differences between samples rather than their variations from maximum intensities, it is not helpful here because the temperature of individual pixels is very close to the mean value, and relatively large variations (e.g., due to rinsing) would have a strong impact on the PCA results. Loading vectors and score maps of the first four PCs are represented in Fig. 4. At time t = 0 s, the cold bolus was completely injected. The scores were back-transformed to the morphological image. Score values are plotted on the rainbow color scale, where pixels that were previously removed from the data set are displayed in black. The color scale is adjusted to the difference of maximum and minimum values. The first PC exhibits a variance of 89.4%. It describes the overall temperature variation during the registration period. PC 2 describes variations on different areas of the cortex. The corresponding loading plot exhibits a decreasing trend. We assign the second PC to a slight temperature shift and to nonlinearities of the scores in the first PC. The third PC covers a variance of 2.9%. A dominant localized feature occurs in the loading vector between 11 and 18 s. This lower signal indicates the cold bolus. The cold bolus is registrated after 11 s of injection, which corresponds to other studies.20 In addition, minor periodic variations within the loading plot correspond to the pulse. This leads to the conclusion that the third PC describes mainly the blood flow. Consequently, most of the blood vessels are highlighted in the score map. Therefore, we interpret the lower temperatures between 11 and 18 s as the signal from the cold bolus. Yellow and red pixels in the score image of the third PC represent the cold bolus signal of the blood and correspond to large blood vessels [see Fig. 2a]. The important clinical information from this score image is that the perfusion of the brain is normal and not disrupted. The great vessels transport the blood (i.e., the cold bolus into the brain parenchyma); therefore, one would expect to have a higher variance in the larger vessels compared to the parenchyma. The tissue passage should be presented as a “flattened” PCA loading. Areas ➀ and ➃ have different temperatures, as seen in Fig. 2. This might explain a reduction of the variance in the third PC. Fig. 4PCA results of the thermographic imaging data set, showing scores and loadings of the first four PCs. 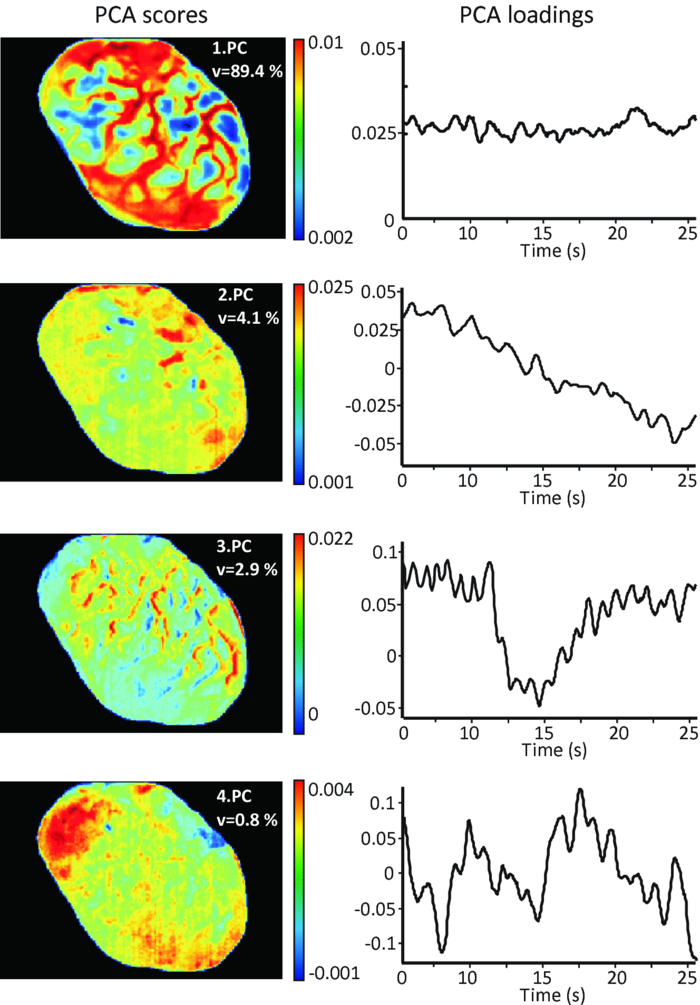 PC 4 shows variations that also correspond to the cold bolus and a series of additional signals. These variations are not homogeneously distributed. This could be caused by regional autoregulative effects that are influenced by the craniotomy and the underlying pathology, in particular, an edematous brain. A possible explanation of the fourth PC can be given by postoperative CT. The CT in Fig. 5 shows an area of intraparenchymal hemorrhagic contusion in the frontal lobe. The position and dimension of the frontal contusion correlate with the area of red pixels in the score map of the fourth PC in Fig. 4. The contusion was not visible on the initial CT (see Fig. 1), which is a typical finding in such pathologies that develop over time after a head injury. We can assume that the underlying pathology developed during surgery after the decompression and led to a local space occupying effect. Although the exact correlate of the variations in the fourth PC are unknown, it is of great interest that differences are recognized in thermographic imaging but not yet in conventional CT imaging. Fig. 5Control head CT obtained five days after surgical evacuation of the hematoma and removal of the bone to alleviate brain swelling. The arrow indicates an intraparenchymal hemorrhagic contusion.  Note that the differences have a lower contrast because PC analysis is intrinsically constrained to orthogonal variations. Therefore, variations might be distributed over several PCs that do not support a direct interpretation21 by a single PC. The cortical cerebral perfusion was characterized during 11 additional craniectomies of patients with acute subdural hematoma, middle cerebral artery (MCA) ischemia, or cerebellar ischemia. Table 1 summarizes the details of the patients and the detection of the cold bolus. A cold bolus signal, as shown in the loading plot of third PC in Fig. 4, is defined as “strong” a “good” signal is clearly detectable; and a “weak” signal is characterized by a signal-to-noise ratio (SNR) between 1 and 2. Table 1Patients with characterization of the cortical cerebral perfusion by the cold bolus technique.
The method provides a high sensitivity and good spatial resolution down to 200 μm. Thermography is not sensitive to subarachnoid contamination with blood and to standard intraoperative white-light illumination. Furthermore, no biochemical markers are required. The miniscule amount of normal saline has no systemic disadvantages. In a future setting, we would utilize a high-sensitivity thermocamera (sensitivity ∼10 mK) with a better spatial resolution down to few micrometers. The new camera system will provide neurosurgeons with more detailed information about the brain perfusion, in particular, concerning the blood flow in smaller blood vessels. A second aim is to extend the thermographic imaging to the detection of brain tumors. 4.ConclusionWe demonstrated the application of multivariate data analysis to a complex thermographic imaging data set. The cortical perfusion was investigated by the cold bolus technique. PCA successfully highlighted important variations in the data set. The loading plot of the third PC showed the cold bolus signal 11 s after injection. The corresponding score map represented the cortical perfusion. Thermographic imaging was applied to 12 patients. The measurements confirmed that thermographic imaging combined with multivariate data analysis is a sensitive method to image temporary alterations of cortical perfusion. ReferencesJ. C. Watson, A. M. Gorbach, R. M. Pluta, R. Rak, D. J. Heiss, and
E. H. Oldfield,
“Real-time detection of vascular occlusion and reperfusion of the brain during surgery by using infrared imaging,”
J. Neurosurg., 96
(5), 918
–923
(2002). https://doi.org/10.3171/jns.2002.96.5.0918 Google Scholar
D. B. Killory, P. Nakaji, L.-F. Gonzales, F. A. Ponce, S. D. Wait, and
R. F. Spetzler,
“Prospective evaluation of surgical microscope-integrated intraoperative near-infrared indocyanine green angiography during cerebral arteriovenous malformation surgery,”
Neurosurgery, 65
(3), 456
–462
(2009). https://doi.org/10.1227/01.NEU.0000346649.48114.3A Google Scholar
J. Woitzik, P. G. Pena-Tapai, U. C. Schneider, P. Vajkoczy, and
C. Thome,
“Cortical perfusion measurement by indocyanine-green videoangiography in patients undergoing hemicraniectomy for malignant stroke,”
Stroke, 37
(6), 1549
–1551
(2006). https://doi.org/10.1161/01.STR.0000221671.94521.51 Google Scholar
W. Ganz and
H. J. C. Swan,
“Measurement of bloodflow by thermodilution,”
Am. J. Cardiol., 29
(2), 241
–246
(1972). https://doi.org/10.1016/0002-9149(72)90635-2 Google Scholar
J. H. Stevens, T. A. Raffin, F. G. Mihm, M. H. Rosenthal, and
C. W. Stetz,
“Thermodilution cardiac output measurement. effect of the respiratory cycle on its reproducibility,”
J. Am. Med. Assoc., 253
(15), 2240
–2242
(1985). https://doi.org/10.1001/jama.253.15.2240 Google Scholar
P. Libby, R. O. Bonow, D. L. Mann, and
D. P. Zipes, A Textbook of Cardiovascular Medicine, Braunwald's Heart Disease, Saunders Publ., Philadelphia (2008). Google Scholar
G. Boris and
G. Vainer,
“FPA-based infrared thermography as applied to the study of cutaneous perspiration and stimulated vascular response in humans,”
Phys. Med. Biol., 50
(23), R63
–R94
(2005). https://doi.org/10.1088/0031-9155/50/23/R01 Google Scholar
D. A. Kenned, T. Lee, and
D. Seely,
“A comparative review of thermography as a breast cancer screening technique,”
Integrat. Cancer Therap., 8
(1), 9
–16
(2009). https://doi.org/10.1177/1534735408326171 Google Scholar
“A review of thermography as promising non-invasive detection modality for breast tumor,”
Int. J. Thermal Sci., 48
(5), 849
–859
(2009). https://doi.org/10.1016/j.ijthermalsci.2008.06.015 Google Scholar
M. Mital and
E. P. Scott,
“Thermal detection of embedded tumors using infrared imaging,”
J. Biomech. Eng., 129
(1), 33
–39
(2007). https://doi.org/10.1115/1.2401181 Google Scholar
M. Anbar, L. Milescu, M. W. Grenn, K. Zamani, and
M. T. Marina,
“Study of skin hemodynamics with fast dynamic area telethermometry (DAT),”
Google Scholar
J. E. Gold, M. Cherniack, and
B. Buchholz,
“Infrared thermography for examination of skin temperature in the dorsal hand of office workers,”
Eur. J. Appl. Physiol., 93
(1–2), 245
–251
(2004). https://doi.org/10.1007/s00421-004-1210-6 Google Scholar
I. A. Shevelev,
“Temperature topography of the brain cortex: thermoencephaloscopy,”
Brain Topogr., 5
(2), 77
–85
(1992). https://doi.org/10.1007/BF01129034 Google Scholar
Y. Okada, T. Kawamata, A. Kawashima, and
T. Hori,
“Intraoperative application of thermography in extracranial-intracranial bypass surgery,”
Neurosurgery, 60 362
–365
(2007). https://doi.org/10.1227/01.NEU.0000255358.86947.9A Google Scholar
A. M. Gorbach, J. Heiss, C. Kufta, S. Sato, P. Fedio, W. A. Kammerer, J. Solomon, and
E. H. Oldfield,
“Intraoperative infrared functional imaging of human brain,”
Ann. Neurol., 54
(3), 297
–309
(2003). https://doi.org/10.1002/ana.10646 Google Scholar
A. Nakagawa, M. Fujimura, T. Arafune, I. Sakuma, and
T. Tominaga,
“Clinical implications of intraoperative infrared brain surface monitoring during superficial temporal artery-middle cerebral artery anastomosis in patients with moyamoya disease,”
J. Neurosurg., 111
(6), 115
–164
(2009). Google Scholar
Q. Y. Lin, H. Q. Yang, S. S. Xie, Y. H. Wang, Z. Ye, and
S. Q. Chen,
“Detecting early breast tumour by finite element thermal analysis,”
J. Med. Eng. Tech., 33
(4), 274
–280
(2009). https://doi.org/10.1080/03091900802106638 Google Scholar
E. C. Kee,
“Advanced integrated technique in breast cancer thermography,”
J. Med. Eng. Tech., 32
(2), 103
–114
(2008). https://doi.org/10.1080/03091900600562040 Google Scholar
G. Steiner, S. Tunc, M. Maitz, and
R. Salzer,
“FTIR imaging of conformational changes in adsorbed protein layers,”
Anal. Chem., 79
(4), 1311
–1316
(2007). https://doi.org/10.1021/ac061341j Google Scholar
T. Hackländer, J. R. Reichenbach, and
U. Mödder,
“Comparison of cerebral blood volume measurements using the T1 and T2* methods in normal human brains and brain tumors,”
J. Comp. Assist. Tomogr., 21
(6), 857
–866
(1997). https://doi.org/10.1097/00004728-199711000-00003 Google Scholar
M. C. Davies and
T. Fearn,
“Back to basics: the principles of principal component analysis,”
Spectrosc. Eur., 16
(6), 20
–23
(2005). Google Scholar
|


