|
|
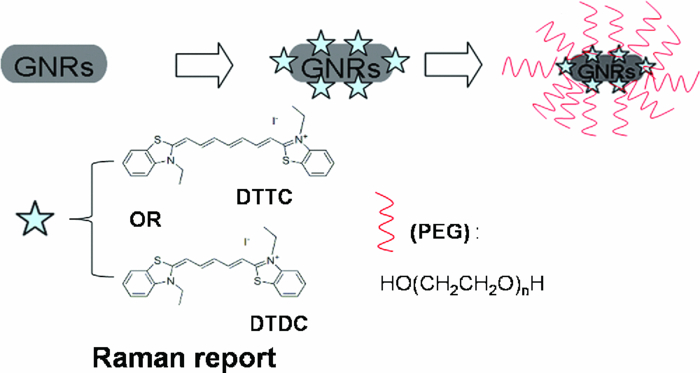
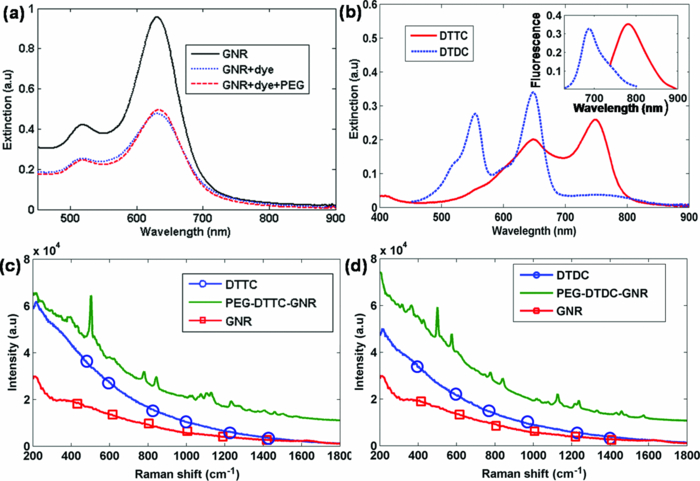
1.IntroductionFluorescence imaging with near-IR light is one of the most common imaging technologies in tissue imaging. Recent nanotechnology has greatly accelerated the development of tissue imaging. Several kinds of nanomaterials with specific optical properties, such as quantum dots (QDs) and upconversion nanoparticles (UCNPs), have been synthesized for tissue imaging. 1, 2, 3 Meanwhile, a gold nanorod (GNR), which is a rod-shaped type of gold nanoparticle, has many applications, e.g., photoacoustic tomography4 (PAT), photothermal therapy,5 and surface-enhanced Raman scattering6 (SERS). In our paper, dye-coated GNRs were synthesized and used in a phantom experiment. During our noninvasive scanning of the phantom, three kinds of information, namely, Raman, fluorescence signals, and absorption contrast, were obtained for tissue imaging. Owing to its fingerprint characteristic to molecule structure, Raman spectroscopy has been well established as a useful tool for structural characterization and dynamic monitoring in various biomedical applications, 7, 8 e.g., Raman microscopy. Raman spectroscopy has also been studied in the macro tissue region, such as tissue characterization,9 Raman diffuse optical tomography10 (DOT), and spatially offset Raman spectroscopy11 (SORS). There are many advantages to applying Raman spectroscopy in tissue imaging. First of all, since each material has its specific Raman spectrum, it is possible to introduce a Raman signal into an imaging system to suppress the autofluorescence of the tissue. Second, the unique feature of the Raman spectrum can help distinguish different exogenous optical contrast reagents (such as fluorophores) from surrounding tissue easily. However, Raman signal is usually too weak to detect. Some technologies (such as SERS; Refs. 12, 13) are used to enhance the intensity of Raman signals to cause them to reach the same level as that of fluorescence signals. Furthermore, Raman spectra are usually obtained by a “point-to-point” scanning probe scheme, which is not convenient for measurement in a large area. The original measured Raman spectrum is usually composed of the fluorescent spectrum and the Raman “fingerprint” peaks. In a traditional SERS experiment, metallic structures are adopted to enhance the Raman signals as much as possible and meanwhile suppress the fluorescent signals by quenching them to a very low intensity. However, in this paper, we not only made use of the remaining part of the fluorescence, which was partly quenched but still detectable during the experiment, but also kept the Raman signals enhanced sufficiently large for the detection. As both fluorescence and Raman signals could provide the imaging information of the nanoparticles inside the phantom, we introduce fluorescence-guided Raman detection as a new kind of method for Raman measurement. We make good use of the fluorescent signals, which provide some additional information for imaging besides Raman signals at these fluorescent locations for tissue imaging (i.e., in this way it is not necessary to spend time and effort to study Raman signals at locations where there are no fluorescent signals). GNRs have unique optical properties and have attracted much attention in biomedical applications such as bioimaging, biosensing, and drug delivery. A GNR has two localized surface plasmon (SPR) resonance (LSPR) bands, which are called the transverse band and the longitudinal band, corresponding to electron oscillations in the short and long axes of the nanorod, respectively. The longitudinal LSPR band expresses strong scattering and absorption and can be tuned from visible to near-IR (NIR) region by adjusting the aspect ratio (diameter to length) of the nanorods. GNRs can also be used to enhance the Raman scattering intensity of molecules adsorbed on GNR surfaces up to 1014-fold. In this paper, 3,3′-diethylthiadicarbocyanine iodide (DTDC) and 3,3′-diethylthiatricarbocyanine iodide (DTTC), which are two kinds of dyes (fluorophores) with rich Raman spectra, were attached on the surfaces of the GNRs. Under laser excitation and dye-coated GNRs could exhibit very strong Raman signals, which were comparable with fluorescence intensity and high enough for tissue imaging applications. Furthermore, in addition to Raman and fluorescent signals of the dye molecules, the absorption contrast of dye-coated GNRs can bring another type of information, which is also very useful in tissue monitoring/imaging. 2.Experiments2.1.ChemicalsThe chemicals used for synthesis of GNRs, including chloro- auric acid (HAuCl4·3H2O), CTAB, sodium borohydride (NaBH4), silver nitrate (AgNO3) and ascorbic acid, and the chemicals for making phantom, including gelatin and TiO2 were purchased from Sinopharm Chemical Reagent Co., Ltd., China. 3,3′-diethylthiatricarbocyanine iodide (DTTC), 3,3′-diethylthiadicarbocyanine iodide (DTDC) and thiol-polyethylene glycol (SH-PEG) were obtained from Sigma Aldrich. Deionized (DI) water was used in all the experimental steps. 2.2.Synthesis of Dye-Coated GNRsGNRs used in our experiment were synthesized through a two-step seed-mediated growth method.14 To coat Raman reporter molecules (see Fig. 1), GNR solutions were brought to 10,000 times molar amount of both DTDC (DTTC) and 5-kDa thiol-PEG, and dialyzed for 16 h in a 5-kDa-cutoff cellulose membrane.15 After dialysis, samples were purified with centrifugation to eliminate excess DTDC/DTTC and PEG molecules, and stored at 4°C for later use. In this paper, we call the dye-coated GNRs PEG-dye-GNRs (dye stands for DTTC or DTDC). 2.3.Experimental CharacterizationTransmission electron microscope (TEM) analyses were derived from JEOL JEM-1200EX equipment, which is suitable for the investigation of PEG-dye-GNRs. The UV and visible extinction spectra were recorded from the scale of 250 to 900 nm with a Shimadzu 2550 UV-vis scanning spectrophotometer at room temperature. 2.4.Phantom PreparationA tissue phantom of gelatin/TiO2/India ink was made and detail of the synthesis method is given in Swartling 16 The gelatin phantom used in our experiment had reduced scattering coefficient μ′ sca of about 2.0 cm−1 and absorption coefficient μabs of about 0.06 cm−1 under 1030 nm superluminescent diode (SLD) excitation. 2.5.Raman/Fluorescence Signal DetectionIn Fig. 2a, two tiny tubes filled respectively with the solution of PEG-DTTC-GNRs and PEG-DTDC-GNRs, were submerged into the phantom at a depth of 3.0 mm. The diameters of both tubes were 2.0 mm, and the distance between them was 1.0 cm. A Raman probe, which consisted of a 300-mW cw laser at 785 nm and a Raman spectrometer, was used to scan the phantom along the y direction (as shown in Fig. 2). The focal length of the convex lens of the Raman probe was 7.5 mm, and a backscattering geometry (a conventional method in Raman spectroscopy11) was adopted to detect the optical signals. During the scanning, Raman signals, fluorescence signals, and elastic scattering signals were all collected by the probe. A bandpass filter was used to ensure the monochromaticity of the excitation laser and a long-pass filter was used to block the elastic scattering and extract the Raman signals. To introduce more light into the phantom, minimize the random noise, and enhance the Raman intensity, the Raman probe was placed near (about 2 mm away from) the surface of the phantom and the integration time of each detection process was set at 40 s. Furthermore, the probe was slightly tilted from the normal direction of the phantom surface to improve the collection efficiency of the back scattering signals. 3.Results3.1.Raman Spectra of PEG-dye-GNRsFigure 3 shows the TEM images of GNRs (left) and PEG-DTTC-GNRs (right). As expected, these nanoparticles had a rod shape, and their rough average length and diameter were about 54 and 19 nm, respectively. The TEM image of the PEG-DTTC-GNRs is similar to that of the pure GNRs. In our experiment, GNRs with a longitudinal extinction peak of 632 nm [Fig. 4a] were chosen. As mentioned before, a dialysis procedure was used for the synthesis of dye-coated GNRs. The absorption spectra of the synthesized GNRs became smaller since some of the GNRs were lost during the dialysis. Only tiny wavelength shifts can be observed among the absorption spectra of GNRs, the dye-coated GNRs, and PEG-dye-coated GNRs, as shown in Fig. 4a, though the amount of the dye was 5000 times of that of GNRs. Since GNRs dominated the absorption of the dye-coated GNRs or PEG-dye-GNRS, PEG-dye-GNRs could still provide a high absorption contrast, as did the pure GNRs. As shown in Figs. 4c and 4d, the original measured Raman spectra of free DTTC/DTDC molecules (in solution) could not be observed [the curves with circle marked in Figs. 4c and 4d], although the excitation cw laser power (300 mW at 785 nm) was high and the integrated time of the detector was long enough (40 s). However, due to SERS effect, the intensity of the original measured Raman spectra of DTTC/DTDC molecules (in solution) was greatly enhanced by GNRs, even if the integrated time was just 100 ms. From the solid curves in Figs. 4c and 4d, we can find that DTTC molecule has its characteristic Raman peaks at 502, 632, 778, 841, 1129, and 1237 cm−1, and the DTDC molecule has its Raman peaks at 502, 578, 632, 778, 841, 1129, and 1237 cm−1. Here, 578 cm−1 is the unique DTDC Raman peak, which could distinguish it from DTTC. To show that Raman spectra were not from the GNRs, the original measured Raman spectra of (only) GNRs (CTAB coated) was also measured as a control experiment [the curves with square marked in Figs. 4c and 4d], and almost no Raman signal could be observed (as expected). 3.2.Scanning Raman/Fluorescence Signal in PhantomFigures 5a and 5b show the detection results when the Raman probe was placed to aim at the red tube (doped with PEG DTTC-GNRs) and blue tube (doped with PEG-DTDC-GNRs) [shown in Fig. 2a], respectively. The baseline curves [discounted from the original measured Raman spectra by the “Peak analyzer” tool of the Origin program, shown in the inserts of Figs. 5a and 5b] composed of the fluorescence spectra of DTTC/DTDC and the autofluorescence spectra of the phantom. When the baseline was subtracted, the net Raman spectra of DTTC and DTDC were obtained [shown in Figs. 5c and 5d, which were then smoothed by the smoothing tool of Origin program]. Just as shown in Figs. 4c and 4d, it is easy to see that the Raman spectrum of PEG-DTTC-GNRs contains characteristic peaks at 502, 632, 778, 841, 1129, and 1237 cm−1, while the Raman spectrum of PEG-DTDC-GNRs contains characteristic peaks at 502, 578, 632, 778, 841, 1129, and 1237 cm−1. As reported previously, the low signal-to-noise ratio (SNR) of the backscattering Raman signal detected from tissue could be improved by spatially offset Raman spectroscopy17 (SORS). By using SERS in our experiment, the back scattering Raman signal, as well as its SNR, could be enhanced enormously. With the advantages of SERS signals, we can determine the locations of the two tubes filled with PEG-dye-GNRs by performing 1-D scanning along the y axis to acquire the original measured Raman spectra, as shown in Fig. 2a. First, the red dotted curve in Fig. 6b, standing for the fluorescence signal of DTTC/DTDC and the autofluorescence of the phantom (which was mainly included in the original measured Raman spectrum) detected along the scanning direction, provides the location information of the two tubes. Second, the imaging could also be acquired from the Raman intensity. The green solid curve in Fig. 6b was the distribution of Raman signal along the scanning direction, which corresponds to the intensity of Raman signal at 502 cm−1 [both the DTTC and DTDC have a Raman peak at 502 cm−1, as shown in Figs. 5c and 5d]. Here, the fluorescence and Raman signals were normalized and magnified in Figs. 6c and 6d to represent these two curves more clearly. From the Raman intensity curves, one could also tell directly the positions of two tiny tubes. Furthermore, comparing these two kinds of signals, we could see that the gradient of the Raman intensity was more abrupt than that of the fluorescence intensity [see Figs. 6c and 6d]. This was so because the fluorescence signal was affected by autofluorescence. Suppressing the autofluorescence is challenging work. As we know, UCNPs (Ref. 3) and spectral component analysis18 are two useful methods to reduce the autofluorescence during imaging. However, in our study, it was difficult to separate the fluorescence signal from the autofluoresence by utilizing a single spectrometer and two kinds of traditional fluorescence dyes. However, the Raman signal was obtained by subtracted the baseline (including fluorescence signals and autofluoresence background) from the original measured Raman spectrum, and thus the autofluoresence can be easily removed from the Raman signal. Meanwhile, the Raman spectra have also been greatly enhanced by the GNRs due to the SERS effect. Therefore, the Raman signal of the dye-coated GNRs could provide better signal-to-background contrasts than a fluorescence signal. In addition, the Raman spectrum could also distinguish the chemical composition in these tubes, because the Raman spectrum is due to some specific molecular vibration of the dye. From the scanning results of the Raman spectra [shown in Figs. 5c and 5d], we can distinguish DTTC and DTDC from each other very easily. Therefore, we can determine both the position and type of the nanoparticles doped inside the phantom through Raman imaging. 3.3.Results of Transmission ScanningIn addition, PEG-dye-GNRs could give a high absorption contrast as the third kind of information. As shown in Fig. 2a, the GNRs used in our experiment have a longitudinal extinction peak around 632 nm. After dyes and PEG coating, their extinction peak did not shift very much. Although the absorption peak was reduced by 50% since part of the GNRs was lost during the dialysis procedure, the PEG-dye-GNRs still provided great absorption around 632 nm. A schematic illustrating the transmission scanning of a phantom with two tubes of PEG-dye-GNRs is shown in Fig. 7a, and the input laser beam (from a 632-nm cw laser) and detector probe were collinearly scanning synchronously. The tubes were submerged into the phantom at a depth of 3.0 mm, and the distance between them was about 1 cm. This setup of the phantom was similar to that shown in Fig. 2a. The blue tube (right) was filled with a solution of PEG-DTDC-GNRs, and the red tube (left) was filled with a solution of PEG-DTTC-GNRs. Due to the high absorption contrast of PEG-dye-GNRs, the positions of both tubes could also be obtained from the transmission result. The notches of the curve represented the location of tubes with GNRs [Fig. 7b]. As a result, PEG-dye-GNRs, which were doped in the phantom, could provide the high absorption contrast as the third kind of information in tissue imaging. Fig. 7(a) Schematic diagram of the transmission detection and (b) the 1-D transmission collinearly scanning along the yaxis. Because of the absorption of PEG-dye-GNRs, there are two notches in the transmission curve due to the two tubes inside the phantom, giving the location information of these two tubes.  4.DiscussionIn the SERS configuration, GNRs with a longitudinal extinction peak located at 632 nm and coated with dye molecules with fluorescence spectra around 780 nm (DTTC) or 690 nm (DTDC) [see the inset of Fig. 4b] were used. Since Raman and fluorescence signals were supposed to be obtained simultaneously in the experiment, 632-nm GNRs were adopted to enhance the Raman spectrum and reduce the absorption and quench of fluorescence signals (if we choose the GNRs with an absorption peak near the fluorescence spectrum of the DTTC or DTDC, the fluorescence signal would be attenuated enormously and hardly detected). From Fig. 6b we see that the overlap between the fluorescence and Raman intensity curves could provide a new kind of Raman measurement in tissue imaging, i.e., fluorescence-guided Raman detection. Using our PEG-dye-GNRs, the fluorescence imaging could be a crucial prestep for Raman measurement. As we know, the measurement of Raman spectroscopy requires a long integration time, for example, 40 s in our study, to improve the SNR of the Raman spectrum. Therefore, large-area detection of Raman spectra, which is usually measured by a point-to-point probe scanning over the sample, is a time-consuming procedure. As shown in Fig. 6, Raman and fluorescence signals could both provide the location information of the tubes inside the phantom. Since both the Raman and fluorescence signals were derived from the PEG-dye-GNRs, the location of the fluorophores can also indicate the location of Raman molecules. Before performing Raman detection, fluorescent imaging could be operated rapidly by using traditional method [e.g., a 2-D array of detectors, i.e., a CCD (Ref. 19), provides a good way in fluorescent imaging]. Raman detection could be then performed around the “important regions,” where comparatively strong fluorescent signals have been detected. Hence, Raman detection could be made more effective by avoiding wasting time detecting Raman signals in some “unimportant regions” (with weak fluorescence signal). Fig. 6(a) Positions of the two tubes inside the phantom; (b) distributions [1-D scanning along the y axis, as shown in Fig. 2(a)] of signals for Raman and fluorescence; and (c) and (d) the comparison for the gradient of the peaks shown in (b).  In addition, several experiments were carried out to examine the chemical stability of PEG-dye-GNRs. The PEG-dye-GNRs were adjusted to seven different pH values (i.e., pH = 2, 4, 6, 7, 8, 10, 12), and after 6 h, their fluorescence and Raman spectra were measured by the Raman spectrometer (under a 100-mW 785-nm cw laser excitation). Here, the Raman intensity stands for the intensity from the 817-nm-wavelength Raman peak (corresponding to the Raman peak at a wave number of 502 cm−1, as shown in Fig. 5). The detected fluorescence/ Raman intensity at different pH values were normalized by that at pH = 7 and are shown in Figs. 8a (PEG-DTTC-GNRs) and 8(b) (PEG-DTDC-GNRs). The results indicate that the fluorescence of PEG-dye-GNRs could remain stable in both weak alkalescent and acidic environments. Similarly, the Raman intensity could also be detected in weak alkalescent and acidic environments, indicating the PEG-dye-GNRs structure was still stable enough in such conditions (the Raman peaks would disappear once the PEG-dye-GNRs structure was broken down). Furthermore, the photobleaching property of the PEG-dye-GNRs, as well as pure dye, was also studied. In our study, the dye was coated on the surfaces of GNRs (as mentioned before), and consequently its quenching efficiency, which was caused by GNRs, was relatively high.14 Therefore, in the presence of GNRs, the fluorescence signal of the dye decreased quite much, but was still detectable in our study. However, the photobleaching effect of the PEG-dye-GNRs was not as obvious as that of the pure dyes, as shown in Figs. 8c and 8d. Because, when PEG-dye-GNRs were excited by laser, most optical energy could be harvested by the GNRs, giving an enhanced electromagnetic field on their surfaces due to the SPR effect, and the enhanced electromagnetic field would then enhance the Ramon spectroscopy. In this nanoplatform, the real optical energy contributing to the fluorescence excitation would be reduced, and the photobleaching effect of the PEG-dye-GNRs is not as obvious as that of the pure dyes. In addition, when excited by the 785-nm laser, the absorption coefficient of DTTC at this wavelength is 2.5 times larger than that of DTDC, and thus the photobleaching effect of the DTTC is larger than that of DTDC. Fig. 5(a) Original measured signal when the probe was aimed at the red tube [Fig. 2a, doped with PEG-DTTC-GNRs]; (b) the detected signal when the probe was aimed at blue tube [Fig. 2a, dope with PEG-DTDC-GNRs]; and (c) and (d) the net Raman spectra of (a) and (b), respectively. Here the net Raman spectra were obtained by the “Peak analyzer” tool of the Origin program. (Color online only).  Fig. 8Stability of the PEG-dye-GNRs: (a) and (b) the Raman and fluorescence intensity of (a) PEG-DTTC-GNRs and (b) PEG-DTDC-GNRs, respectively, under different PH value conditions (after 6 h); and (c) and (d) the photobleaching characteristics for DTTC (PEG-DTTC-PEG) and DTDC (PEG-DTDC-GNRs), respectively. 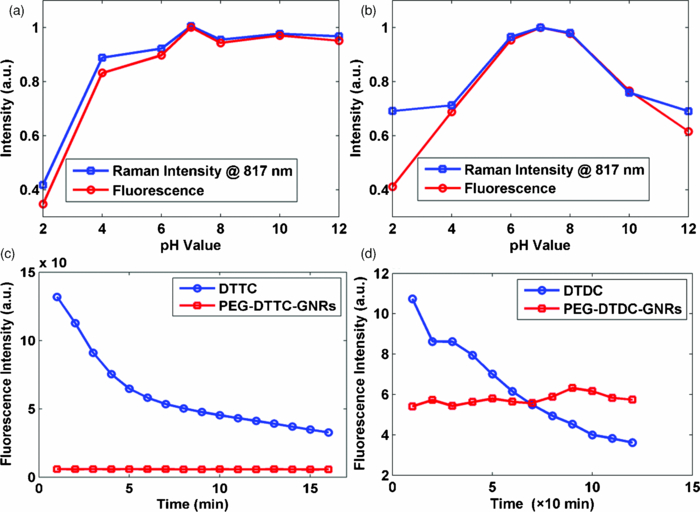 5.ConclusionsWe showed that PEG-dye-GNRs can provide three kinds of information in phantom measurement. First, it can give us the fluorescent signal, which can be used in fluorescent imaging. Second, the enhanced Raman signal can also be used to image the nanoparticle tubes inside the phantom, which could extend the Raman imaging to tomography10 in the future. Third, the absorption property presents another kind of information for tissue imaging. Reconstruction of the absorption coefficient20 is very useful in detecting tumors. But the difficulty of diagnosis for early stage cancer is the low contrast of the absorption between abnormal and normal tissues. Using the advantages of good biocompatibility and the high absorption property of PEG-dye-GNRs, we are going to use dye-coated GNRs for cancer diagnosis. In addition, PEG-GNRs were also applied as a new kind of computed tomography (CT) contrast agent recently,21 which give our PEG-dye-GNRs a good potential for future x-ray imaging applications. From the stability test of PEG-DTTC/DTDC-GNRs, these nanoparticles would have the potential to be applied as a long-term in vivo bioimaging agent in the future. AcknowledgmentsThis work is partially supported by the National Natural Science Foundation of China (Grants No. 60688401 and No. 61008052), the Swedish Foundation for Strategic Research (SSF), the Brain-Bridge project (ZJU-TU/e and Philips Research collaboration), the Fundamental Research Funds for the Central Universities and the China Postdoctoral Science Foundation (Grant No. 20090461394). ReferencesA. Koenig, L. Hervé, V. Josserand, M. Berger, J. Boutet, A. D. Silva, J.-M. Dinten, P. Peltié, J.-L. Coll, and
P. Rizo,
“In vivo mice lung tumor follow-up with fluorescence diffuse optical tomography,”
J. Biomed. Opt., 13
(1), 011008
(2008). https://doi.org/10.1117/1.2884505 Google Scholar
X. Gao, Y. Cui, R. M. Levenson, L. W. K. Chung, and
S. Nie,
“In vivo cancer targeting and imaging with semiconductor quantum dots,”
Nature Biotechnol., 22 969
–976
(2004). https://doi.org/10.1038/nbt994 Google Scholar
C. T. Xu, N. Svensson, J. Axelsson, P. Svenmarker, G. Somesfalean, G. Chen, H. Liang, H. Liu, Z. Zhang, and
S. Andersson-Engels,
“Autofluorescence insensitive imaging using upconverting nanocrystals in scattering media,”
Appl. Phys. Lett., 93 171103
(2008). https://doi.org/10.1063/1.3005588 Google Scholar
Y. Sun, E. Sobel, and
H. Jiang,
“Quantitative three-dimensional photoacoustic tomography of the finger joints: an in vivo study,”
J. Biomed. Opt., 14
(6), 064002
(2009). https://doi.org/10.1117/1.3257246 Google Scholar
J. L. Li, D. Day, and
M. Gu,
“Ultra-low energy threshold for cancer photothermal therapy using transferrin-conjugated gold nanorods,”
Adv. Mater., 20
(20), 3866
–3871
(2008). https://doi.org/10.1002/adma.200800941 Google Scholar
K. Kneipp, M. Moskovits, and
H. Kneipp, Surface-Enhanced Raman Scattering: Physics and Applications, Springer, Berlin
(2006). Google Scholar
Y. Wei, C. Cao, R. Jin, and
C. A. Mirkin,
“Nanoparticles with Raman Spectroscopic Fingerprints for DNA and RNA Detection,”
Science, 297 1536
–1549
(2002). https://doi.org/10.1126/science.297.5586.1536 Google Scholar
A. T. Tu, Basic Concept and Elementary Theory: Raman Spectroscopy in Biology, Wiley, New York
(1982). Google Scholar
S. Koljenovic, T. C. B. Schut, R. Wolthuis, B. de Jong, L. Santos, P. J. Caspers, J. M. Kros, and
G. J. Puppels,
“Tissue characterization using high wave number Raman spectroscopy,”
J. Biomed. Opt., 10
(3), 031116
(2005). https://doi.org/10.1117/1.1922307 Google Scholar
M. V. Schulmerich, J. H. Cole, K. A. Dooley, M. D. Morris, J. M. Kreider, S. A. Goldstein, S. Srinivasan, and
B. W. Pogue,
“Noninvasive Raman tomographic imaging of canine bone tissue,”
J. Biomed. Opt., 13
(2), 020506
(2008). https://doi.org/10.1117/1.2904940 Google Scholar
P. Matousek,
“Deep non-invasive Raman spectroscopy of living tissue and powders,”
Chem. Soc. Rev., 36 1292
–1304
(2007). https://doi.org/10.1039/b614777c Google Scholar
B. Nikoobakht and
M. A. El-Sayed,
“Surface-enhanced Raman scattering studies on aggregated gold nanorods,”
J. Phys. Chem. A, 107 3372
–3378
(2003). https://doi.org/10.1021/jp026770 Google Scholar
S. Nie and
S. R. Emory,
“Probing single molecules and single nanoparticles by surface-enhanced Raman scattering,”
Science, 275 1102
–1106
(1997). https://doi.org/10.1126/science.275.5303.1102 Google Scholar
X. Li, J. Qian, L. Jiang, and
S. He,
“Fluorescence quenching of quantum dots by gold nanorods and its application to DNA detection,”
Appl. Phys. Lett., 94 063111
(2009). https://doi.org/10.1063/1.3080662 Google Scholar
G. V. Maltzahn, A. Centrone, J.-H. Park, R. Ramanathan, M. J. Sailor, T. A. Hatton, and
S. N. Bhatia,
“SERS-coded gold nanorods as a multifunctional platform for densely multiplexed near-infrared imaging and photothermal heating,”
Adv. Mater., 21 3175
–3180
(2009). https://doi.org/10.1002/adma.200803464 Google Scholar
J. Swartling, J. S. Dam, and
S. Andersson-Engels,
“Comparison of spatially and temporally resolved diffuse-reflectance measurement systems for determination of biomedical optical properties,”
Appl. Opt., 42
(22), 4612
–4621
(2003). https://doi.org/10.1364/AO.42.004612 Google Scholar
P. Matousek, E. R. C. Draper, A. E. Goodship, I. P. Clark, K. L. Ronayne, and
A. W. Parker,
“Noninvasive Raman spectroscopy of human tissue in vivo,”
Appl. Spectrosc., 60
(7), 014012
(2006). https://doi.org/10.1366/000370206777886955 Google Scholar
J. R. Mansfield, K. W. Gossage, C. C. Hoyt, and
R. M. Levenson,
“Autofluorescence removal, multiplexing, and automated analysis methods for in-vivo fluorescence imaging,”
J. Biomed. Opt., 10
(4), 041207
(2005). https://doi.org/10.1117/1.2032458 Google Scholar
J. G. Wolodzko, C. Marsden, and
A. Appleby,
“CCD imaging for optical tomography of gel radiation dosimeters,”
Med. Phys., 26
(11), 2508
–2513
(1999). https://doi.org/10.1118/1.598772 Google Scholar
S. R. Arridge, P. Van. Der. Zee, M. Cope, and
D. T. Delpy,
“Reconstruction methods for infrared absorption imaging,”
Proc. SPIE, 1431 204
–215
(1991). https://doi.org/10.1117/12.44191 Google Scholar
D. Kim, S. Park, J. H. Lee, Y. Y. Jeong, and
S. Jon,
“Antibiofouling polymer-coated gold nanoparticles as a contrast agent for in vivo x-ray computed tomography imaging,”
J. Am. Chem. Soc., 129 7661
–7665
(2007). https://doi.org/10.1021/ja071471p Google Scholar
|