
|
|
1.IntroductionThe material properties of the cornea are important determinants of corneal shape and refractive power. Consequently, alteration of these properties by disease or surgery can have profound visual implications. Ectatic diseases, such as keratoconus, pellucid marginal degeneration, and keratoglobus, are characterized by progressive thinning and distortion of the cornea, and as a class, represent a leading indication for corneal transplantation.1, 2 It is imperative to avoid the potential destabilizing effects of photoablative corneal refractive surgery in corneas that are predisposed to biomechanical instability, because postoperative ectasia is a major clinical concern.3 Identification of early keratoconus is therefore a major emphasis of preoperative refractive surgery evaluations, but traditional screening tools are limited by a reliance on late features of disease and an inability to detect subclinical abnormalities of material strength.4 In addition to playing a key role in the pathophysiology of keratectasia,4, 5, 6 corneal biomechanical properties influence the predictability of optical outcomes after laser in situ keratomileusis, photorefractive keratectomy, and other corneal surgeries.7, 8, 9 Material properties have not been explicitly accounted for in surgical algorithms, however, due in part to a need for clinical techniques capable of measuring them. With modern clinical anterior segment imaging technologies capable of 3-D geometric specification of corneal shape, computational models to simulate corneal curvature change in surgery could play an important role in clinical decision making if coupled with patient-specific in vivo 3-D elastic property estimates. Historically, such models have used bulk elastic modulus values obtained from ex vivo testing that vary widely due to differences in experimental conditions10 and a tendency for ex vivo testing to underestimate in vivo elasticity.11 Corneal biomechanical properties are also a confounder of intraocular pressure (IOP) measurement,12 a critical component in the clinical management of glaucoma, and errors in measurement are particularly likely after corneal surgery or in diseases that alter corneal material properties. Characterization of the spatial material properties of normal cornea, besides being of basic interest, also has important applications in the development of synthetic and tissue-engineered corneal substitutes. Ophir. first reported the use of ultrasound image speckle cross correlation for the estimation of biological tissue elasticity in 1991.13 Over a decade later, Hollman presented strain maps from an ex vivo cornea using high-frequency ultrasound speckle tracking in an approach that required a coupling water bath and through-focusing to image the full-thickness cornea.14 Schmitt extended the general concept of elastography to OCT, an imaging technique with spatial resolution superior to ultrasound and with no requirement for coupling fluid contact, and used embedded tissue markers and dermal image speckle as correlation targets.15 Spectral domain OCT elastography has been described for cardiovascular atheroma characterization,16 and Torre-Ibarra, Ruiz. recently described the use of phase-contrast spectral OCT to measure 1-D (axial) corneal displacements.17 Techniques such as directional surface wave velocimetry18 and high-speed monitoring of surface deformation during an air puff19 have also been described for inferring corneal mechanical properties, but these approaches do not provide the capability for multidimensional or subsurface property resolution. The cornea, which is avascular and highly accessible for fine control of mechanical perturbations, is an excellent target tissue for OCT elastography, given that OCT speckle is most stable and least prone to decorrelation under conditions of low fluid flow and small displacement.20, 21 In light of the clinical need for measurement of corneal biomechanical properties, our objective was to investigate OCT-based elastography as a potential in vivo tool for generating high-resolution 2-D maps of corneal deformation that can be related to local corneal elastic and viscoelastic behavior. We describe a corneal elastography technique in which displacements of intracorneal optical features in human tissue in response to a clinically feasible stress sequence are tracked via a cross-correlation algorithm. 2.MethodsValidation of the software and hardware was performed through a series of experiments. The imaging was performed on a linear-wavenumber Fourier domain OCT (FDOCT) custom-built system centered at 1310 nm with 60-nm bandwidth, a spot size of 26 μm, and a scan rate of 40-k lines per second with a sample arm power of 14 mW and a 12-bit custom spectrometer. Figure 1 shows an optical model (ZEMAX version 24 June 2008, Zemax Development Corporation, Bellevue, Washington) of the OCT scanner used in the experiments described here. The scanner provides a highly regular scan profile over a range sufficient to image the entire width of the cornea and a portion of the sclera in a single scan. The collimator consists of one aspheric and one achromatic lens, and the objective consists of one achromatic and one singlet lens to provide chromatic and spherical aberration compensation with a resulting spot size of 17 μm at 50% of the peak power and 26 μm at 13.5% of the peak power. The spot size and profile remain nearly constant through the full scanning range of 15 mm in the x and y directions, as shown in Fig. 1. The scanner shown in Fig. 1 has a high recoupling efficiency of ~ 50% on average. The hot mirror allows the use of either a camera for observation or a fixation target for centering a subject's gaze. Displacement tracking was accomplished using a custom 2-D cross-correlation algorithm. The speckle tracking software was written in C++ for computational speed, and display and statistical analysis algorithms were written in Matlab™ (The MathWorks, Incorporated, Natick, Massachusetts). When comparing two images a window was taken from the first image and a series of windows from the second image near the origin of the first window were then compared to it. Each pixel was considered as a single gray-scale value. The values of the pixels within the two windows were then compared using the following normalized cross-correlation formula:
[TeX:]
\documentclass[12pt]{minimal}\begin{document}\begin{equation*}
C\left({x,y} \right) = \frac{{\sum\limits_{x,y} {[ {M({x,y}) - \overline {M}} ][ {N({x,y}) - \overline {N}} ]} }}{{\left\{ {\sum\limits_{x,y} {[ {M({x,y}) - \overline M } ]^2 \sum\limits_{x,y} {[ {N({x,y}) - \overline N }\, ]^2 } } } \right\}^{0.5} }},
\end{equation*}\end{document}
where C(x,y) is the correlation coefficient at location (x,y), M(x,y) is the value of the pixel from window 1 at position (x,y) after scaling and log conversion, N(x,y) is the value of the pixel from window 2 at position (x,y) after scaling and log conversion, x is the horizontal position of the pixel, y is the vertical position of the pixel,
[TeX:]
\documentclass[12pt]{minimal}\begin{document}$\overline {M}$\end{document}
is the average pixel value of window 1, and
[TeX:]
\documentclass[12pt]{minimal}\begin{document}$\overline {N}$\end{document}
is the average pixel value of window 2. Note that the summations are performed over all independent x,y values for both windows.The correlation values were collected from each of the window comparisons. The relative window shift with the highest correlation represented the greatest likelihood of that feature's displacement. That displacement vector was then assigned to the position of the center pixel in window 1. This process was repeated for each pixel in the image. In this manner, a displacement vector was assigned to each of the pixels in the OCT image. To reduce the calculation time, thresholding was used to remove simple white noise from the image-processing steps. The threshold was set based on the average value of noise in a window, where there is no tissue-based signal and no substantial equipment effects such as falloff.22 The windows used to perform the cross correlation were then averaged and thresholded to ensure the presence of signal in the window. No signal or frame averaging or other image processing was used to enhance the appearance of the image prior to the correlation calculations. The accuracy of displacement measurements was investigated by placing a human donor cornea (Cleveland Eye Bank, Clevelend, Ohio) on a micrometer positioning stage (NewFocus 9351 Micrometer, NewFocus Corporation, San Jose, California) and moving it through a series of six 2-μm displacements with 2-D OCT scans after each increment. The displacement direction was angled to the plane of the image to ensure displacement in both the axial and lateral directions. The displacement magnitudes were averaged across all pixels in the image for each step, then plotted against the mechanical displacement registered by the micrometer stage. The standard deviation of all pixel displacements in the image was used to estimate the variability of the displacement algorithm. A second experiment simulated the effect of signal-to-noise ratio (SNR) and correlation kernel size on the correlation performance and displacement error of the algorithm. An image of human corneal tissue was duplicated in software, then the duplicate image was displaced by three pixels laterally and two pixels vertically to simulate a lateral and axial displacement. Because the two images are identical, this is a situation in which the signal is constant and the noise is effectively zero, simulating an ideal system with an infinite SNR. Random uniformly distributed noise was added to the displaced image using software to simulate the effect of system noise on interframe pixel values. The noise level was chosen to simulate a range of system SNRs from a value much higher (150 dB) to a value much lower (50 dB) than encountered in current OCT systems. The white noise was evenly distributed in spatial frequency and magnitude to simulate system noise. The window size (in pixels) used in the correlation analysis was varied from 5×5 to 45×45 pixels. The accuracy of the displacement-tracking algorithm was then evaluated by measuring the average correlation coefficient and the displacement error for all portions of the image, defined as the presence of an incorrectly identified displacement in the algorithm's result. Displacement error was treated as a continuous variable (distance in pixels from true position) in initial experiments (presented later). Displacement error was treated as a binary result with a frequency rather than a magnitude in the final analysis, because the presence of a tracking error represents an incorrectly identified bitmap and has no direct physical analog. In another experiment, a phantom based on an image of the human cornea was used to simulate the effect of strain-based distortion of the tissue on the algorithm. The tissue image was compressed axially from 0 to 20% strain and resampled to simulate the effect of an ideal strain occurring during OCT imaging, and then processed using the described algorithm with a window size of 15×15 pixels. The strain-based distortion phantom was used to determine the maximum strain limit at which the tissue deformation causes the displacement-tracking algorithm to fail under ideal circumstances with no noise, where failure was conservatively defined as a correlation coefficient dropping to <0.6, as determined by the results of the phantom experiments described before and in Section 3. Another series of experiments was performed to estimate the effect of sampling density on 2-D correlation performance in the presence of displacements out of the imaging plane. Corneal tissue from a previous experiment was displaced in 1-μm increments perpendicular to the imaging plane over a total distance of 10 μm (approximately one-half the spot size of the OCT device) using a computer-controlled microstage (Zaber Technologies Incorporated, TLA-28 Linear Actuator, Vancouver, Canada). The in-plane position of the tissue sample was held constant to isolate the effect of pure out-of-plane displacement on the in-plane correlation coefficient. The out-of-plane displacements were smaller or equal to the sampling density and significantly smaller than the spot size of the imaging system used for these experiments. The algorithm was then used to estimate the in-plane displacement distance (in this case, zero), and the resulting correlation coefficients were analyzed to estimate the effect of sampling and out-of-plane displacements on the correlation coefficient. In a final experiment designed to investigate tracking performance under simulated in vivo conditions, a human donor whole globe was obtained from the Cleveland Eye Bank, three days postmortem. The donor eye was mounted in an artificial orbit, stabilized, and pressurized as described later to maintain the IOP at a physiologic level of 15 mmHg (Fig. 2). The corneal epithelium and epithelial basement membrane were removed with a blunt blade. To counteract postmortem corneal edema and restore a thickness consistent with physiologic conditions, a hyperosmolar 15% dextran solution (MW 500,000, Sigma, Saint Louis, Missouri) was applied to the exposed corneal stromal surface, while intraocular pressure was increased to 50 mmHg 23, 24 to reduce central stromal thickness to 580 μm prior to displacement imaging. The pressure control system consisted of a 500-cc bag of 0.9% normal saline enclosed in a pressurized infusion cusp and connected to the anterior chamber through an in-line pressure transducer. Special care was taken to remove all air from the intravenous tubing connecting the pressure sensor to the saline bag. IOP was monitored continuously with a digital pressure monitor. The pressurized eye was then compressed using a standard clinical gonioscopy lens in contact with most of the anterior surface of the cornea (Fig. 2). Pressure was continuously monitored while the cornea was displaced by the gonioscopy lens in 20-μm intervals for a total of 140 μm of displacement. The displacement was controlled with an electronic computer-controlled microstage (Zaber Technologies Incorporated, TLA-28 Linear Actuator, Vancouver, Canada). The OCT scan parameters were set to oversample the lateral spot size by a factor of 10 to maximize capture of the speckle pattern in the image. The OCT data stream was then processed to extract the 2-D displacement of the cornea across its width and entire thickness. 3.ResultsThe results of the microstage displacement accuracy experiment are presented in Fig. 3. The standard deviations of displacements measured with the tracking algorithm were <0.5 μm, well within the reported positioning tolerance of the micromechanical stage (2 ± μm), and demonstrate a capability for submicron displacement resolution. In this experiment, the resolution was limited by the sampling of the OCT device at 1-μm/pixel, because subpixel tracking methods were not employed. Fig. 3Optically measured versus imposed mechanical displacement of human corneal tissue by a micrometer positioning stage. The stage was accurate to 2±1 μm according to manufacturer specifications. The upper and lower boundaries represent the positioning tolerence of the stage. The error bars on the measured values indicate the standard deviation of the measured displacement.  In experiments with software phantoms, the correlation coefficient and the corresponding displacement accuracy improved with increasing window size and increasing SNR [Figs. 4a, 4b, 4c]. Displacement errors were more common with a correlation coefficient of <0.3 and very rare when the correlation coefficient was >0.7 at an SNR consistent with modern rapid-scanning optical-delay-line or FD OCT systems. In Fig. 4c, displacement error at a correlation of 0.65 was only encountered with a very small window size (3×3), and with the smallest window sizes eliminated from Figs. 4a, 4b, 4c, the first tracking error was encountered at a correlation coefficient of <0.4. A coefficient threshold of 0.6 was chosen as a conservative guideline for tracking accuracy because, at this level of correlation, <5% of all pixels present in the tissue phantom were in error [Fig. 4c]. The magnitude of the error in displacement is unrelated to the threshold at which it occurs. This means that once an error occurs, the estimated position is unrelated to the physical displacement. Fig. 4Software phantom analysis of the effect of SNR and window size on the displacement algorithm correlation coefficient and displacement error. (a) Correlation values increase and (b) average magnitude of the displacement error decreases with increasing kernel size and increasing SNR. The range of SNR values commonly encountered in OCT systems is well within the limits explored here. (c) Scatter plot of number of displacement errors across all window sizes and all noise levels as a function of correlation coefficient. Each noise-level and window-size group consists of 294 total displacement measures.  The strain phantom experiment (Fig. 5) indicated that compressive strain results in a progressive decrease in the corresponding correlation coefficient, even under ideal conditions with no noise present in the successive images. Values of strain ⩾10% resulted in decreased correlation coefficients (<0.6) and could not be distinguished from noise, as described in the previous paragraph. The distortion in the tissue with strains of >10% was sufficient to prevent the algorithm from accurately tracking the displacement. Fig. 5Plot showing the effect of a simulated compressive strain on the resultant correlation coefficient.  Figure 6 demonstrates a rapid falloff in the in-plane, 2-D, cross-correlation coefficient with out-of-plane displacements. Greater sampling density increases the amount of out-of-plane displacement that can be tolerated before the cross-correlation coefficient falls below the threshold described for accurate displacement tracking. An increase in the sampling density from 10 μm (approximately the Nyquist criterion for a spot size of 25 μm) to 1 μm led to a 2-μm (28%) increase in the amount of out-of-plane displacement that can be tolerated before tracking fails (using a 0.6 threshold on the correlation coefficient). Fig. 6Effect of spatial sampling density on the correlation coefficient with known out-of-plane displacements. The sampling referenced refers to the separation between lateral samples in the image. Axial sampling was constant. The sample was not displaced in the direction of the image plane. Displacement tracking was only performed in two dimensions.  In Fig. 7, horizontal (lateral) and vertical (axial) displacement maps in the cornea of a whole human globe are presented for a microstage-controlled axial perturbation of 20 μm. The images were obtained along the vertical corneal meridian: the left side of all three images represents the inferior portion of the central cornea, and the right side represents the superior portion of the central cornea. The use of a known axial displacement provides an internal measure of validity (as the measured displacement in the vertical map approximates 20 μm) and also induces heterogeneous lateral displacements that can be related to local shear resistance. Fig. 7Examples of 2-D displacement maps obtained during a downward axial displacement of the cornea. The raw OCT image is one of the pair of images representing this displacement increment. Horizontal (lateral) displacements are mapped in the central frame, and vertical (axial) displacements are presented in the lower frame. All displacements are expressed in micrometers with the magnitude indicated by the legend. The images were obtained along the vertical corneal meridian: the left side of all three images represents the inferior portion of the central cornea, and the right side represents the superior portion of the central cornea.  Figure 8 shows a map of displacement vectors for a single step in the displacement series, which allows simultaneous visualization of both the magnitude and direction of the displacement. The intraocular pressure increase during this deformation series was <0.5 mmHg. The chart in Fig. 8c illustrates the cumulative 2-D displacements of six anterior and posterior corneal regions of interest measured simultaneously during the same stress sequence and plotted against the vertical (axial) displacement imposed by the lens. The absolute lateral displacements as well as the ratios of lateral to axial deformations (dimensionally analogous to Poisson ratio) differ from region to region within the corneal stroma. The values of the ratio of lateral (independent) to axial (dependent) displacement displayed significant heterogeneity and ranged from 0.12 to 0.40. Fig. 8(a) An image of the cornea taken from a displacement image pair with regions of interest demarcated by squares. The cornea is oriented inferior to superior from left to right. The lateral displacements correspond to displacements in the superior-inferior directions of the vertical meridian (b) A vector map taken from the upper left region shown in (a) and representing anterior corneal stroma. The chart depicts cumulative horizontal displacement versus cumulative vertical displacement, both measured with optical coherence optical feature tracking, of the six regions shown in (a). No less than 275 independent data points were used to calculate the average values shown in (c). 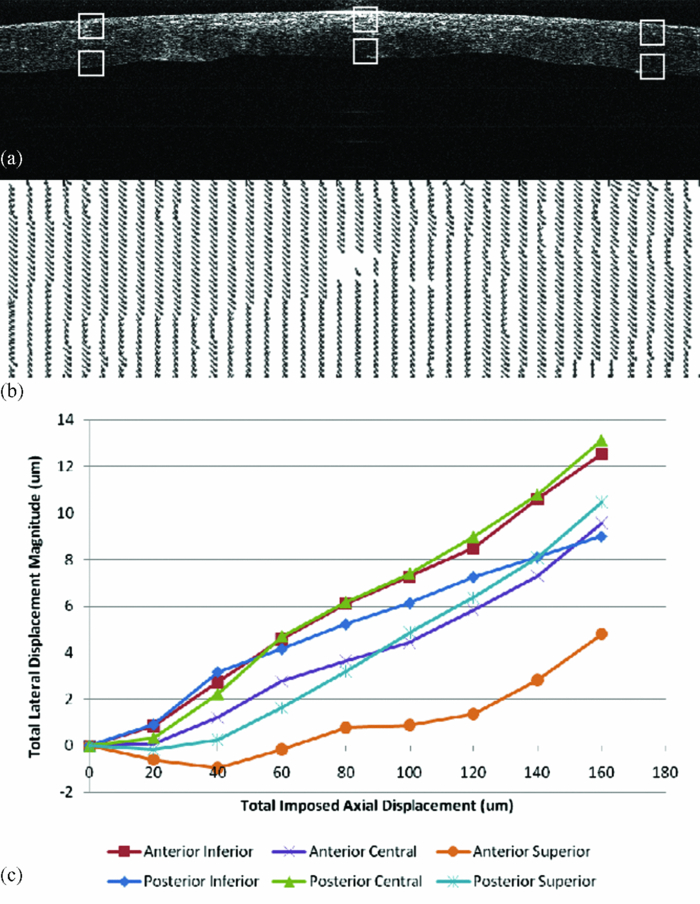 4.Discussion and ConclusionsIn this work, we present 2-D pan-corneal deformation maps that are acquired with no exogenous tissue contrast and with a stressor akin to clinical applanation tonometry or gonioscopy that can be performed without significant increases in IOP. The displacement behavior is resolvable in time, which allows for interrogation of viscoelastic behavior. The validation experiments prove the feasibility of tracking displacement with speckle as a mechanism of contrast and demonstrate displacement accuracy below the 2-μm level with precision to <0.5 μm (Fig. 3). We did not attempt to validate displacements of <2 μm in these experiments. The experiments also demonstrate preliminary guidelines for acceptable levels of correlation value and SNR to ensure accurate displacement tracking and illustrate that, with larger correlation window sizes, excellent tracking accuracy can be achieved with correlations as low as 0.3. Strain values of <10% can be reliably detected; however, there is an inherent penalty to the correlation coefficient with increasing strain values, decreasing SNR, and decreasing window size. More accurate displacement tracking could be achieved with greater oversampling or the use of subpixel displacement tracking algorithms.25 The validation experiments also demonstrate the importance of oversampling to accurate displacement tracking when any out-of-plane motion is expected. Although this can be adequately compensated for in phantom experiments, it is likely to be a critical factor when working with in vivo tissue. The whole globe experiment demonstrates the ability to measure in situ 2-D displacement behavior during an axial perturbation scenario. Although the particular perturbation utilized in this experiment did not generate significant strain heterogeneity in the axial direction, significant heterogeneity was observed in the lateral direction. Figure 8 demonstrates both positive and negative lateral displacements during the first two compression steps, consistent with a decrease in the arc length of the corneal lamellae during initial posterior displacement of the corneal apex. Specifically, the superior corneal regions displace inferiorly and the inferior corneal regions displace superiorly toward the central cornea. This behavior may be related to incomplete contact between the gonioscopy lens and the paracentral cornea early in the compression sequence. The shift toward positive lateral displacements in all corneal regions beyond the second perturbation step may be due to bulk lateral or rotational displacement. This demonstration of the ability to measure depth-dependent and central-to-peripheral corneal differences in directional strain during a complex perturbation has important implications. Similar studies in larger numbers of eyes could be useful for correlating known regional differences in corneal ultrastructure26, 27 to biomechanical behavior and defining normal spatial material property profiles for the cornea. Such maps could provide a normative database for informing the proper development of biological and artificial corneal substitutes and for comparison against property maps characteristic of keratoconus and other ectatic corneal conditions. Specifically, corneal ectasia is thought to involve a failure of interlamellar connectivity that leads to abnormal lateral strain in the form of lamellar slippage.26 The approach described here provides the ability to measure spatial differences in lateral displacement and, therefore, analogs of shear deformation and Poisson's ratio. Such analogs have relevance in early diagnosis of corneal ectatic disease4, 27, 28 and appropriate screening and planning of refractive surgery or keratoconus treatment. The technique affords significant advantages over traditional methods of mechanical testing because it is nondestructive and provides spatial property information at physiological levels of stress without separating ocular tissue from its native mechanical boundary conditions. Furthermore, this technique has excellent potential for in vivo implementation. The demonstrated capability of this approach to resolve very small (submicron) displacement differences in corneal tissue may provide significant sensitivity advantages for earlier detection of ectatic disease, and for discerning normal or pathologic preoperative mechanical anisotropy that is likely to impact the optical response of the cornea to a broad range of corneal surgeries. Our current efforts include the development of 3-D analysis routines and stress sequences for in vivo use and donor eye experiments aimed at characterizing spatially resolved elastic and viscoelastic behavior in normal and biomechanically altered corneas. Our displacement phantom experiments show that even minor out-of-plane motion significantly degrades the 2-D correlation algorithm's ability to track the tissue. Significant oversampling can help to moderate this effect, but a 3-D algorithm is expected to improve correlations while providing more complete information for the characterization of mechanical behavior in full 3-D space. AcknowledgmentsThe authors thank David Johnson for technical help and advice. This work was supported in part by the NIH Visual Sciences Resource Center (CWRU) P30 Core Grant No. EY11373, NIH Visual Sciences Training Program Grant No. T32 EY07157 (CWRU), a Cleveland Clinic Innovations grant, a Research to Prevent Blindness Challenge Grant to the Department of Ophthalmology, Cleveland Clinic Lerner College of Medicine, an Unrestricted Grant from Research to Prevent Blindness to the Department of Ophthalmology, Cleveland Clinic Lerner College of Medicine, and Grant No. NIH L30EY017803. The work was also supported in part by the Case Western Reserve University/Cleveland Clinic CTSA Grant No. UL1 RR024989 from the National Center for Research Resources (NCRR), a component of the National Institutes of Health and NIH roadmap for Medical Research. W.J.D. is a scholar in the CTSA KL2 grant program and a recipient of a Research to Prevent Blindness Career Development Award. ReferencesA. E. Al-Towerki, S. Gonnah el, A. Al-Rajhi, and
M. D. Wagoner,
“Changing indications for corneal transplantation at the King Khaled Eye Specialist Hospital (1983–2002),”
Cornea, 23
(6), 584
–588
(2004). https://doi.org/10.1097/01.ico.0000121708.58571.5b Google Scholar
P. C. Kang, G. K. Klintworth, T. Kim, A. N. Carlson, R. Adelman, S. Stinnett, and
N. A. Afshari,
“Trends in the indications for penetrating keratoplasty, 1980–2001,”
Cornea, 24
(7), 801
–803
(2005). https://doi.org/10.1097/01.ico.0000157407.43699.22 Google Scholar
I. G. Pallikaris, G. D. Kymionis, and
N. I. Astyrakakis,
“Corneal ectasia induced by laser in situ keratomileusis,”
J. Cataract Refract. Surg., 27
(11), 1796
–1802
(2001). https://doi.org/10.1016/S0886-3350(01)01090-2 Google Scholar
W. J. Dupps Jr.,
“Biomechanical modeling of corneal ectasia,”
J. Refract. Surg., 21
(2), 186
–190
(2005). Google Scholar
T. T. Andreassen, A. H. Simonsen, and
H. Oxlund,
“Biomechanical properties of keratoconus and normal corneas,”
Exp. Eye Res., 31
(4), 435
–441
(1980). https://doi.org/10.1016/S0014-4835(80)80027-3 Google Scholar
A. Guirao,
“Theoretical elastic response of the cornea to refractive surgery: risk factors for keratectasia,”
J. Refract. Surg., 21
(2), 176
–185
(2005). Google Scholar
W. J. Dupps Jr. and C. Roberts,
“Effect of acute biomechanical changes on corneal curvature after photokeratectomy,”
J. Refract. Surg., 17
(6), 658
–669
(2001). Google Scholar
C. Roberts,
“The cornea is not a piece of plastic,”
J. Refract. Surg., 16
(4), 407
–413
(2000). Google Scholar
A. Sinha Roy, W. J. Dupps Jr.,
“Effects of altered corneal stiffness on native and post-LASIK corneal biomechanical behavior: a whole-eye finite element analysis,”
J. Refract. Surg., 25
(10), 875
–887
(2009). Google Scholar
M. R. Bryant and
P. J. McDonnell,
“Constitutive laws for biomechanical modeling of refractive surgery,”
J. Biomechan. Eng., 118
(4), 473
–481
(1996). https://doi.org/10.1115/1.2796033 Google Scholar
Y. C. Fung, Biomechanics: Mechanical Properties of Living Tissues, Springer, New York
(1993). Google Scholar
J. Liu and
C. J. Roberts,
“Influence of corneal biomechanical properties on intraocular pressure measurement: quantitative analysis,”
J. Cataract Refract. Surg., 31
(1), 146
–155
(2005). https://doi.org/10.1016/j.jcrs.2004.09.031 Google Scholar
J. Ophir, I. Cespedes, H. Ponnekanti, Y. Yazdi, and
X. Li,
“Elastography: a quantitative method for imaging the elasticity of biological tissues,”
Ultrason. Imaging, 13
(2), 111
–134
(1991). https://doi.org/10.1016/0161-7346(91)90079-W Google Scholar
K. W. Hollman, S. Y. Emelianov, J. H. Neiss, G. Jotyan, G. J. Spooner, T. Juhasz, R. M. Kurtz, and
M. O’Donnell,
“Strain imaging of corneal tissue with an ultrasound elasticity microscope,”
Cornea, 21
(1), 68
–73
(2002). https://doi.org/10.1097/00003226-200201000-00015 Google Scholar
J. M. Schmitt,
“OCT elastography: imaging microscopic deformation and strain of tissue,”
Opt. Express, 3
(6), 199
–211
(1998). https://doi.org/10.1364/OE.3.000199 Google Scholar
J. Rogowska, N. A. Patel, J. G. Fujimoto, and
M. E. Brezinski,
“Optical coherence tomographic elastography technique for measuring deformation and strain of atherosclerotic tissues,”
Heart (Br. Cardiac Soc.), 90
(5), 556
–562
(2004). Google Scholar
M. H. D. l. Torre-Ibarra, P. D. Ruiz, and
J. M. Huntley,
“Double-shot depth-resolved displacement field measurement using phase-contrast spectral optical coherence tomography,”
Opt. Express, 14
(21), 9643
–9656
(2006). https://doi.org/10.1364/OE.14.009643 Google Scholar
W. J. Dupps Jr., M. V. Netto, S. Herekar, and
R. R. Krueger,
“Surface wave elastometry of the cornea in porcine and human donor eyes,”
J. Refract. Surg., 23
(1), 66
–75
(2007). Google Scholar
D. A. Luce,
“Determining in vivo biomechanical properties of the cornea with an ocular response analyzer,”
J. Cataract Refract. Surg., 31
(1), 156
–162
(2005). https://doi.org/10.1016/j.jcrs.2004.10.044 Google Scholar
J. Barton and
S. Stromski,
“Flow measurement without phase information in optical coherence tomography images,”
Opt. Express, 13
(14), 5234
–5239
(2005). https://doi.org/10.1364/OPEX.13.005234 Google Scholar
S. J. Kirkpatrick, R. K. Wang, and
D. D. Duncan,
“OCT-based elastography for large and small deformations,”
Opt. Express, 14
(24), 11585
–11597
(2006). https://doi.org/10.1364/OE.14.011585 Google Scholar
M. Choma, M. Sarunic, C. Yang, and
J. Izatt,
“Sensitivity advantage of swept source and Fourier domain optical coherence tomography,”
Opt. Express, 11
(18), 2183
–2189
(2003). https://doi.org/10.1364/OE.11.002183 Google Scholar
R. J. Duffey, H. Tchah, and
R. L. Lindstrom,
“Human cadaver corneal thinning for experimental refractive surgery,”
Refract. Corneal Surg., 5
(1), 41
–42
(1989). Google Scholar
M. A. Terry, P. J. Ousley, and
M. L. Zhjra,
“Hydration changes in cadaver eyes preparedfor practice and experimental surgery,”
Arch. Ophthalmol., 112 538
–543
(1994). Google Scholar
S. J. Kirkpatrick, R. K. Wang, and
D. D. Duncan,
“OCT-based elastrography for large and small deformations,”
Opt. Express, 14
(24), 11585
–11597
(2006). https://doi.org/10.1364/OE.14.011585 Google Scholar
J. B. Randleman, D. G. Dawson, H. E. Grossniklaus, B. E. McCarey, and
H. F. Edelhauser,
“Depth-dependent cohesive tensile strength in human donor corneas: implications for refractive surgery,”
J. Refract. Surg., 24
(1), S85
–89
(2008). Google Scholar
D. G. Dawson, J. B. Randleman, H. E. Grossniklaus, T. P. O’Brien, S. R. Dubovy, I. Schmack, R. D. Stulting, and
H. F. Edelhauser,
“Corneal ectasia after excimer laser keratorefractive surgery: histopathology, ultrastructure, and pathophysiology,”
Ophthalmology, 115
(12), 2181
–2191
(2008). https://doi.org/10.1016/j.ophtha.2008.06.008 Google Scholar
K. M. Meek, S. J. Tuft, Y. Huang, P. S. Gill, S. Hayes, R. H. Newton, and
A. J. Bron,
“Changes in collagen orientation and distribution in keratoconus corneas,”
Invest. Ophthalmol. Vis. Sci., 46
(6), 1948
–1956
(2005). https://doi.org/10.1167/iovs.04-1253 Google Scholar
|


