
|
|
1.IntroductionOne of the most attractive features of coherent anti-Stokes Raman scattering (CARS) microscopy is the ability to generate images based on vibrational contrast with image acquisition rates that are comparable to the frame rates of a laser scanning fluorescence microscope. This principle is most clearly implemented in picosecond CARS microscopy, where the contrast in the image is typically derived from a narrow region in the Raman spectrum of the target compound.1, 2 In case the molecular target can be addressed through a strong and isolated Raman band, picosecond CARS microscopy offers chemically selective imaging at video rate acquisition times.3 The visualization of lipids through the symmetric CH2 stretching vibrational mode is a successful example of this approach, which has been applied to a variety of biomedical imaging studies, including the visualization of myelin in neurodegenerative diseases,4, 5 lipid accumulation in atherosclerosis,6, 7, 8 and the role of lipids in metabolic processes.9, 10, 11 Whereas the picosecond CARS implementation has been particularly successful, it has also been recognized that much of the spectral information accessible with a Raman sensitive probing interaction is not utilized in the narrowband CARS excitation scheme. Broadband CARS schemes address this issue by recording a much wider segment of the Raman spectrum. In the broadband approach, the desired spectral information is attained by either resolving the broadband anti-Stokes signal on a CCD-based spectrometer12, 13, 14, 15 or by Fourier transforming the time-resolved anti-Stokes response.16, 17 The CARS signal yield is typically high enough to record CARS spectra over several hundreds of wave numbers with acquisition times that can be two orders of magnitude faster than what can be achieved with a spontaneous Raman microspectrometer.18 The broadband CARS strategy has been successfully applied to studies in which rapid acquisition of vibrational spectra is required. Examples of such studies include the characterization of atherosclerotic plaques,7 dynamic mapping of lipid phase transitions,19 and the study of chemical reactions in microfluidic devices.20, 21 However, in many biomedical imaging studies of tissue specimens, rapid scanning is the preferred mode of operation as large areas (millimeters) need to be examined with high spatial resolution (sub-micrometer). For these particular studies, a loss of spectral information is compensated by a much higher information density in the spatial domain, and picosecond CARS microscopy is a sensible choice. As shown by Slipchenko, the rapidly generated ps-CARS images can provide the spatial information needed for a deeper chemical analysis with spontaneous Raman spectroscopic examination at selected points in the CARS image.22 Indeed, in many tissue imaging studies, rapid spatial mapping of a narrowband CARS signal combined with point selective vibrational microspectroscopy may provide sufficient information to enable a reliable biomedical assessment. Other studies, however, would benefit from high-density spatial mapping with expanded spectral information for each pixel. In the present work, we are interested in characterizing the lipid distribution in meibomian glands. The meibomian gland is a structure found in the eyelid that produces meibum lipids, which are believed to be the major source of lipids that constitute the tear film on the ocular surface.23 Meibum lipid is synthesized by meibocytes, which form cell clusters, called acini, in the peripheral parts of the gland. Meibum mainly consists of wax esters (44%), sterol esters (33%), and phospholipids (8%).23 As meibocytes migrate towards the central portion of the gland, the intracellular lipid droplets mature and, upon acinar cell degeneration, the meibum lipids eventually merge in the ductules and form large lipid pools within the central duct.24 The meibum is subsequently secreted onto the ocular surface through the gland orifice. Although dysfunction of the meibomian gland is the major cause of evaporative dry eye disease,25 relatively little is known about the underlying changes in gland structure and lipid composition as a function of progression of the disease. Mass spectrometry and liquid chromatography measurements on extracted meibum have provided evidence for changes in the meibum lipid composition of patients with dry eye disease.26 Such differences have also been observed in infrared absorption and Raman spectroscopic studies of extracted meibum samples.27, 28 While these studies confirm the relation between meibomian gland dysfunction and an altered composition of the lipid tear film, they provide no information on how the compositional changes of meibum lipids correlate with the structure of the gland. To establish such a correlation, chemical maps of intact meibomian glands with sufficient selectivity to discriminate several lipid constituents are desirable. In assessing meibomian gland structure, high-density spatial mapping is required to detect the individual lipid droplets of the acinus, as well as the larger lipid pools in the duct. At the same time, discrimination between different lipid species is important, which necessitates the acquisition of spectral information for each pixel in the image. In this work we show that picosecond CARS imaging combined with signal acquisition over a limited spectral range is a simple approach that meets these imaging requirements. In this approach, which is an alternative to the broadband CARS imaging technique, high-density CARS spatial maps are recorded consecutively for Raman shifts with a spectral resolution defined by the spectral width of the piscosecond laser pulses (∼5 cm−1). The resulting data set consists of a spectral dimension in addition to two spatial coordinates (x,y,ω). Whereas the spectral range examined is limited to ∼200 cm−1 in the CH stretching vibrational range, we show that sufficient spectral contrast can be achieved to observe compositional variations in the meibomian gland lipids. To improve the chemical contrast contained in the data set, we have explored the use of the principal component analysis (PCA) method for CARS spectral imaging. The PCA is a multivariate analysis tool that expresses the original spectral data in terms of several principal components, which describe the most significant variance within the data set.29 PCA methods are capable of distinguishing small spectral differences among spectra and have been successfully applied for improving the chemometric analysis of Raman spectral data sets.30, 31, 32 Recently, a PCA approach has been successfully used to distinguish between the extracted meibum from patients with gland dysfunctional and meibum obtained from patients with normal glands based on differences in the vibrational spectrum.33 Here, we illustrate that a principal component analysis also improves the chemical contrast contained in CARS spectral data sets, even when the spectral range is limited to a few hundred wave numbers. We apply the picosecond spectral CARS imaging approach with PCA to identify changes in the lipid composition in the meibomian gland. We use Raman microspectroscopic analysis to verify the sensitivity of this combined CARS/PCA method and we draw general conclusions regarding the utility of this imaging technique. 2.Materials and Methods2.1.Tissue SamplesEyelids from 24 month-old mice were excised and fixed in 2% paraformaldehyde in phosphate buffered (PBS) saline. Tissue was then embedded in optical cutting temperature (OCT) medium, snap frozen in liquid nitrogen and 25 μm thick sections cut using a Leica CM1850 Crytotome (Leica, Wetzlar, Germany). Tissue sections were placed on a glass microscope slides, immersed in PBS, covered with a No. 1 borosilicate coverslip, and sealed with epoxy glue. Experiments were performed at room temperature. Since the purpose of this study is to determine the presence of lipid changes in the gland structure, we have chosen to work with sectioned tissue samples that enable optimized imaging conditions. We note that, in principle, CARS imaging can be extended to examining fresh tissue and, with proper signal acquisition speeds, to studying tissue in vivo as well. The wax esters stearyl stearate, behenyl stearate, palmityl palmitate, and the cholesterol esters cholesteryl linoleate, cholesteryl linolelaidate, cholesteryl stearate were purchased from Sigma-Aldrich and were used without further purification. A wax ester mixture was made by mixing the three wax esters in a 1:1:1 ratio. A similar 1:1:1 mixture was made with the cholesterol esters. These mixtures were used in Raman measurements to gain insight in the main vibrational signatures of wax esters and cholesterol esters. 2.2.CARS MicroscopyMultimodal CARS microscopy was carried out on a modified inverted confocal microscope (Fluoview 300, Olympus). The lightsource consisted of an optical parametric oscillator (Levante Emerald OPO, APE, Berlin) pumped by the second harmonic of a Nd:vanadate picosecond mode-locked laser (PicoTrain, High-Q), which provided the pump (780 nm – 830 nm) and Stokes (1064 nm) beams for the CARS excitation process. The collinearly combined pump and Stokes beams were focused by a dry 20x, 0.70 NA objective lens (UplanSApo, Olympus) onto the sample. The CARS focal volume of this lens measures ∼0.5 μm laterally and ∼3.5 μm axially. CARS signals were registered in both the forward and epi-direction, filtered with two bandpass filters (650 nm, 40 nm bandwidth, Chroma) and detected with a photomultiplier tube (R3896, Hamamatsu) positioned in both the forward and epi-direction. Average power at the sample is less than 15 mW per beam and pixel dwell times were 4 μs. CARS images were typically averaged three times. A third photomultiplier tube detector in the epi-direction was used to monitor the pump induced SHG radiation. A dichroic filter (550 nm longpass filter, Semrock) and a bandpass filter (400 nm, 40 nm bandwidth, Thorlabs) were used to separate the SHG signal from the CARS radiation. CARS spectral scanning was accomplished by scanning the wavelength of the OPO. Wavelength scanning is achieved by tuning the temperature of the periodically poled potassium titanyl phosphate crystal and adjusting the etalon setting. The results presented in this work were acquired by manually scanning the OPO. By tuning from high to low temperatures while keeping the power constant, the time separation between the acquisition of two subsequent images in the spectral scan was 10–20 sec. For each wavelength setting, a CARS image was taken, generating a three-dimensional data stack (x,y,ω). These data stacks were typically of dimension 512×512×50. The resulting data stacks were used for subsequent multivariate analysis. We verified that, at constant incident excitation power, the spectral dependence contained in the images is independent of the direction of the spectral scan. In addition, no sample damage was observed after completion of the spectral data stack acquisition. 2.3.Raman MicrospectroscopyA frequency doubled Nd:vanadate laser (Verdi V5, Coherent) was used for Raman excitation at 532 nm. The laser light was coupled into the multimodal CARS microscope through the backport of the microscope frame (IX71 Olympus), and focused by the same objective lens. Average power at the sample was ∼5 mW. Epi-scattered light was directed to a holographic notch filter, spatially filtered and passed to a spectrometer (Shamrock, Andor) equipped with a CCD camera (iDus, Andor). The size of the Raman probing volume was ∼0.5 μm in the lateral dimension and ∼5 μm in the axial dimension. Switching between the CARS and Raman detection mode involved a simple turn of the carrousel. A spin cast rhodamine 6G layer on a coverslip was used to determine the spatial correlation between the galvanometric mirror pair and the Raman probing volume. To this end, the rhodamine layer was exposed to 532 nm excitation light to introduce a photo-bleached spot in the film. The spot was subsequently imaged through two-photon excited fluorescence induced by the mirror-scanned pump beam. The location of the photobleached spot corresponds to the location Raman probing volume, which was correlated with a precision of 0.5 μm to the position of the CARS excitation beams. Any position in the CARS image could be moved within the Raman probing volume with sub-micrometer precision. 2.4.Principal Component AnalysisPrincipal component analysis (PCA) was used as an established multivariate data analysis method to extract information from the CARS images based on the variation among the CARS spectra. PCA is an unsupervised method that is well suited to distinguish recurring variations in a spectral data set. In the PCA method, the original data is expressed in a basis set that is based on the variance contained in the data.34 The elements of this new set are called the principal components. Because there is typically a significant amount of repeated information in the spectral images, the data set can be satisfactorily described in terms of only a few principal components. Thus, the PCA reduces the multidimensional space spanned by the original N = xy spectral vectors, where x and y are the number of image pixels in the lateral dimensions, respectively, into a manageable set of principal components that describe the main spectral variances. The datasets (x,y,ω) can be expressed as a single matrix, Y, with N-rows and s-columns. Each column corresponds to pixel intensities for measurement taken at distinct wavenumbers, whereas the spatial coordinate is unfolded into a single axis coordinate system. In our case, Y consists of 262,144 rows and 50 columns, representing 262,144 data points and its associated intensities at 50 different wavenumbers, respectively. Y is centered by subtracting the mean intensity for each column from the pixel intensities. Eigenvectors (V) and eigenvalues (D) are then computed by using MATLAB's Singular Value Decomposition built in function, SVD. The order of the eigenvectors is arranged so that the magnitude of the associated eigenvalue, which is proportional to the variance, is in decreasing order. Subsequently, the principal components matrix (Z) can be calculated from Z = Y V. In this study, the first three principal components exhibited most of the variance in the measurement. The Z and V matrices can be truncated based on the selected principle components (p); in our case Z p had dimensions 262,144 × 3 and V p has dimensions 50×3. The reconstructed spectra, S, were then calculated as S = Zp Vp T followed by adding the mean intensity to each pixel that was subtracted earlier from the original datasets. The resulting projected data, Z, is utilized to generate the RGB color map in the original coordinate system. The color map is particularly useful to group underlying spectra because different colors highlight the contribution(s) from particular principal component(s). The spectra for each color shown in the score map were constructed by averaging spectra for pixels represented by the same color; the spectra were normalized to the maximum average intensity. Computation was performed in MATLAB. 3.Results3.1.CARS Microscopy of Meibomian Gland LipidsFigure 1 shows representative CARS images of the lipid distribution in the meibomain gland. For these experiments, the Raman shift was tuned to the symmetric CH2 stretching vibration at 2845 cm−1. The CARS contrast resolves the major structural components of the gland. In Fig. 1a, a sagittal section along the long axis of the gland structure is shown. The meibocytes in the acini clusters can be clearly recognized at peripheral regions in the gland. A punctuate pattern is seen in the cytosolic space of the meibocytes, which corresponds to micrometer sized lipid droplets. Towards the center of the gland, the lipid droplet pattern becomes more diffuse and the cell nuclei become less distinct. This region of cellular degeneration is known as the ductule. Several ductules converge into the central duct of the gland, which exhibits a complete loss of cellular structure at the expense of an agglomerated pool of meibum lipid. Fig. 1CARS images of the lipid distrubution in the meibomian gland of a 24 month old mouse. Raman shift was set to 2845 cm−1. (a) Sagittal cross section of the meibomian gland showing the acini clusters (ac), the converging ductules (dt) and part of the central duct (dc). (b) Transversal cross section of the meibomian gland. Scale bar is 50 mm.  Figure 1b shows a transverse cut through the gland. It can be clearly seen that the peripheral acini surround the region of the central duct. Figure 2a shows an acinus cluster. Individual meibocytes can be clearly distinguished. In addition, the larger intracellular droplets (>1 μm) can be sufficiently resolved, which enables a droplet specific analysis. The acini are separated by a collagen matrix, as shown in Fig. 2b, whereas no collagen fibers are seen inside the acini. 3.2.Raman Spectroscopy of Duct and Acini LipidsTo investigate tentative differences in the lipid composition throughout the gland structure, we have performed Raman microspectroscopic measurements at selected locations in the gland. The locations for the Raman point measurements were determined from the CARS images generated on the same platform. Figure 3a shows the Raman spectrum in the CH stretching range measured in the lipid regions of the acini. The spectrum shown is the average of multiple point measurements (n = 10). In Fig. 3b, the spectrum attained from the central duct is shown. Although the lipid spectra of the duct and the acinus are nearly identical, the acinus spectrum exhibits additional spectral components in the ∼2940 cm−1 range, as seen in the difference spectrum depicted in Fig. 3c. The residual spectrum indicates either that there are differences in the lipid composition of the duct and the acini or that there are additional cellular components probed in the acini. Because the Raman probing volume is larger than individual lipid droplets, spectral components from intracellular material other than lipid droplets may contribute to the spectrum. In the duct, on the other hand, the lipid pool is much larger than the probing volume, which excludes spectral contributions from tissue components other than the meibum lipids. It is instructive to compare the meibum Raman spectrum with the spectra of several of its major constituents. The spectrum of the wax ester mixture and cholesterol ester mixture is shown in Figs. 4a and 4b, respectively. The wax ester spectrum is characterized by two relatively sharp peaks, which correspond to CH2 stretching vibrations at 2846 cm−1 and at 2886 cm−1.35 Figure 4c shows the sum of the two spectra. Although the resulting spectrum does not necessarily reflect the exact composition of meibum, the major features of the meibum lipid Raman spectrum are relatively well reproduced. Fig. 4(a) Raman spectrum of a 1:1:1 wax ester mixture of stearyl stearate, behenyl stearate, and palmityl palmitate. (b) Raman spectrum of a 1:1:1 cholesterol ester mixture of cholesteryl linoleate, cholesteryl linolelaidate, and cholesteryl stearate. (c) Normalized sum of spectrum (a) and spectrum (b).  Figures 5a and 5b show the Raman spectra of the duct and the acinus in the fingerprint region, respectively. For comparison, the spectra of the wax ester mixture and the cholesterol ester mixture are given in Figs. 5c and 5d, respectively. The main spectral signatures of the duct lipids are also seen in the acinus spectrum, indicating that the acinus spectrum is dominated by lipids with limited contributions from other cellular material. In particular, no residual contribution from the amide I vibration near 1650 cm−1 is seen in the acinus spectrum, providing evidence that protein spectral components contribute very little to the spectrum. A weak, yet narrow, spectral component at 1585 cm−1 is seen in the acinus spectrum that is absent in the lipid spectrum of the duct. Fig. 5Raman spectral point measurements in the meibomian gland in the fingerprint vibrational range. (a) Spectrum measured in the central duct. (b) Spectrum measured in the lipid regions of the acinus. Spectra were obtained by averaging 10 point-measurements at different locations in either the acinus or the central duct. (c) Spectrum of the wax ester mixture [as in Fig. 4(a)]. (d) Spectrum of the cholesterol ester mixture [as in Fig. 4(b)]. 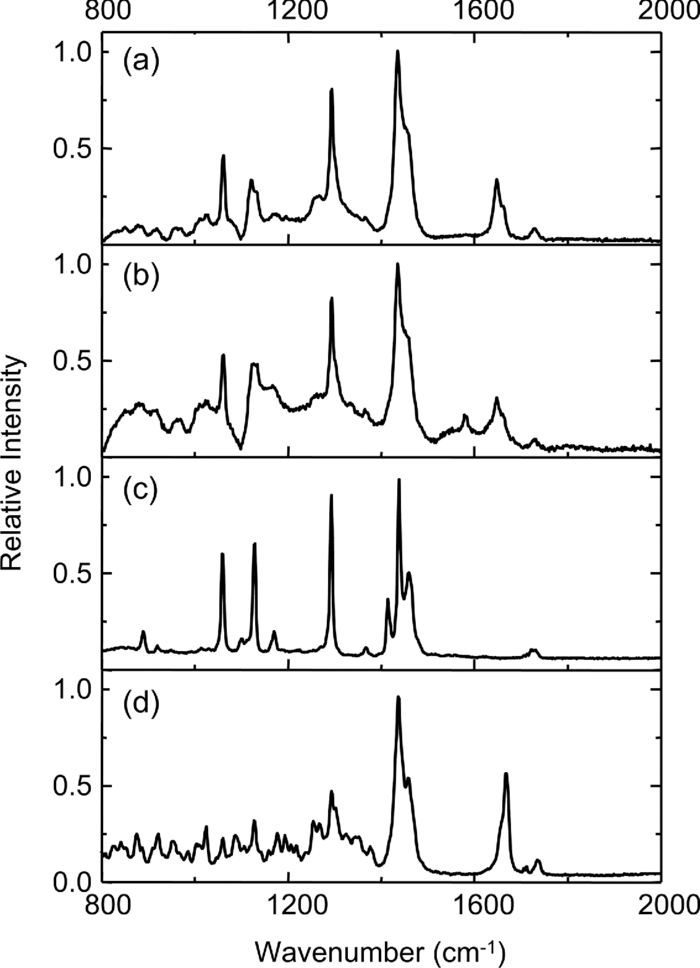 Comparing the duct and acini Raman spectra, it can be concluded that the acinus spectrum is dominated by contributions from lipids. Small yet clear differences are seen in the lipid spectra measured in the two regions, as evidenced by the additional components at 2940 cm−1 and 1585 cm−1 in the acinus spectrum. Since spectral differences are observed in both the fingerprint as well as in the CH stretching range of the vibrational spectrum, both regions of the spectrum qualify for CARS spectral scanning experiments. Since the expected vibrational contract relative to nonresonant background contributions is highest in the CH stretching region, we have chosen to perform CARS spectral scans in this higher energy range of the vibrational spectrum. 3.3.CARS Spectral Imaging of Lipid DistributionCARS spectral imaging enables an improved chemical analysis of lipid CARS images. In Fig. 6a, an area of the meibomian gland is visualized that comprises both acini clusters and the central duct. A spectral image was generated by scanning the Raman shift from 2790 cm−1 to 3070 cm−1 in approximately 6 cm−1 steps. The spectral content of the areas marked in Fig. 6a are plotted in Figs. 6b and 6c. A characteristic CARS lipid spectrum is observed in the regions of the acini and the central duct. A comparison of the acini and duct spectra reveals a higher spectral density in the 2900 cm−1 region of the acini spectrum, which is largely in line with the differences observed in the Raman spectra of the corresponding areas (Fig. 3). Note that the 2886 cm−1 band of the Raman meibum spectra [Figs. 3a and 3b] is not clearly seen in the CARS spectrum as a result of spectral interferences with the nonresonant electronic background. Fig. 3Raman spectral point measurements in the meibomian gland in the CH2 stretching vibrational range. (a) Spectrum measured in the lipid regions of the acinus. (b) Spectrum measured in central duct. (c) Difference spectrum (acinus-central duct). Spectra were obtained by averaging 10 point-measurements at different locations in either the acinus or the central duct.  Figure 6c shows the spectrum attained from the tissue matrix that surrounds the gland. The spectrum lacks the characteristic CH2 stretching component of lipids, and peaks around 2900 cm−1. This signature is reminiscent of CH stretching vibrations of protein structures, which is expected for a tissue region with a high concentration of structural protein. The rise of the spectrum beyond 3000 cm−1 can be attributed to the red tail of the OH stretching vibration of water. While insightful, the examination of a few selected regions does not do justice to the richness of information contained in the spectral CARS image. To more efficiently portray the spectral variation of the image, a multivariate analysis can be performed. In the following section we explore the use of a principal component analysis to classify the major spectral features within the CARS image. 3.4.Principal Component AnalysisFigure 7a shows the score map composed of the first three principle components. The score map assigns a color to each pixel based on the score of each principle component (PC) at the pixel location. The PCA clearly identifies different regions in the spectral image. The extracellular matrix (magenta) is separated from the lipid rich regions of the acini and duct. The acinus (yellow) is spectrally discriminated from the areas of the ductule and central duct. Furthermore, within the ductal regions of the gland, two lipid populations are recognized based on their mutual spectral variance. Fig. 7Principal component analysis of the CARS spectral data stack shown in Fig. 6. (a) Score map of the first three principal components, represented in RGB colors. Scale bar is 50 μm. (b) Reconstructed averaged CARS spectra from the black (solid circles), cyan (open circles), and yellow (open triangles) lipid-rich regions of the score map. Spectra are offset for clarity. (c) Reconstructed averaged spectrum of the magenta colored region of the score map. Spectra are reconstructed using the first three principal components (p = 3).  The spectra associated with the main regions identified in Fig. 7a are given in Figs. 7b and 7c. These spectra were reconstructed using only the first three principal components. Figure 7b shows the averaged lipid spectra of the yellow, black, and cyan regions of the image. The spectra show much similarity to the extracted CARS spectra shown in Fig. 6b, indicating that the spectral reconstruction faithfully reproduces the main spectral signatures. The reconstructed spectra show small spectral differences among the different lipid-rich areas, which possibly reflect changes in the lipid composition within the gland structure. Figure 7c depicts the reconstructed spectrum of the tissue matrix, which shows much resemblance to the CARS spectrum shown in Fig. 6c. 4.DiscussionIn this work we have implemented picosecond CARS microscopy as a spectral imaging tool. By expanding the CARS images in the spectral dimension, better discrimination is achieved between the chemical components that contribute to the image. The spectral dimension is examined over a moderate range (∼200 cm−1) by scanning the frequency difference between the pump and Stokes picosecond laser beams. In this case, the high-speed acquisition of individual CARS images in the picosecond mode translates into a relative rapid generation of spectral data sets. In the current implementation, the fastest scanning of the Raman shift that could be achieved was ∼10 s between consecutive frames. Due to manual inconsistencies, the actual acquisition time for a 512×512×50 spectral stack presented in this study was about 30 minutes. This translates into an effective spectral acquisition time of ∼8 ms per pixel. For comparison, reported spectral acquisition times for each pixel in representative broadband CARS studies are in the 17–50 ms range.36, 37 Importantly, the scanning operation in this study is far from optimum and can be significantly sped up by automated scanning. Additional improvements can be envisioned when the frequency of the laser beams is rapidly swept in a periodic fashion. This would enable the generation of spectral CARS data within a matter of minutes, with sub-ms spectral acquisition times per pixel. Therefore, the narrowband spectral imaging approach constitutes an attractive alternative to broadband CARS methods, which currently require longer acquisition times for generating a spectral data set of similar spatial dimensions. The picosecond CARS approach explored here improves the total signal acquisition time by reducing the information along the frequency dimension while preserving the high-density information in the spatial domain. This strategy is particularly useful when the spectral variation in the data set is slowly varying as a function of frequency, which allows a coarser sampling of the frequency axis. These conditions are met in the CH stretching region of the Raman spectrum, where spectral features are relatively broad. This study shows that a straightforward implementation of CARS spectral imaging significantly improves the image information content. A simple inspection of the spectral data, as shown in Fig. 6, enables a direct discrimination between tissue components. For example, based on their spectral content, the lipid regions are easily separated from the structural proteins of the tissue matrix. The power of a spectral decomposition of the CARS image was recently pointed out and experimentally demonstrated.38, 39 Whereas the differences between lipid and protein spectra are substantial, the data set also contains spectral variations that are less dramatic, yet chemically meaningful. Differences in lipid composition, for instance, are manifested by relatively subtle spectral variations that may not be easily differentiated with a direct decomposition of the spectra. Multivariate analysis tools are well suited to address this problem of extracting meaningful spectral differences from the data set. In this work, we have used the PCA method to decompose the CARS spectral image into major spectral classes based on variance within the data set. Despite the relatively narrow spectral window and the broad spectral features in the CH stretching range, the PCA provides sufficient contrast for discriminating distinct regions within the meibomian gland. Fig. 6CARS spectral imaging of the meibomian gland. (a) Image of the spectral data stack for the Raman shift 2845 cm−1. Scale bar is 50 μm. (b) Spectral projections of the lipid-rich areas 1 (duct; open circles) and 2 (acinus; solid circles) encircled in (a). (c) Spectral projection of the encircled area 3 in (a), corresponding to the extracellular matrix. The solid lines are a guide to the eye. 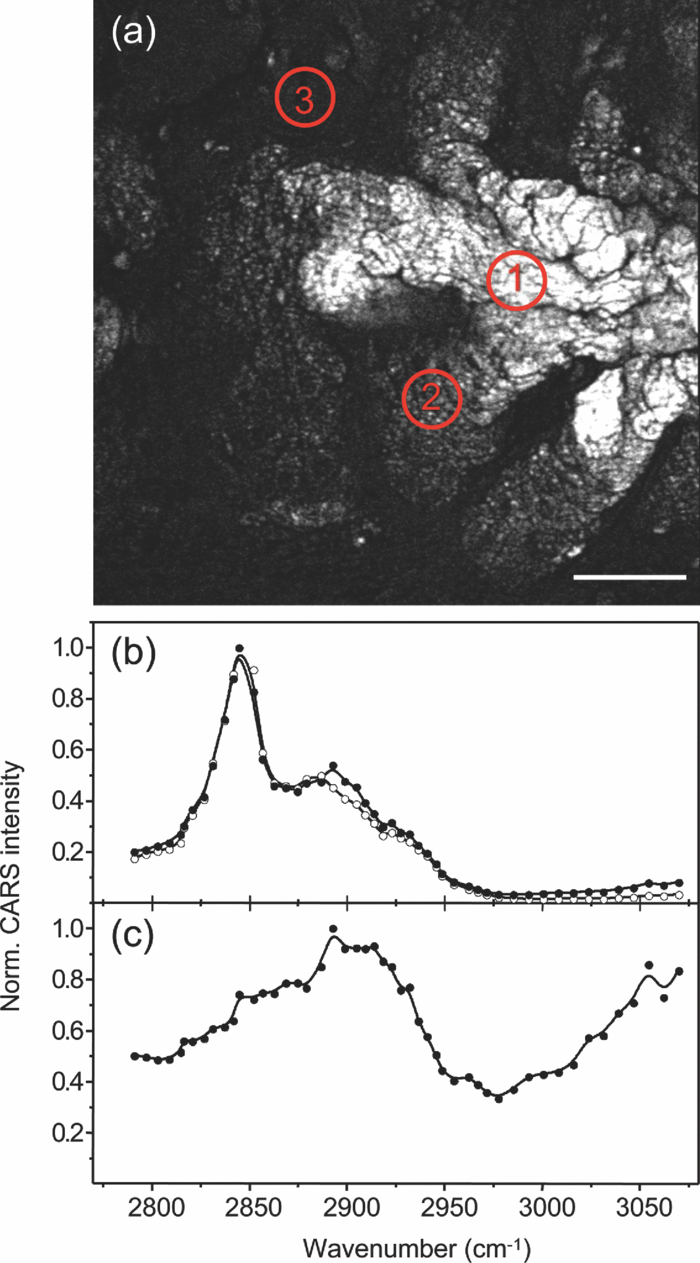 Multivariate analysis has been shown to be a powerful approach in Raman microscopy, which was shown to be particularly successful in discriminating intracellular compartments based on spectral differences. The major advantage of using CARS over Raman microscopy is the much improved signal acquisition time. To generate an image of 512×512 pixels in a Raman microscope would take multiple hours, which is generally impractical when large tissue areas need to be examined. However, compared to a PCA performed on Raman data sets, the discriminatory power of a PCA applied to CARS data may be limited. This is because the examined spectral window is narrow and the CARS spectral features are broadened relative to the Raman signatures. In addition, the nonresonant background may vary from point-to-point and can contribute to different spectral variations by mixing with the vibrationally resonant response. The variance in the data set may thus by influenced by a spatially varying nonresonant background. Consequently, while the vibrational contrast is the primary source of spectral variation, the different regions identified in the PCA score map may also contain different relative contributions from the nonresonant background. Because of these differences, the PCA results obtained from the CARS spectral data cannot be directly equated to a PCA of a Raman microscopy spectral data set. In principle, spectral profiles proportional to Raman spectral signatures can be attained when using a phase retrieval method, which eliminates most of the differences between Raman and CARS spectral data sets.40, 41 It should be noted that although the frequency axis in picosecond spectral CARS imaging contains only a fraction of the number of points collected in Raman spectral data sets (typically 1024), the number of CARS spectra in the data set (512×512) is considerably larger than what is commonly collected in Raman microscopy studies. Consequently, the repeatability in the data set is large, which improves the quality of the spectral separation based on variance. The score map generated by the PCA and presented in Fig. 7a provides a very intuitive interpretation of the CARS image of the meibomian gland. Not only is the extracellular matrix separated from the gland structure, within the gland the different functional units of the acinus and the duct are spectrally discriminated as well. It can be noticeably perceived that the spectrum of the lipid-rich regions changes when transitioning from the acinus to the duct. The spatial representation of transitions in the CARS spectrum is a helpful tool in assessing the maturation process of the meibum lipids when migrating through the gland. The results displayed here provide evidence for lipid modifications in the central duct, suggesting post-processing of the lipid within the ductal region of the gland. The most notable differences between the vibrational spectra of the lipids of the acini and the duct are found in the 2880 – 2940 cm−1 range, a region known to be sensitive to the mobility of the aliphatic chains.35, 42, 43 The observed spectral differences may thus reflect differences in lipid fluidity throughout the gland structure, a parameter of direct relevance to assessing the health of the meibomian gland.33 Nonetheless, the mechanism underlying this post- processing of meibum within normal glands needs further elucidation. Clearly, application of this approach to studying meibum in dysfunctional glands will provide important insights into the pathogenesis of this disorder. 5.ConclusionIn this work, we have used picosecond CARS imaging combined with spectral scanning to generate spectral CARS images of the meibomian gland. Spectral ps-CARS imaging is particularly useful when variations exist within a relatively narrow spectral window, which enables the generation of spectral data sets with rapid signal acquisition times. We have applied this approach to examine tentative changes in the lipid composition of meibum throughout the gland structure. By comparing the CARS spectra of the acinus and the central duct with Raman microspectroscopic point measurements, we have found evidence for modifications to the meibum lipid composition when transitioning from the acini to the central duct. A spectral decomposition of the image based on a principal component analysis confirms the changes in the CARS spectrum between the lipid-rich regions of the acini and the central duct. A clear separation of the functional units of the gland is obtained with the PCA based spectral classification, which demonstrates the utility of the multivariate analysis approach to CARS spectral imaging of large tissue segments. AcknowledgmentsPart of this work was funded by National Institutes of Health Grant No. P41-RR01192 (LAMMP) and by National Science Foundation Grant DBI-0754624, a gift from Alcon, Inc. and Research to Prevent Blindness, Inc. J. L. S. acknowledges support from the National Institute of Biomedical Imaging and Bioengineering, National Research Service Award EB009418-01 from the University of California, Irvine, CA. ReferencesJ. X. Cheng,
“Coherent anti-Stokes Raman scattering microscopy,”
Appl. Spectrosc., 91 197
–208
(2007). https://doi.org/10.1366/000370207781746044 Google Scholar
C. L. Evans and
X. S. Xie,
“Coherent anti-Stokes Raman scattering microscopy: chemical imaging for biology and medicine,”
Annu. Rev. Anal. Chem., 1 883
–909
(2008). https://doi.org/10.1146/annurev.anchem.1.031207.112754 Google Scholar
C. L. Evans, E. O. Potma, M. Puoris'haag, D. Côté, C. Lin, and
X. S. Xie,
“Chemical imaging of tissue in vivo with video-rate coherent anti-Stokes Raman scattering (CARS) microscopy,”
Proc. Natl. Acad. Sci., 102 16807
–16812
(2005). Google Scholar
F. Henry, D. Côté, M. A. Randolph, E. A. Z. Rust, R. W. Redmond, I. E. Kochevar, C. P. Lin, and
J. M. Winograd,
“Real-time in vivo assessment of the nerve microenvironment with coherent anti-Stokes Raman scattering microscopy,”
Plast. Reconstr. Surg., 123 123S
–130S
(2009). https://doi.org/10.1097/PRS.0b013e318191c5b8 Google Scholar
T. B. Huff, Y. Shi, Y. Yan, H. Wang, and
J. X. Cheng,
“Multimodel nonlinear optical microscopy and applications to central nervous system,”
IEEE J. Select. Topics. Quant. Electron., 14 4
–9
(2008). https://doi.org/10.1109/JSTQE.2007.913419 Google Scholar
H. W. Wang, I. M. Langohr, M. Sturek, and
J. X. Cheng,
“Imaging and quantitative ananlysis of atherosclerotic lesions by CARS-based multimoddal nonlinear optical microscopy,”
Artherioscler. Thromb. Vasc. Biol., 29 1342
–1342
(2009). https://doi.org/10.1161/ATVBAHA.109.189316 Google Scholar
S. H. Kim, E. S. Lee, J. Y. Lee, E. S. Lee, B. S. Lee, J. E. Park, and
D. W. Moon,
“Multiplex coherent anti-Stokes Raman spectroscopy images intact atheromatous lesions and concomitantly identifies distinct chemical profiles of atherosclerotic lipids,”
Circ. Res., 106 1332
–1341
(2010). https://doi.org/10.1161/CIRCRESAHA.109.208678 Google Scholar
R. S. Lim, A. Kratzer, N. P. Barry, S. Miyazaki-Anzai, M. Miyazaki, W. W. Mantulin, M. Levi, E. O. Potma, and
B. J. Tromberg,
“Multimodal CARS microscopy determination of the impact of diet on macrophage infiltatration and lipid accumulation on plaque formation in ApoE-deficient mice,”
J. Lipid Res., 51 1729
–1737
(2010). https://doi.org/10.1194/jlr.M003616 Google Scholar
T. Helllerer, C. Axäng, C. Brackmann, P. Hillertz, M. Pilon, and
A. Enejder,
“Monitoring of lipid storage in Caenorhabditis elegans using coherent anti-Stokes Raman scattering (CARS) microscopy,”
Proc. Natl. Acad. Sci. U.S.A., 104 14658
–14663
(2007). https://doi.org/10.1073/pnas.0703594104 Google Scholar
R. K. Lyn, D. C. Kennedy, S. M. Sagan, D. R. Blais, Y. Rouleau, A. F. Pegoraro, X. S. Xie, A. Stolow, and
J. P. Pezacki,
“Direct imaging of the disruption of hepatitis C virus replication complexes by inhibitors of lipid metabolism,”
Virology, 394 130
–142
(2009). https://doi.org/10.1016/j.virol.2009.08.022 Google Scholar
T. T. Le, H. M. Duren, M. Slipchenko, C. D. Hu, and
J. X. Cheng,
“Label-free quantitative analysis of lipid metabolism in living Caenorhabditis elegans,”
J. Lipid Res., 51 672
–677
(2010). https://doi.org/10.1194/jlr.D000638 Google Scholar
J. X. Cheng, A. Volkmer, L. D. Book, and
X. S. Xie,
“Multiplex coherent anti-Stokes Raman scattering microspectroscopy and study of lipid vesicles,”
J. Phys. Chem. B, 106 8493
–8498
(2002). https://doi.org/10.1021/jp025771z Google Scholar
T. W. Kee, H. Zhao, and
M. T. Cicerone,
“One-laser interferometric broadband coherent anti-Stokes Raman scattering,”
Opt. Express, 14 3631
–3636
(2006). https://doi.org/10.1364/OE.14.003631 Google Scholar
G. I. Petrov and
V. V. Yakovlev,
“Enhancing red-shifted white-light continuum generation in optical fibers for applications in nonlinear Raman microscopy,”
Opt. Express, 13 1299
–1306
(2005). https://doi.org/10.1364/OPEX.13.001299 Google Scholar
M. Müller and
J. M. Schins,
“Imaging the thermodynamic state of lipid membranes with multiplex CARS microscopy,”
J. Phys. Chem. B, 106 3715
–3723
(2002). https://doi.org/10.1021/jp014012y Google Scholar
J. P. Ogilvie, E. Beaurepaire, A. Alexandrou, and
M. Joffre,
“Fourier-transform coherent anti-Stokes Raman scattering microscopy,”
Opt. Lett., 31 480
–482
(2006). https://doi.org/10.1364/OL.31.000480 Google Scholar
D. L. Marks and
S. A. Boppart,
“Nonlinear interferometric vibrational imaging,”
Phys. Rev. Lett., 92
(12), 123905
(2004). https://doi.org/10.1103/PhysRevLett.92.123905 Google Scholar
R. Arora, G. I. Petrov, and
V. V. Yakovlev,
“Analytical capabilities of coherent anti-Stokes Raman scattering microspectroscopy,”
J. Mod. Opt., 55 3237
–3254
(2008). https://doi.org/10.1080/09500340802168639 Google Scholar
H. A. Rinia, M. Bonn, M. Müller, and
E. M. Vartiainen,
“Quantitative CARS spectroscopy using the maximum entropy method: The main lipid phase transition,”
ChemPhysChem, 8 279
–287
(2007). https://doi.org/10.1002/cphc.200600481 Google Scholar
V. V. Yakovlev, G. I. Petrov, V. Shcheslavskiy, and
R. Arora,
“Nonlinear optical microspectroscopy of biochemical interactions in microfluidic devices,”
Biochemical Applications of Nonlinear Optical Spectroscopy, CRC Press, Boca Raton, FL
(2009). Google Scholar
D. Schafer, M. Müller, M. Bonn, D. W. M. Marr, J. V. Maarseveen, and
J. Squier,
“Coherent anti-Stokes Raman scattering microscopy for quantitative characterization of mixing and flow in microfluidics,”
Opt. Lett., 34 211
–213
(2009). https://doi.org/10.1364/OL.34.000211 Google Scholar
M. N. Slipchenko, T. T. Le, H. Chen, and
J. X. Cheng,
“High-speed vibrational and spectral analysis of lipid bodies by compound Raman microscopy,”
J. Phys. Chem. B, 113 7681
–7686
(2009). https://doi.org/10.1021/jp902231y Google Scholar
J. P. McCulley and
W. E. Shine,
“Meibomian gland function and the tear lipid layer,”
Ocul. Surf., 1 97
–106
(2003). Google Scholar
A. J. Bron and
J. M. Tiffany,
“The meibomian glands and tear film lipids: structure, function and control,”
Adv. Exp. Med. Biol., 438 281
–295
(1998). Google Scholar
G. N. Foulks,
“The correlation between the tear film lipid layer and dry eye disease,”
Surv. Ophthalmol., 52 369
–374
(2007). https://doi.org/10.1016/j.survophthal.2007.04.009 Google Scholar
B. D. Sullivan, J. E. Evans, M. R. Dana, and
D. A. Sullivan,
“Influence of aging on the polar and neutral lipid profiles in human meibomian gland secretions,”
Arch. Ophthalmol., 124 1286
–1292
(2006). https://doi.org/10.1001/archopht.124.9.1286 Google Scholar
J. Filik and
N. Stone,
“Analysis of human tear fluid by Raman spectroscopy,”
Anal. Chim. Acta, 616 177
–184
(2008). https://doi.org/10.1016/j.aca.2008.04.036 Google Scholar
Y. Oshima, H. Sato, A. Zaghloul, G. N. Foulks, M. C. Yappert, and
D. Borchman,
“Characterization of human meibum lipid using Raman spectroscopy,”
Curr. Eye Res., 34
(10), 824
–835
(2009). https://doi.org/10.3109/02713680903122029 Google Scholar
M. J. Adams, Chemometrics in Analytical Spectroscopy, 2nd ed.RSC Analytical Spectroscopy monographs Royal Society of Chemistry, Cambridge
(2004). Google Scholar
M. Diem, C. Matthäus, T. Chernenko, M. J. Romeo, M. Miljković, B. Bird, J. Schubert, K. Papamarkakis, and
N. Laver,
“Infrared and Raman spectroscopy and spectral imaging of individual cells,”
Infrared and Raman spectroscopic imaging, 173
–201 Wiley-VCH Verlag GmbH & Co., Weinheim
(2009). Google Scholar
M. J. Romeo, B. Bird, S. Boydston-White, C. Matthäus, M. Miljković, T. Chernenko, and
M. Diem,
“Infrared and Raman microspectroscopic studies of individual human cells,”
Vibrational Spectroscopy for Medical Diagnosis, Wiley, Hoboken
(2008). Google Scholar
J. W. Chan, D. S. Taylor, T. Zwerdling, S. M. Lane, K. Ihara, and
T. Huser,
“Micro-Raman spectroscopy detects individual neoplastic and normal hematopoietic cells,”
Biophys. J., 90 648
–656
(2006). https://doi.org/10.1529/biophysj.105.066761 Google Scholar
D. Borchman, M. C. Yappert, and
G. N. Foulks,
“Changes in human meibum lipid with meibomian gland dysfunction using principal component analysis,”
Exp. Eye Res., 91 246
–256
(2010). https://doi.org/10.1016/j.exer.2010.05.014 Google Scholar
J. Shlens,
“A Tutorial of Principal Component Analysis: Derivation, Discussion and Single Value Decomposition,”
(2005) http://www.snl.salk/∼shlens/pub/notes/pca.pdf Google Scholar
B. P. Gaber and
W. L. Peticolas,
“On the quantitative interpretation of biomembrane structure by Raman spectroscopy,”
Biochim. Biophys. Acta, 465 260
–274
(1977). https://doi.org/10.1016/0005-2736(77)90078-5 Google Scholar
T. W. Kee and
M. T. Cicerone,
“Simple approach to one-laser, broadband coherent anti-Stokes Raman scattering microscopy,”
Opt. Lett., 29 2701
–2703
(2004). https://doi.org/10.1364/OL.29.002701 Google Scholar
J. Y. Lee, S. H. Kim, D. W. Moon, and
E. S. Lee,
“Three-color multiplex CARS for fast imaging and microspectroscopy in the entire CHn stretching vibrational region,”
Opt. Express, 17 22281
–22295
(2009). https://doi.org/10.1364/OE.17.022281 Google Scholar
C. Krafft, A. A. Ramoji, C. Bielecki, N. Vogler, T. Meyer, D. Akimov, P. Rösch, M. Schmitt, B. Dietzek, I. Petersen, A. Stallmach, and
J. Popp,
“A comparative Raman and CARS imaging study of colon tissue,”
J. Biophoton., 2 303
–312
(2009). https://doi.org/10.1002/jbio.200810063 Google Scholar
P. D. Chowdary, W. A. Benalcazar, Z. Jiang, D. M. Marks, S. A. Boppart, and
M. Gruebele,
“High speed nonlinear interferometric vibrational analysis of lipids by spectral decomposition,”
Anal. Chem., 82 3812
–3818
(2010). https://doi.org/10.1021/ac100222c Google Scholar
E. M. Vartiainen, H. A. Rinia, M. Muller, and
M. Bonn,
“Direct extraction of Raman line-shapes from congested CARS spectra,”
Opt. Express, 14 3622
–3630
(2006). https://doi.org/10.1364/OE.14.003622 Google Scholar
Y. Liu, Y. J. Lee, and
M. T. Cicerone,
“Broadband CARS spectral phase retrieval using a time-domain Kramers-Kronig transfrom,”
Opt. Lett., 34 1363
–1365
(2009). https://doi.org/10.1364/OL.34.001363 Google Scholar
H. A. Rinia, K. N. J. Burder, M. Bonn, and
M. Müller,
“Quantitative Label-Free Imaging of Lipid Composition and Packing of Individual Cellular Lipid Droplets Using Multiplex CARS Microscopy,”
Biophys. J., 95 4908
–4914
(2008). https://doi.org/10.1529/biophysj.108.137737 Google Scholar
R. G. Snyder, H. L. Strauss, and
C. A. Elliger,
“C-H stretching modes and structure of n-alkyl chains 1. Long, disordered chains,”
J. Phys. Chem., 86 5145
–5150
(1982). https://doi.org/10.1021/j100223a018 Google Scholar
|


