
|
|
|
The high level of recent interest in coherent Raman scattering (CRS) and, in particular, its implementation in a microscope, is due to both the excellent sensitivity and chemical selectivity of the technique. Numerous efforts have exploited these characteristics in developing CRS as a means of real-time, label-free visualization of biological phenomena and chemical characterization with high spatial and temporal resolution. The family of CRS techniques includes coherent anti-Stokes Raman scattering (CARS), coherent Stokes Raman scattering (CSRS), and stimulated Raman scattering. Of these, CARS has received the most attention due to its high sensitivity and the relative ease of separation and detection of its signal of interest from intrinsic sample fluorescence. Notable systems and phenomena that have been visualized with CARS include lipid droplets within cells,1 nonlinear optical plasmonic emission,2 microscopic brain structures,3 isolated single-wall carbon nanotubes,4 [TeX:] $3\rm{\hbox{-D}}$ in vivo imaging of tissues of a living mouse,5 and silicon nanowires.6 These examples illustrate the power and utility of coherent Raman imaging as well as how our understanding of fundamental metrology questions related to image contrast on complex samples continues to evolve. These same questions persist for coherent Stokes Raman scattering, the analog of CARS wherein the measured signal is redshifted from the Stokes beam. In this letter, we explore the CSRS image contrast from geometry-controlled structures of dimensions similar to the wavelength of the probe light. We compare these results to the linear variant of Stokes Raman, spontaneous Raman scattering (SpRS). This provides for a direct comparison at an identical signal wavelength of the spatial resolution, scattering intensity, and image contrast of the coherent and noncoherent microscopy performance, as previously shown by Pestov 7 for microspectroscopy and Cui 8 for microscopy configurations. We now extend this comparison to include the backscattered, epi, detection geometry in a microscope and, using a well-defined sample series, illustrate the differences in image contrast between these two imaging modalities. Figure 1 shows a schematic diagram of the experimental setup used in this work. The laser source consists of two synchronized Ti:sapphire oscillators with 2.2-ps pulse widths. Their center wavelengths are set to 785 nm (Stokes) and 754 nm (pump) to produce a 520-cm−1 frequency difference resonant with the silicon phonon mode. The laser light was sent through long-pass filters that blocked unwanted laser fluorescence. Glan–Taylor polarizers, quarter- and half-wave plates provide complete control of the polarization of the beams. A spinning quarter-wave polarimeter is used to monitor the orientation and polarization state of the laser beams. Although not shown in the diagram, both beams are focused into 20-μm-diam pinholes using a low-magnification (4X) objective lens and collimated using an identical lens. This spatial fltering is done to produce a Gaussian beam profle and to provide compensation to cancel out any chromatic aberrations in the microscope focus. The pump and Stokes beams are collinearly aligned using a 50:50 beam splitter. The collinear beams are then focused into a [TeX:] $\beta \hbox{-} \rm{BaB}_{2O_{4}}$ (BBO) crystal. The output of the crystal is spectroscopically monitored for the presence of a sum frequency generation (SFG) signal, and it is used to establish the spatiotemporal synchronization of the beams.9 Alternatively, the collinear beams can be directed by way of a flip mirror into a custom microscope design.10 An oil-immersion objective lens (Uplan FL N, X100, NA = 1.30) is employed to create the SpRS and CSRS from the sample. The scattered photons from the sample are separated from the incident beams by placing another 50:50 beam splitter in the backscattered beam path. These signals were coupled into multimode fbers, which provided weak confocal detection, and transported to either a spectrograph for spectral detection or an avalanche photodiode for single-channel imaging. A 785-nm long-pass flter and a 900-nm short-pass flter were used to eliminate unwanted laser scatter from the beams; each was specifed with [TeX:] $>$ 6 OD at block-band wavelengths. Two-dimensional imaging [TeX:] $(\it {xy}$ , [TeX:] $\it {xz}$ , or [TeX:] $\it {yz}$ ) was accomplished using a closed-loop, xyz piezostage to scan the sample. Fig. 1Brief scheme for the experimental setup. GT, Glan–Taylor polarizer; AT, attenuator; PM, polarimeter; FM, flipmirror; BS, beamsplitter; OL, objectivelens; APD, avalanche photodiode; CCD, chargecoupleddevice camera; MF, multimode fiber; BPFs, bandpass flter set. 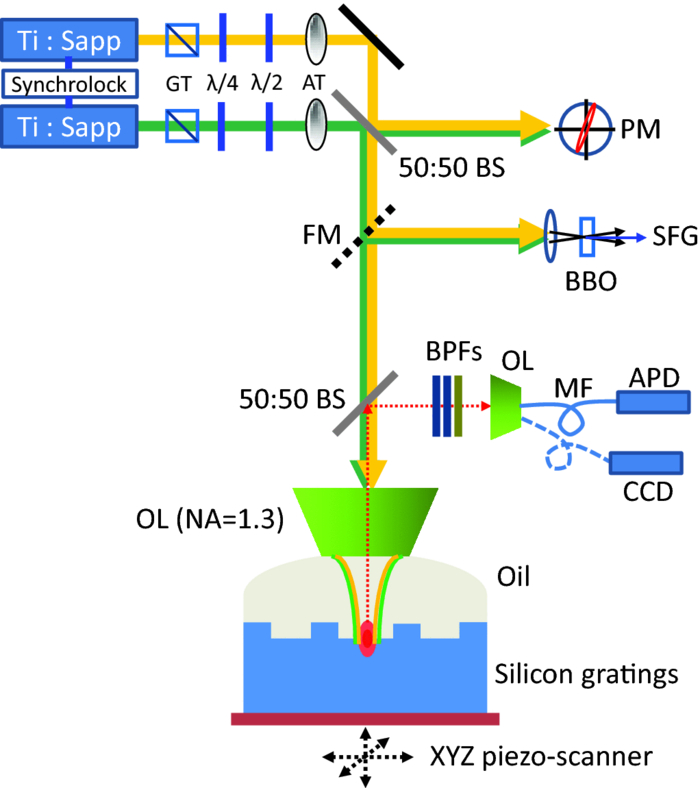 Prior to further discussion of the comparison of SpRS and CSRS we briefly review the fundamental nature of these scattering processes. SpRS is a photonic energy-transfer process in which incident photons scatter from a molecule or crystal at redshifted energies. In cases where the energy difference between the incident and scattered photon is resonant with the energy of a vibrational eigenstate, the effciency of the scattering process is greatly enhanced and a peak appears in the scattering spectrum.11 This scattering process can be stimulated coherently in the presence of additional beams when the energy difference among them is resonant with a vibrational eigenstate of the crystal or molecule. This coherent stimulation requires phase matching,12 resulting in the collective synchronization of the molecular (or crystalline) vibrational motions. Figure 2a compares SpRS to CSRS using an energy-level diagram. In SpRS, the electron excited by the incident beam (pump feld) emits scattered light (Stokes feld) by the spontaneous transition from the virtual state to the vibrationally excited state, while in CSRS the same process is coherently amplified upon the introduction of a second Stokes photon synchronized with the pump photon. Fig. 2(a) Energy diagram for the SpRS and CSRS. (b) SpRS (temporal separation) and CSRS (temporal overlap) intensities for the silicon (111) wafer excited by [TeX:] $2\hbox{-}\rm{mW}, 785\rm{\hbox{-}nm}$ Stokes, and [TeX:] $2\rm{\hbox{-}mW}, 754\rm{\hbox{-}nm}$ pump beams. The inset shows the power dependence of CSRS signal.  As mentioned above, comparative studies between spontaneous and coherent Raman scattering have been reported recently. Petrov 13 demonstrated experimentally that CARS is 100 times more intense than SpRS from a single bacterial spore under the three-color mixing condition with detection in the forward-scattering geometry. They identifed the factors controlling the relative effciency of coherent and spontaneous Raman scattering, including the probe wavelength, the analyte number density, the coherence between ground and excited vibrational states, and the length of the beam-sample interaction. Pestov 7 performed a time-resolved spectroscopy study on CSRS as a function of the length of the probe pulse for neat pyridine liquid. They demonstrated that the oscillating temporal structure of the CSRS signal gradually disappears as the length of the probe pulse is increased. In their work, the efficiency of CSRS was found to be five orders of magnitude greater than that of SpRS. This work also employed detection in the forward-scattering geometry. They also reported that the signal from the nonresonant background is signifcantly suppressed by delaying the probe pulse. Cui 8 applied the spectral modulation technique to a single broadband laser source and created a “single-shot” three-color geometry. They demonstrated an improvement in spatial resolution for CSRS over SpRS in images of polystyrene beads with forward-scattering detection. They reported comparable signal intensities for CSRS and SpRS when the power of the pump beam for SpRS is the same as the sum total (pump, Stokes, and probe) power for CSRS and the effciency of CSRS was calculated to be six times greater than that of SpRS. In this letter, we explore similar comparisons between SpRS and CSRS as those noted above, yet using a backscattering detection configuration. The process of backscattered CRS is generally thought to be of high effciency for specimens with dimensions comparable to or smaller than the wavelengths of the pump and Stokes beams.14 A series of silicon samples with increasing levels of complexity are utilized, beginning with a bulk wafer and continuing with samples having a point (array of pillars), one-dimensional (line grating), and last, two- dimensional (checkered board) microstructure. Note that these samples are compositionally uniform; the reported image contrast results solely from the interplay between the microscope focal volume, the sample geometry, and the scattering properties of silicon. The relative efficiency of SpRS and CSRS from a bulk silicon (111) wafer is shown in the two spectra displayed in Fig. 2b. In this case, the signals are collected with the pump [TeX:] $(754\rm{\hbox{-}nm})$ and Stokes [TeX:] $(785\rm{\hbox{-}nm})$ beam temporally overlapped (CSRS) or separated (SpRS), with a spectral integration time of 1 s. The temporal separation is set at 800 ps for the SpRS measurements. The main difference between these two spectra is due to the CSRS process at the difference frequency between the pump and Stokes beams (i.e., resonant with the Si phonon at 520 cm−1). The spectrum labeled CSRS (red line) contains contributions from both spontaneous Raman scattering and CSRS. The spectral flters used in this configuration insure that the Si phonon peak in the SpRS spectrum due to the 754 nm pump beam is not detected. The same power (2 mW) is used for both the 785-nm Stokes beam and the 754-nm pump beams, where the energy difference is resonant with the Si phonon at 520 cm−1. The measured spectral resolution is nominally 8 cm−1 at full width half maximum (FWHM); this value is limited by the spectral bandwidth of the 2.2-ps pulses. The CSRS intensity is reduced by a factor of ∼2 when the two beams are temporally separated or when the pump beam is blocked. Notably, this result is similar to that reported by Cui 8 where the SpRS intensity was similar to the CSRS intensity when the specimen was illuminated by the same total power for each measurement. However, the full significance of this similarity is unclear because the experiments differ considerably with respect to the sample, optical scheme, and detection geometry. The inset in Fig. 2b shows the power dependence of the CSRS signal. The red circles show the CSRS intensity as a function of variation in Stokes power with the pump power fixed at 2 mW along with a best-ft line (red line; x = 1.869, R 2 = 0.987). The black squares show the CSRS intensity as a function of variation in the pump power with the Stokes power fxed at 2 mW along with the best ft function of the form I αP x (black line; slope = 1, R 2 = 0.994). The curves show that the CSRS process measured here varies linearly with pump power and near quadratically with Stokes power. This result is in good agreement with the description of the CSRS intensity in the literature,12 Eq. 1[TeX:] \documentclass[12pt]{minimal}\begin{document} \begin{equation} I_{\rm CSRS}\propto \chi ^{3}(\rm{\omega}_{CSRS},\omega_{s}, \omega_{s}, -\omega_{p})E_{\rm S}^{2}E_{\rm P}^{*}, \end{equation} \end{document}The next sample in the progression of microstructural complexity is an array of sharp Si tips. This sample was imaged by both SpRS and CSRS in an effort to compare the spatial resolution of the two techniques for this type of sample. An 8 × 8 μm2 3-D atomic force microscopy (AFM) image of the tip grating sample (TGTI, NT-MDT) is shown in Fig. 3a. The AFM results indicate that the average height of the tips is ≈300 nm and the average diameter at half height is ∼100 nm. A schematic illustration shown in Fig. 3b, adapted from information provided by the vendor, includes the grating pitch and nominal feature dimensions. Figures 3c and 3d show SpRS and CSRS xy images for an 8 × 8 μm2 region of the silicon tip grating, respectively. The two images are taken under the identical experimental conditions (power, polarization, wavelength, etc.) except that the beams were either temporally separated (SpRS) or overlapped (CSRS). The same power (1.2 mW) was used for the pump [TeX:] $(754\rm{\hbox{-}nm})$ and the Stokes [TeX:] $(785\rm{\hbox{-}nm})$ beams, and the scan speed in each case was 30 ms/pixel. Each inset is an xz depth-resolved image of one of the tips z-scanned along the x-axis at the position indicated by the dotted line in the main image. The nominal FWHM of these features in the xy plane is ∼0.3 μm and ∼1.5 μm in the xz plane for the CSRS images, which is in good agreement with literature6 that reports the same quantities from CARS images of silicon nanowires (nominal diameter of 5 nm) as 0.3 and 1.43 μm, respectively. The same quantities can be extracted from the SpRS image; they are found to be ∼0.4 and ∼2.5 μm, respectively. The values for the SpRS spatial resolution were found to be independent of the input power within acceptable signal-to-noise limits. The difference between CSRS and SpRS is clearly noticeable in the z-scanning images shown in the insets. Theoretically, CSRS is advantageous in studying the edges of specimens because the intensity of CSRS scales quadratically with the number of oscillators; thus, the CSRS process generates signifcant image contrast near interfaces. The focal volume of CSRS is typically smaller than that of SpRS for reasons common to nonlinear imaging techniques, where the signal only arises from areas of spatial overlap between two tightly focused beams and where a threshold in intensity is met. Notably, the coherent nature of CSRS can lead to specifc resolution effects that do not occur in microscopies based on incoherent contrast mechanisms (e.g., fluorescence); these effects have been discussed in the literature in the context of CARS microscopy.16 Local dark “halo” patterns around the bright emitting spots in the CSRS image [Fig. 3(d)] are observed. Similar features are frequently reported in CARS images recorded in a forward-scattering geometry due to the distortion of the focus induced by a destructive interference between CARS fields from the target microstructure and its surroundings. The high refractive index (n = 3.688, ε = 0.005 at 820 nm) of silicon leads to a high level of reflected light at the oil/silicon interface17 (∼20% reflection at normal incidence). It is reasonable then to infer that a considerable amount of the CSRS signal recorded in the backscattered geometry is due to not only backscattered light but also forward-scattered CSRS photons reflected at the high index surface [inset of Fig. 3d]. The halo features may then be due to interference between the forward scattered and backscattered CSRS fields. This effect also plays into the comparison between the effciency of backscattered CSRS and SpRS because, in both cases, there is likely to be some contribution due to reflected forward scattering. Fig. 3(a) AFM image for the silicon tip grating. (b) Schematic illustration of the tip-grating geometry. (c) 8 × 8 pm xy SpRS image. (d) 8 × 8 μm xy CSRS image of the same region shown in (c). The insets are the z-scan images recorded at the location denoted by the dotted lines in (c) and (d). 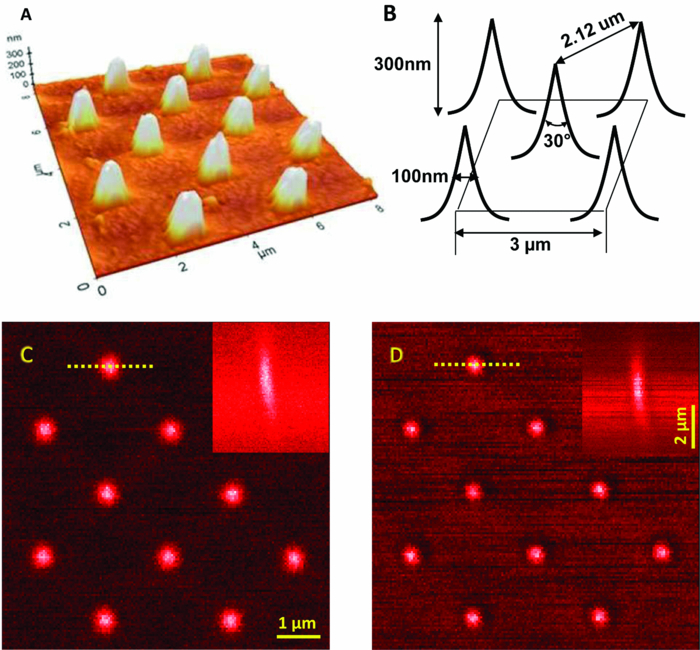 Continuing in the progression of geometric complexity to a sample with one-dimensional microstucture, SpRS and CSRS images of a sawtooth-shaped silicon grating (TGGI, NT-MDT) were recorded. Figure 4a is a schematic illustration of this sample, incorporating dimensional information provided by the supplier. Note that the FWHM of the focal volume along the z-axis for both CSRS and SpRS is smaller than the height of one sawtooth or groove. Consequently, as the scan proceeds along the axis perpendicular to the long axis of the groove, the number of the oscillators within the focal volume rises and falls as the focus is scanned through the sawtooth. The Cartesian coordinate system shown in the inset indicates the scanning directions. Figures 4b and 4c are xz-scanning SpRS and CSRS images for a selected scan line perpendicular to the long axis of the groove. As noted earlier, the only difference between these image acquisitions is the presence (CSRS) or absence (SpRS) of temporal overlap between the pump and Stokes beams. The polarizations of the two beams are the same and parallel to the long axis of the grooves. Two notable features are present in these images. First, in a fashion similar to that seen for the Si tip grating, the emission is localized near to the tip of the sawtooth for both SpRS and CSRS, although the degree of the localization is more pronounced in CSRS. Second, the CSRS emission contrast is different from the SpRS emission in the area between adjacent sawtooths when the focal plane is set at the base of the groove [seen along the line marked δ in Fig. 4c]. To confirm the presence of this contrast, xy-scanning images are included at the bottom of the image sets (denoted γ′ and δ′) wherein the focal plane is set to the plane at the bottom of the sawtooth, as indicated in the schematic illustration in Fig. 4a and indicated by the lines γ and δ in Figs. 4b and 4c, respectively. In these images, the presence of the peak at the base of the groove in the CSRS image is clearly evident and its absence is clear in the SpRS images. The brightness of this feature is dependent on the polarization of the beam, which reaches the maximum intensity when the polarization of the beam is parallel to the groove patterns. A defnitive identifcation of the nature of the peak seen at the base of the groove in the CSRS image requires modeling beyond the scope of this letter. However, it is likely that the high CSRS intensity at the base of the groove is due to constructive interference among CSRS fields from the adjacent silicon grooves, analogous to the interference fringe formation at the joint of two attached lipid bilayers reported previously.18 Fig. 4(a) Schematic illustration of focal volume scanning through the sawtooth-shaped silicon grating. (b) The 8×8 μm xzSpRS image. (c) The 8×8 μm xz CSRS image. γ1 and δ† are the xy-scanning images corresponding to the area denoted by the dotted lines indicated in (b) and (c). (d) Intensity profles for SpRS(α′) and CSRS (β′) along the x-axis direction extracted from the images in(b)and(c)along the indicated lines (α and β).  To further examine the features described above, Fig. 4d displays an intensity comparison between SpRS and CSRS scanning through the brightest spots displayed in Figs. 4b and 4c, along the lines indicated α and β. The polarization dependence of the CSRS signal was measured for this feature as well, and it also shows maximum intensity when the direction of the beam polarization is parallel to the groove direction. This effect may be similar to that seen in the study of an isolated single-wall carbon nanotube,4 in which the number of dipole oscillators available for the coherent buildup is maximized when the long axis of an asymmetric structure is parallel to the polarization of the incident beam. The intensity changes across the line scan are expected to show the quadratic and linear dependence on the number of oscillators present in the focal volume for CSRS and SpRS, respectively. It is difficult to know precisely how the oscillator density changes across the line scan because this quantity clearly depends sensitively on the exact height of the focal plane with respect to the groove geometry. Additionally, the CSRS intensity is subject to possible coherent effects. However, the comparison between SpRS and CSRS for this sample is similar to those described above. The spatial resolution of CSRS is clearly higher than SpRS while the difference in scattering intensities is not particularly large. Finally, a checkerboard patterned Si grating (TGXI, NT-MDT) is imaged in an attempt to detail the difference in image contrast between SpRS and CSRS for a two- dimensionally complex microstructure. Figure 5a is a scanning electron microscopy (SEM) image of the sample. From this image, we can see that the array is made up of 1.3 × 1.3 μm Si square pillars that have microstructured top edges surrounding each pillar, which appears as a light banded feature in the SEM image. These thinned edges result from undercutting of the pillar during the wet etch process used in fabrication. A schematic illustration shown in Fig. 5b, adapted from information provided by the vendor, includes the grating pitch and nominal feature dimensions. Figures 5c and 5d show the xy-scanning images for SpRS and CSRS, respectively. As in the previous examples, the SpRS images were acquired with temporal separation between the pump and Stokes beams while the CSRS images were acquired with temporal overlap. In each series, images were recorded with three different polarization states. The beam-polarization directions (the same for pump and Stokes beams) are denoted by the double-headed arrows in Fig. 5d. In the case of SpRS, the images of the squares appear relatively uniform across the top, with edge resolution that is degraded by the increased focal volume of SpRS. In contrast, in the CSRS images, we observe the appearance of bright spots near the edges of the square pillars. The spots appear along the edge which lies parallel to the polarization direction. When the beam polarization is aligned at 45 deg to the x and y-axes (middle set of images), all four edges display bright spots although the intensity is approximately half that observed in the maximum cases when the beam polarization is aligned along the x (top images) or y (bottom images) scan axis. Given that the oscillator density is uniform around the edges of the square, it is notable that no bright spots are formed at the four corners of the square at any orientation of the polarization. The four specifc x-axis lines chosen to characterize the depth dependence of the contrast are shown by dotted lines and denoted α, β, γ, and δ, respectively. The corresponding xz images are shown to the right and are denoted as α′, β′, γ′, and δ′. As seen in the α′ image, the contrast of one bright region is spread gradually along the z direction. The z scan β′ image shown in Fig. 5d confirms this by showing that the intensity is localized to the two side edges of one protruded square and uniform along the z direction. In the region where there is no bright spot, the difference in the z-scan images between CSRS [γ′ in Fig. 5d] and SpRS [δ′ in Fig. 5d] is modest, with CSRS showing a predictable narrowing of the focal depth relative to SpRS. Several effects could be playing a role in the generation of the contrast bright spots in the CSRS images. These include but are not limited to coherent/interference effects that are generated by the samples microstructured geometry,18 and the increased contrast of coherent Raman microscopy in the backscattered direction for features that are comparable in size to the focal volume, such as edges and interfaces.14 It is not straightforward to assign these features to any one mechanism given their anisotropic nature i.e., one might have predicted that the edges would show increased contrast given the collection geometry. The utility of these results lie in the possibility of accurately modeling this system and ultimately developing predictive models to account for these effects. Fig. 5(a) SEM image for the checkerboard silicon grating. (b) Schematic illustration of the sample microstructure. (c) 5 × 5 μm xy SpRS and (d) CSRS images recorded with the incident beam polarizations aligned as indicated by the yellow arrows. α′, β′, γ′ and δ′ are xz images for the lines (α, β, γ, and δ) indicated in (c) and (d).  In conclusion, we experimentally demonstrate the performance and contrast differences between spontaneous and coherent Stokes Raman scattering microscopy in a backscattered detection geometry. We demonstrate these differences on a series of geometry-controlled microstructures that ranged in complexity from an array of tips to a two-dimensional checker board array. The fine structure of tip gratings allowed us to demonstrate that CSRS has an FWHM lateral spatial resolution of 0.3 μm and FWHM focal depth of 1.5 μm, corresponding to the focal volume being approximately one-third that of SpRS (0.4 and 2.5 μm). When the microstructure was extended to a one-dimensional line grating, again only modest and predictable differences in the performance and contrast between the two modalities were observed. However, when the microstructure was extended in complexity to a two-dimensional array of squares, a polarization dependent, anisotropic response was seen in the CSRS images. The results in this study compare the effciency and resolution afforded by coherent Raman microscopy relative to that of spontaneous Raman microscopy and detail the potential complications in the interpretation of coherent Raman images of sample fine structure in complex specimens. Given the precise knowledge of the nature of the sample, the utility of these results can be found in the potential of accurately modeling these systems and in the development of predictive models that account for the effects of sample complexity on the measured result. AcknowledgmentsThe authors acknowledge Dr. Kushmerick and Dr. Nikoobakht for AFM and SEM fgures in this paper. ReferencesX. Nan, J.-X. Cheng, and
X. Sunney Xie,
“Vibrational imaging lipid droplets in live fibroblast cells with coherent anti-Stokes Raman scattering microscopy,”
J. Lipid Res., 44 2202
(2003). https://doi.org/10.1194/jlr.D300022-JLR200 Google Scholar
H. Kim, D. K. Taggart, C. Xiang, R. M. Penner, and
E. Olaf Potma,
“Spatial control of coherent anti-Stokes emission with height-modulated gold zig-zag nanowires,”
Nano Lett., 8 2373
(2008). https://doi.org/10.1021/nl801207a Google Scholar
C. L. Evans, X. Xu, S. Kesari, X. Sunney Xie, S. T. C. Wong, and
G. S. Young,
“Chemically-selective imaging of brain structures with CARS microscopy,”
Opt. Express, 15 12076
(2007). https://doi.org/10.1364/OE.15.012076 Google Scholar
H. Kim, T. Sheps, P. G. Collins, and
E. O. Potma,
“Nonlinear optical imaging of individual carbon nanotubes with four-wave-mixing microscopy,”
Nano Lett., 9 2991
(2009). https://doi.org/10.1021/nl901412x Google Scholar
C. L. Evans, E. O. Potma, M. Puoris'haag, D. Côté, C. P. Lin, and
X. Sunney Xie,
“Chemical imaging of tissue in vivo with video-rate coherent anti-Stokes Raman scattering microscopy,”
Proc. Natl. Acad. Sci. U.S.A., 102 16807
(2005). https://doi.org/10.1073/pnas.0508282102 Google Scholar
Y. Jung, L. Tong, A. Tanaudommongkon, J.-X. Cheng, and
C. Yang,
“In vitro and in vivo nonlinear optical imaging of silicon nanowires,”
Nano Lett., 9 2440
(2009). https://doi.org/10.1021/nl901143p Google Scholar
D. Pestov, G. O. Ariunbold, X. Wang, R. K. Murawski, V. A. Sautenkov, A. V. Sokolov, and
M. O. Scully,
“Coherent versus incoherent Raman scattering: molecular coherence excitation and measurement,”
Opt. Lett., 32 1725
(2007). https://doi.org/10.1364/OL.32.001725 Google Scholar
M. Cui, B. R. Bachler, and
J. P. Ogilvie,
“Comparing coherent and spontaneous Raman scattering under biological imaging conditions,”
Opt. Lett., 34 773
(2009). https://doi.org/10.1364/OL.34.000773 Google Scholar
D. J. Jones, E. O. Potma, J.-X. Cheng, B. Burfeindt, Y. Pang, J. Ye, and
X. Sunney Xie,
“Synchronization of two passively mode-locked, picosecond lasers within 20 fs for coherent anti-Stokes Raman scattering microscopy,”
Rev. Sci. Instrum., 73 2843
(2002). https://doi.org/10.1063/1.1492001 Google Scholar
M. R. Beversluis and
S. J. Stranick,
“Enhanced contrast coherent anti-Stokes Raman scattering microscopy using annular phase masks,”
Appl. Phys. Lett., 93 231115
(2008). https://doi.org/10.1063/1.3046719 Google Scholar
R. Singh,
“C. V. Raman and the discovery of the Raman effect,”
Phy. Perspect., 4 399
(2002). Google Scholar
M. D. Levenson, Introduction to Nonlinear Laser Spectroscopy, Academic Press, New York
(1982). Google Scholar
G. I. Petrov, R. Arora, V. V. Yakovlev, X. Wang, A. V. Sokolov, and
M. O. Scully,
“Comparison of coherent and spontaneous Raman microspectroscopies for noninvasive detection of single bacterial endospores,”
Proc. Natl. Acad. Sci. U.S.A., 104 7776
(2007). https://doi.org/10.1073/pnas.0702107104 Google Scholar
J.-X. Cheng, A. Volkmer, and
X. Sunney Xie,
“Theoretical and experimental characterization of coherent anti-Stokes Raman scattering microscopy,”
J. Opt. Soc. Am. B, 19 1363
(2002). https://doi.org/10.1364/JOSAB.19.001363 Google Scholar
E. O. Potma, D. J. Jones, J.-X. Cheng, X. Sunney Xie, and
J. Ye,
“High-sensitivity coherent anti-Stokes Raman scattering microscopy with two tightly synchronized picosecond lasers,”
Opt. Lett., 27 1168
(2002). https://doi.org/10.1364/OL.27.001168 Google Scholar
J.-X. Cheng
Y. K. Jia, G. Zheng, and
X. Sunney Xie,
“Laser-scanning coherent anti-stokes Raman scattering microscopy and applications to cell biology,”
Biophys. J., 83 502
(2002). https://doi.org/10.1016/S0006-3495(02)75186-2 Google Scholar
M. A. Green and
M. J. Keevers,
“Optical properties of intrinsic silicon at 300 K,”
Progr. Photovolt., 3 189
(1995). https://doi.org/10.1002/pip.4670030303 Google Scholar
E. O. Potma, and
X. Sunney Xie,
“Detection of single lipid bilayers with coherent anti- Stokes Raman scattering (CARS) microscopy,”
J. Raman Spectrosc., 34 642
(2003). https://doi.org/10.1002/jrs.1045 Google Scholar
|


