
|
|
1.IntroductionCoherent anti-Stokes Raman scattering (CARS) microscopy probes local chemical identities by intrinsic vibrational responses of sample molecules.1, 2, 3 Its great sensitivity, three-dimensional sectioning ability, and fast imaging speed make this technique very attractive for biomedical imaging applications.1 To generate CARS signals, one needs two synchronized laser pulses of which frequency difference matches that of the molecular vibration.1, 4 Most CARS imaging applications employ narrowband (bandwidth of 3–10 cm−1) lasers to maximize spectral resolution and minimize the nonresonant backgrounds and nonlinear photodamage.5 This narrowband CARS method has proven to be an excellent lipid imaging tool thanks to the strong CARS signals of lipids at 2840 cm−1.1 Its chemical selectivity is, however, limited. For example, although a strong signal level at 2840 cm−1 is a good indicator of lipids, dense protein structures such as keratin and collagen fiber also generate significant signals at this frequency.6, 7 On the other hand, CARS microscopes can be configured to obtain a vibrational “spectrum” and rich chemical information can be obtained, such as chemical compositions and thermodynamic states, by analyzing their vibrational spectra.8, 9, 10 Although the narrowband CARS method can perform a rapid beam-scanning microscopy at a single vibrational frequency, spectroscopy with this method is slow.11 To obtain a CARS spectrum in the narrowband CARS technique, one needs to record CARS signals while scanning the frequency of one laser, which is typically a slow process. Switching of vibrational excitation frequency can be done faster and easier in the so-called spectral focusing CARS method.9, 12, 13, 14 In this technique, chirped broadband laser pulses are used to generate CARS signals. High spectral resolution is achieved when appropriate group velocity dispersion (GVD) is applied to the laser pulses and switching of vibrational excitation frequency is done by time delay between the pump and Stokes pulses.9, 12, 15 Its application to cellular imaging and microspectroscopy has already been demonstrated.8, 14, 15, 16 Nonresonant background has been a major issue in CARS microscopy and microspectroscopy.4 This electronic four-wave-mixing signal interferes with the vibrationally resonant CARS signal to distort the spectral shape of measured CARS signals.17, 18 Spectral focusing CARS suffers from the nonresonant background in the same way as the narrow CARS method does.16, 17, 19 Note that the effect of nonresonant background on measured CARS signals and its remedy depend on the relative intensity of the resonant signals with respect to that of the nonresonant background.4 If the resonant signal is considerably larger than the nonresonant background (homodyne limit), the measured CARS spectrum shows distinct vibrational resonances, of which frequencies can be directly correlated to the Raman ones. In the opposite situation (heterodyne limit), however, the spectral shape of the measured signal becomes dispersive and its strength comes mostly from the cross term between the resonant signal and nonresonant background.17, 20 The aims of this contribution are the following. First, we demonstrate high spectral resolution of spectral focusing CARS imaging and microspectroscopy. Spectral resolutions of 20 and 30 cm−1 are achieved at the fingerprint and CH (carbon-hydrogen) stretching regions, respectively. Second, we present two different approaches that can extract Raman-like CARS signals from microscopic samples. Most fingerprint vibrational modes (800–1700 cm−1) from cellular components are in the heterodyne limit and fast frequency modulation (FM) with lock-in signal detection can retrieve Raman-like CARS signals.16, 21 CH (carbon-hydrogen) stretching peaks (2850–3050 cm−1) of lipid-rich structures, such as lipid droplets, fall in the homodyne limit, and the effect of nonresonant background is minimal.14 Samples with much lower lipid concentrations, such as lamellar membranes, fall in the heterodyne regime, and the maximum entropy method can extract Raman-equivalent CARS spectrum. Finally, we perform a combination of the single-frequency CARS imaging and in situ microspectroscopy to demonstrate the advantages of our approach. 2.Materials and Methods2.1.MaterialsThe fatty acids used in this work are stearic (18:0), oleic (18:1), linolenic (18:3), eicosapentaenoic (20:5), and docosahexaenoic (22:6) acids. These oils are purchased from Sigma-Aldrich and used without further purifcation. A mixture of polymer beads is prepared by dispersing polystyrene and polymelamine beads (1 μm nominal diameters, Polysciences, Warrington, PA) on top of a glass coverslip. 3T3-L1 adipocyte cells are cultured in the Dullbecco's modified Eagle's medium supplemented with 10% bovine calf serum. HeLa cells are treated by the following procedure. A phosphate buffered saline solution with 5 mM linolenic acid and 1 mM bovine serum albumin is prepared. This solution is added to the HeLa cell culture to reach the final concentration of linolenic acid at 400 μM in the medium. The cells are used for CARS experiments after one-day incubation. For skin imaging, an ear from white, wild-type mouse is used immediately after sacrificing. The skin tissue is placed between two coverslips. DPPC [1,2-dipalmitoyl-sn-glycero-3-phosphocholine, Avanti Polar Lipids, Alabaster, AL] is used to prepare lipid membrane samples. DPPC solution in a mixture of chloroform and methanol (9: 1 v/v) is evaporated under vacuum for 6 h to form a bulk film. The film is prehydrated under nitrogen gas saturated in water vapor for 15 mins. Addition of a HEPES [4-(2-hydroxyethyl)-1-piperazine ethane sulfonic acid] buffer (10 mM, pH 7.0) to this lipid film at a temperature of 50oC forms membranes of a few lipid bilayers. All CARS experiments are done at 22oC. 2.2.Frequency Modulation Coherent Anti-Stokes Raman Scattering MicroscopyFor CARS experiments at the fingerprint region (800–1700 cm−1), we use broadband pulses from a single cavity-dumping Ti:sapphire oscillator (Cascade, KM Lasers, Boulder, CO). Figure 1 shows our FM-CARS microscopy setup and the spectrum of our laser.8 The output power of this laser is 40 nJ, and the pulse repetition rate is 2 MHz. The laser beam is split by a 50:50 beam splitter (CVI, Albuquerque, NM), and one arm serves as the pump while the other arm is used as the Stokes. In the pump arm, a Pockels cell (Con Optics, Danbury, CT, Model 350-50C) is placed to switch the polarization direction of incoming pump pulses. Depending on the on-off state of the Pockels cell, the pump pulses travel along one of the two different paths (pump-1 and pump-2 depicted in Fig. 1), which is separated by a polarizing beamsplitter. The returning pump pulses pass the Pockels cell again to recover their original polarization states. We modulate the Pockels cell with a 100-kHz-square driving voltage waveform that is synchronized to the laser pulse train. The amplitude fluctuation of our laser at the modulation frequency (100 kHz) is ∼10−4. This is measured by Fourier spectral analysis of the digitized time traces of the laser pulse with a fast photodiode (DET10A, Thorlabs, Newton, NJ) and a 1.25-MHz data acquisition board (PCIe-6251, National Instruments, Austin, TX). Fig. 1Experimental setup for FM-CARS microscopy. BS, 50:50 beam splitter; PC,Pockels cell; PBS, polarizing beam splitter; G, SF57 glass; SM, galvo scanning mirror; Ll, scan lens; L2, tube lens; OL, microscope objective lens; S, sample; Fl, long wavelength pass filter; F2,short wavelength pass filters; Lock-in, lock-in amplifier. Inset shows the laser spectrum.  In the Stokes arm, a 2.6-cm-long SF57 glass rod (Casix, Fuzhou, China) is inserted to match the amount of GVD in the pump and Stokes pulses. The mirror in the Stokes arm is positioned on a computer-controlled translation stage (M.405-CG, PI, Karlsruhe, Germany), which can move at a maximum speed of 1 mm/s. The pump and Stokes pulses are recombined by the beam splitter and travel collinearly afterward. A sharp-edge long-wave-pass filter (740AELP, Omega Optical, Brattleboro, VT) removes laser frequency components of <740 nm. The laser pulses are focused into a sample by a 1.2 numerical aperture (NA) water immersion objective lens (Olympus, Japan) and CARS signals are collected by a 0.65 NA air objective lens (Olympus, Japan). The laser pulses are removed by two sharp-edge short-wave-pass filters (710 ASP, Omega Optical, Brattleboro, VT) and CARS signals are measured with a photomultiplier tube (PMT) [Hamamatsu, H9656-20, Japan]. The electrical output of the PMT is fed into a lock-in amplifer (SR830, SRS, Sunnyvale, CA) referenced to the driving voltage waveform of the Pockels cell. Figure 2a shows the CARS spectra of bulk cyclohexane obtained with only one pump beam (pump-1 or pump-2). As one can see in Fig. 2a, the CARS signals from this sample fall in the heterodyne limit. Under this condition, the measured CARS signal becomes17 Eq. 1[TeX:] \documentclass[12pt]{minimal}\begin{document} \begin{eqnarray} S(\omega)&\propto& |P_{{\rm R}}(\omega)+P_{{\rm NR}}(\omega)|^{2}\nonumber\\ &\approx& P_{{\rm NR}}(\omega)^{2}+ 2P_{{\rm NR}}(\omega){{\rm Re}}[P_{{\rm R}}(\omega)],\mbox{ }\quad \end{eqnarray} \end{document}Fig. 2FM-CARS Spectroscopy. (a) Measured CARS spectra of cyclohexane by the pump-1 (black) and pump-2 (grey) over time delay. The other pump beam is blocked for these measurements. (b) FM-CARS signal measured with both the pump-1 and pump-2 pulses. See the text for details. 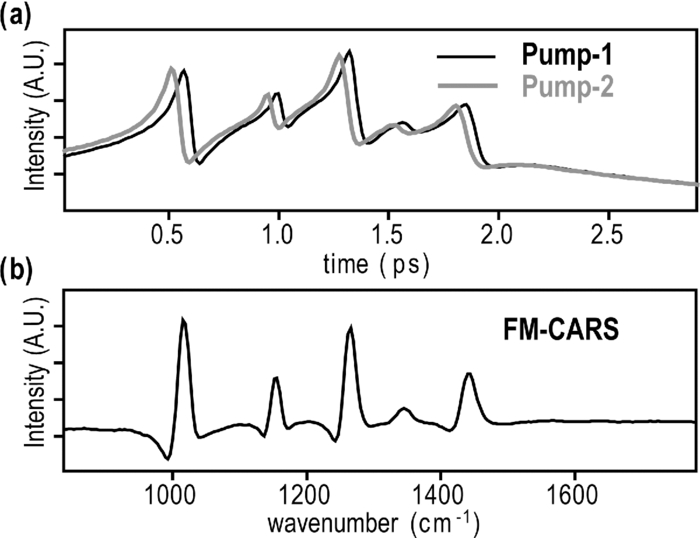 When both pump pulses are unblocked, the lock-in amplifier measures the difference between the two frequency-shifted CARS signals and its output looks close to the shape of spontaneous Raman scattering [Fig. 2b].16, 19, 21 We adjust the mirror position of pump-2 [Fig. 1] to maximize spectral resolution without loss of signal intensity. Other than small dips at the wings of vibrational peaks, frequency modulatuion (FM)-CARS spectrum resembles that of spontaneous Raman scattering. We convert time delay into vibrational frequency with the known Raman peak positions of cyclohexane. The FWHM of 1028 cm−1 peak is 20 cm−1. Note that the horizontal scales of Figs. 2a and 2b correlate to each other. The time-delay axis spans from 0 to 3 ps in Fig. 2a, which corresponds to a frequency range of 800–1800 cm−1 in Fig. 2b. We perform CARS microscopy by raster scanning the laser focal spot with a galvo scanner (GVSM002, Thorlabs, Newton, NJ). The maximum speed of acquiring a 200 × 200 pixel image is 1 Fps (25-μs-pixel dwell time). This speed is limited by the modulation speed of our Pockels cell (100 kHz) and the minimum time constant required for the lock-in amplifer to process signals (30 μs). Most of FM-CARS measurements in this work are performed with the pump and Stokes powers of 12.0 and 11.0 mW, respectively. These powers are measured before the focusing objective lens. 2.3.Spectral Focusing Coherent Anti-Raman Scattering Microscopy at CH Stretching RegionFigure 3a shows our CARS setup for the CH (carbon-hydrogen) stretching frequency region (2800 − 3100 cm−1). The broadband laser pulses are split by a 50:50 beam splitter. One beam is used as the pump pulses for CARS signal generation. The other beam generates supercontinuum with a photonic crystal fiber (PCF) [NL-1.4-775-945, Crystal Fibre, Denmark]. The PCF used here has two zero-dispersion wavelengths at 775 and 945 nm and its supercontinuum output has distinct visible and IR components as shown in Fig. 3b.14, 22, 23 The IR part of the supercontinuum is used for the Stokes pulses. A voice coil scanner (V-106.11S, PI, Karlsruhe, Germany) controls the time delay of the pump pulses with respect to the Stokes. The pump and Stokes pulses are combined by a dichroic mirror (930 ALP, Omega Optical, Brattleboro, VT) and pass through a 20-cm SF57 glass rod. Additional 10-cm SF57 glass rod is inserted in the Stokes arm to match GVD. The laser beam is filtered by a long-wave-pass filter (740 AELP, Omega Optical) and sent to the microscope. This setup shares the same laser and microscope with the fingerprint FM-CARS experiments, and the microscopy mode can be switched by two flipper mirrors. Fig. 3(a) Experimental setup for CARS experiments at CH (carbon-hydrogen) stretching region. BS, 50:50 beamsplitter; PCF, photonic crystal fiber; L, lens; G, SF57 glass; DM, dichroic mirror; Fl, longwavelength pass filter. (b) Spectrum of supercontinuum from the PCF. The two zero dispersion wavelengths (ZDW, 775 and 945 nm) of the PCF fiber are indicated by the dotted lines.  3.Results3.1.FM-CARS at Fingerprint RegionIn our FM-CARS experiments, the effective pump and Stokes pulses that generate CARS signals at the fingerprint region are the high-energy part of the pump and low-energy part of the Stokes pulses, respectively. Note that the spectral shape of our pump and Stokes pulses are identical. The pump pulse primarily serves as the probe because they have the same time delay as the vibrational excitation (i.e., the time overlap between the effective pump and Stokes pulses). Accordingly, we expect a quadratic dependence of the pump power on CARS signals. Figure 4a shows power dependence of the pump pulse on CARS signals of cyclohexane at 1028 cm−1. It shows the expected quadratic power dependence. Solid curve is a quadratic least-squares fit. The Stokes power is set to be 11 mW in this measurement. The power dependence of the Stokes pulse is also shown in Fig. 4b, in which slight superlinear behavior appears above the Stokes power of 4 mW. Solid line is a linear fit with points below 4 mW power. The pump power of 12 mW is used. This can be understood by the spectral bandwidth and time ordering of our Stokes pulse. In our experiment, the Stokes pulse has spectral components that can act as the probe. This high-energy part of the Stokes, however, is significantly time delayed with respect to the vibrational excitation and its contribution to the measured CARS signal as the probe is significantly less than that of the pump pulse. Accordingly, linear power dependence is observed at low Stokes powers, but slight nonlinear dependence appears at high Stokes powers in Fig. 4b. Fig. 4Power dependence of (a) Pump and (b) Stokes pulses on CARS signals of cyclohexane at 1028 cm−1. (c) Concentration dependence of CARS signal from aqueous NaNO3 solutions. (d) FM-CARS spectra of NaNO3 solutions at three different concentrations. Each trace is vertically displaced for clarity.  Our FM-CARS essentially measures the cross term between the vibrational CARS signal and non-resonant background [2P NR(ω)Re[P R(ω)] in Eq. 1]. Thus, the signal should be linearly proportional to the sample concentration if the nonresonant background P NR(ω) is invariant. Figure 4c shows such linear concentration dependence of CARS signals from aqueous NaNO3 solutions in different concentrations (1050 cm−1 peak of [TeX:] \documentclass[12pt]{minimal}\begin{document}$\mathrm{NO}_{3}^{-}$\end{document} ions is used). Figure 4d shows FM-CARS spectra of NaNO3 solutions at three representative concentrations. Time constant of 1 ms is used in this measurement. From this measurement, we estimate the current detection limit to be ∼10 mM of [TeX:] \documentclass[12pt]{minimal}\begin{document}$\mathrm{NO}_{3}^{-}$\end{document} ions with a 1-ms lock-in time constant. In Fig. 4d, one can see smooth background centered around 1400 cm−1. This is because of the slight different magnitudes of non-resonant backgrounds between the CARS signals generated by the pumps l and 2. The cross-correlation time duration of CARS signals with a glass coverslip (nonresonant sample) is 1.5 ps (FWHM). Meanwhile, the frequency shift between the two CARS signals in FM measurement is ∼20 cm−1, which translates into ∼50 fs time delay between the two pump pulses (pumps 1 and 2). Thus, the nonresonant backgrounds in the CARS signals by each pump pulses have ∼3 % difference (i.e., 50 fs divided by 1.5 ps) in their magnitudes. This difference is not significant for samples with strong resonant CARS signals, but becomes pronounced for samples with weak signals, such as aqueous NaNO3 solutions [Fig. 4d]. This residual nonresonant background limits our detection sensitivity and vibrational selectivity. Figure 5 shows the FM-CARS [Fig. 5a] and spontaneous Raman [Fig. 5b] spectra of stearic (18:0), oleic (18:1) acids, and DHA (22:6) in the fingerprint region. All the vibrational peak positions in Figs. 5a and 5b are correlated within 10 cm−1. Note that we can resolve closely positioned peaks, such as triplet peaks of stearic acid around 1100 cm−1 and doublet of oleic acids in 1260–1300 cm−1. The relative peak intensity distributions in FM-CARS spectra show a small difference from those in spontaneous Raman. This is because of the effect of the spectral shape of our laser and interference between closely lying vibrational resonances. FM-CARS spectra, however, are consistent in different measurements. Fig. 5(a) FM-CARS spectra of stearic (SA, 18:0), oleic (OA, 18: 1) acids and DHA (22:6). (b) Spontaneous Raman spectra of the same fatty acids. Each trace is scaled and vertically displaced for clarity. 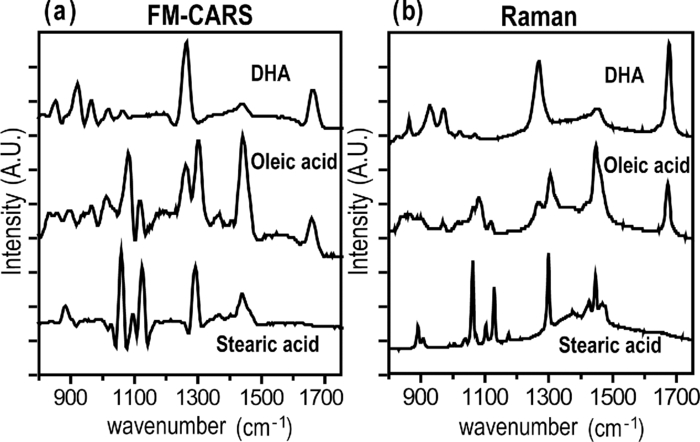 Figurer 6 shows FM-CARS images of a mixture of polystyrene and polymelamine beads at 970, 990, and 1000 cm−1. Each image has 200×200 pixels, and the pixel dwell time is 25 μs. One can clearly see that we can distinguish two polymer species, of which vibrational peak positions are separated by 30 cm−1 (polystyrene and polymelamine have vibrational resonances at 1000 and 970 cm−1, respectively). Fast modulation of vibrational excitation frequency eliminates most of the nonresonant backgrounds as one can see in the image at 990 cm−1. Fig. 6FM-CARS images of polymer beads. This sample is a mixture of polystyrene and polymelamine beads, which have vibrational resonances at 1000 and 970 cm−1, respectively. The images have 200 × 200 pixels and the pixel dwell time is 25 μs. The scale bar is 2 μm.  FM-CARS images of live 3T3-L1 cells are shown in Fig. 7. Lipid droplets inside cells are clearly visible in the images at 1300 and 1460 cm−1, which are twisting and scissor deformation peaks of methylene (− CH2–) groups in lipid acyl chains, respectively [Figs. 7a and 7c]. The off-resonant 1420 cm−1 image [Fig. 7b], however, shows little contrast, demonstrating our ability to suppress nonresonant backgrounds. Note that these images are obtained at the fingerprint region, where lipid CARS signals are weaker than those at 2840 cm−1 by one order of magnitude. Lipid droplets are one of the most studied samples in CARS microscopy.1 They are condensed triglycerides of fatty acids surrounded by various enzymes on their surface.24 Although strong signal levels at 2840 cm−1 indicate the presence of highly packed lipid acyl chains, chemical information from such a single frequency measurement is significantly limited. Fingerprint microspectroscopy or images at multiple frequencies offer further chemical information.8, 25, 26, 27 Figure 7d shows FM-CARS spectra of two lipid droplets marked as A and B in Figs. 7a, 7b, 7c. Their CARS spectra are very similar to that of oleic acid [Fig. 5a], which consists of 18:1 acyl chains. This is consistent with the known fact that most lipid droplets are triglycerides of oleic acids.24 We find that all the lipid droplets in Fig. 7 have similar lipid compositions. Fig. 7FM-CARS images of 3T3-L1 cells at (a) 1300, (b) 1420 and (c) 1460 cm−1. The images have 200 × 200 pixels and the pixel dwell time is 25 μs. The scale bar is 10 μm. (d) FM-CARS spectra of lipid droplets A and B in the images.  We find that chemical compositions of lipid droplets inside cells depend on the culture condition. Figure 8 shows such an example. In this study, we incubate HeLa cells in a medium containing a high concentration (400 μM) of linolenic acids (18:3). We find that most lipid droplets inside the cells after one-day incubation consist of esters of linolenic acids. Figure 8a shows a FM-CARS image taken at 1260 cm−1, which is in-plane olefinic hydrogen bending of methylene groups in lipid acyl chains. Note that this peak is strong only in lipid samples containing highly unsaturated acyl chains.8 The top spectrum in Fig. 8b shows FM-CARS spectrum at one lipid droplet (marked as A in Fig. 8a. Diameter <1 μm); 1 ms time constant is used to obtain this spectrum. The bottom spectrum is taken from bulk linolenic acid. These two spectra are very similar in their peak positions and relative peak ratios. We find that most lipid droplets in this HeLa cell are similar in their lipid compositions. Fig. 8(a) FM-CARS image of a HeLa cell at 1260 cm−1. This cell is incubated with a medium rich in linolenic acid (400 μM) for one day. The image has 200 × 200 pixels and the pixel dwell time is 25 μs. The scale bar is 5 μm. (b) (top) FM-CARS spectrum at the position A in (a), (bottom) FM-CARS spectrum of bulk linolenic acid.  3.2.Spectral Focusing Coherent Anti-Raman Scattereing at CH Stretching RegionFigures 9a and 9b show spectral focusing CARS spectra of bulk organic solvents and fatty acids at the CH (carbon-hydrogen) stretching region, respectively. These spectra are obtained with the fundamental Ti:sapphire laser and PCF supercontinuum as the pump and Stokes pulses, respectively. We find that most hydrocarbon and lipid samples of >1 μm fall in the homodyne regime [P R(ω) ≫ P NR(ω)] and their CARS spectra show distinct vibrational peaks that can be correlated with the Raman peaks.14 Note that the signal intensities in Fig. 9 are much stronger than those in Fig. 5a (fingerprint region). Spectral resolution of a 3060 cm−1 peak of benzene in Fig. 9a is 30 cm−1. Fig. 9Spectral focusing CARS spectra of (a) organic solvents and (b) fatty acids at the CH stretching region. A spectrum is obtained in 0.5 s. All the traces are vertically displaced and scaled for clarity.  Figure 10 demonstrates our approach of combining sensitive CARS imaging at the CH (carbon-hydrogen) stretching mode and chemically informative microspectroscopy at the fingerprint region. Figures 10a and 10b show FM-CARS images at 2850 cm−1 from a mouse skin obtained at different depths in the same area. Figure 10a shows sebaceous gland cells at a depth of 25 μm from the skin surface. It shows numerous lipid droplets inside the gland cells. Figure 10b is from subcutaneous fat cells at a depth of 55 μm. The left top corner area has weak signals due to the shadow effect of gland cells above it. The pixel dwell time is 50 μs, and the pump and Stokes powers are 10 and 1 mW, respectively. Previous CARS investigation reported that sebaceous gland and subcutaneous fat cells have different lipid compositions probed by their CARS spectra at CH (carbon-hydrogen) stretching region (2800–3100 cm−1).28 Figure 10c shows CARS microspectra of these two lipid structures at the fingerprint region. Spectrum A, which is taken from a lipid droplet inside a sebaceous gland cell, shows higher peak intensities at 1300 cm−1 than that of 1260 cm−1, indicating that the lipids are highly saturated. Spectrum B resembles that of pure oleic acid, implying that it primarily consists of mono-unsaturated lipid acyl chains. This finding is consistent with the previous study at the CH (carbon-hydrogen) stretching region.28 Because the fingerprint region contains multiple characteristic vibrational peaks from molecular functional groups, one can obtain more chemical information than in the CH (carbon-hydrogen) stretching region. Their CARS signals, however, are significantly weaker than those at the CH (carbon-hydrogen) stretching region. Combination of the highly sensitive CARS imaging at the CH (carbon-hydrogen) stretching mode and chemically informative microspectroscopy at the fingerprint region will be a powerful microscopy method. Fig. 10CARS Images of a mouse ear measured at 2850 cm−1. (a) Sebaceous gland cells at a depth of 25 μm from the skin surface. (b) Subcutaneous fat cells at a depth of ∼50 μm. The images have 200 × 200 pixels, and the pixel dwell time is 50 μs. The scale bar is 20 μm. (c) FM-CARS spectra at the positions of A in (a) and B in (b). Note the different peak ratios at 1260 and 1300 cm−1 in these spectra. These traces are vertically displaced for clarity.  As demonstrated in Fig. 9, CARS signals from bulk lipid structures are in the homodyne regime.14 Lower concentrated lipid samples, however, fall in the heterodyne regime. Figure 11 shows a CARS image of DPPC lamellar membranes measured at 2840 cm−1. This sample consists of several lipid bilayer membranes merged together and contains regions of different membrane thickness. It also shows the polarization dependence of CARS signals. The laser polarization direction is along the vertical axis and horizontally oriented lipid chains show brighter contrast. Figure 11b shows CARS spectra at the positions of A and B in Fig. 11a. Note that position A has stronger CARS signals than B due to the higher lipid concentration and perpendicular chain orientation with respect to the laser polarization direction. The spectral shapes of A and B, however, are remarkably similar indicating that CARS signals of this sample fall in the heterodyne limit. Note that the CARS spectrum changes its shape, depending on sample concentration. Only in the homo- or heterodyne limits, the spectral shape of measured CARS signals does not depend on the sample concentration. Fig. 11(a) CARS image of DPPC lamellar membranes measured at 2840 cm−1. This image contains 300× 300 pixels and the pixel dwell time is 80 μs. The scale bar is 4 μm. (b) CARS spectra at A and B in (a). Spectral acquisition time is 1 s. These traces are normalized and vertically displaced for clarity.  One can retrieve Raman-equivalent spectrum from the measured CARS signals by the maximum entropy method (MEM).29, 30 This numerical procedure estimates the most probable phase spectrum from the amplitude spectrum without a priori information. Once the phase information is available, pure Raman spectrum can be retrieved by extracting the imaginary part of the CARS signal.30 Figure 12 shows our MEM analysis to obtain Raman-equivalent CARS spectrum. Figure 12a shows the measured CARS spectrum at position A in Fig. 11a. Retrieved imaginary part of the CARS spectrum is shown in Fig. 12b. We follow the reported MEM procedure in Ref. 30 to obtain this spectrum. Fig. 12Raman spectrum retrieved by the maximum entropy method (MEM). (a) Measured CARS spectrum of DPPC membrane at A in Fig. 11a. (b) Retrieved Raman-equivalent CARS spectrum by the MEM method. 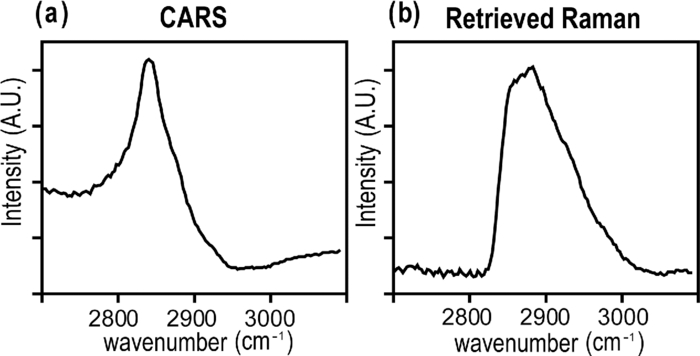 4.DiscussionAs demonstrated in the membrane study of Fig. 11, our spectral focusing CARS method has a comparable sensitivity as the narrowband CARS one. In our other publication,8 we have demonstrated that both methods have same theoretical effciency of signal generation under the condition of the same laser power and pulse durations. Its ability of rapid switching of the excitation frequency, however, allows instant CARS spectroscopy measurement of microscopic samples. Alternatively, one can obtain single-frequency CARS images at several characteristic vibrational frequencies and perform ratio-metric image analysis.6 In both cases, the fast frequency-switching capacity is a key requirement for success of the methods. In this work, we use single broadband laser pulses for the fingerprint region and a combination of the fundamental Ti:sapphire output and PCF supercontinuum for the CH (carbon-hydrogen) stretching vibrations. One can use other femtosecond laser systems, such as the one with a synchronously pumped OPO.15 Because generation of different color pulses is easier with femtosecond pulses, spectral focusing CARS has more available laser configuration. The frequency scanning is performed by a simple time delay, which is robust and fast. The spectral focusing CARS method suffers from the nonresonant background. In the fingerprint region, where individual vibrational peaks are narrow and CARS signals fall in the heterodyne limit, we can obtain Raman-like CARS signals by applying an FM method coupled with lock-in signal detection.8, 19 The FM-CARS technique presented in this work not only removes image backgrounds from varying nonresonant backgrounds over the samples but detected CARS spectrum also looks similar to the spontaneous Raman. Note that the measured signals in our FM-CARS method is 2P NR(ω)Re[P R(ω)], which is not directly proportional to the sample concentration. The sample concentration, however, can be obtained if we obtain the nonresonant background separately [i.e., P NR(ω)]. In the CH (carbon-hydrogen) stretching region, most lipid-rich structures, such as lipid droplets, fall in the homodyne limit and measured CARS signal can be used directly for image analysis. For low concentrated lipid samples such as lipid membranes, we can retrieve a Raman-equivalent vibrational spectrum with the help of the MEM method. Hyperspectral imaging (i.e., construction of image contrast with vibrational spectra measured at entire microscopy sample positions) is ideal in terms of chemical information.17 In biomedical imaging applications, however, imaging speed and sensitivity are also very important. As we demonstrate in this work, a combination of single-frequency CARS imaging and in situ microspectroscopy provides an alternative approach to the hyperspectral vibrational imaging. Ratio-metric imaging that utilizes CARS images at a few characteristic vibrational frequencies is also a promising approach. Although we demonstrate great sensitivity of our current CARS setup, it is not yet optimal for the CH (carbon-hydrogen) stretching vibrations. The maximum power of the PCF supercontinuum pulses in the current setup is only 1 mW, which is an order of magnitude smaller than that of the pump pulses (∼ 10 mW). Because nonlinear photodamage is significantly lower with the pulses of 1-μm wavelength than those of 800 nm, more CARS signals can be obtained by increasing the Stokes power, which is available with other types of laser sources.15 Also note that we pump the PCF with significantly higher pump power (∼ 15 nJ) compared to the earlier demonstrations by other groups (typically, 2–3 nJ).14, 22, 23 We observe that the spectral shape of IR supercontinuum changes significantly over the pump laser power. At a lower pump power, the IR pulse spectrum is broader and we are not able to achieve 30 cm−1, even with a larger amount of GVD. As one can see in Fig. 3b, our IR supercontinuum has a single Lorentzian spectral shape. We find that the IR pulses of this spectral shape generate CARS signals with the highest spectral resolution. Note that the spectral shape of our CARS signal is robust. Once the fine alignment of PCF continuum generation is done, we seldom need to retweak the setup over a half day. 5.ConclusionThe spectral focusing CARS method is beneficial over the narrow CARS one in its simplicity and lower cost. Moreover, it allows rapid frequency switching via time delay and enables in situ microspectroscopy measurements. In the vibrational fingerprint region, we introduce an FM approach to retrieve Raman-like CARS signals. In the CH (carbon-hydrogen) stretching region, a combination of single-frequency CARS and microspectroscopy coupled with the maximum entropy method can reveal chemical structures of microscopy samples. We demonstrate both CARS imaging and microspectroscopy with various biologically samples. The combination of CARS imaging and in situ micro spectroscopy will be a powerful tool for study of cells and tissues. AcknowledgmentsThe authors gratefully acknowledge the Welch Foundation for the support of personnel (Project No. F-1663). B.C.C. and S.H.L. thank Dr. Payne Chang for providing the mouse ear used in this study. S.H.L. also thanks Ms. Sook Kyung Park for providing the 3T3-L1 cells. ReferencesC. Evans and
X. S. Xie,
“Coherent anti-Stokes Raman scattering microscopy: chemical imaging for biology and medicine,”
Ann. Rev. Anal. Chem., 1 883
–909
(2008). https://doi.org/10.1146/annurev.anchem.1.031207.112754 Google Scholar
M. Müller and
A. Zumbusch,
“Coherent anti-Stokes Raman scattering microscopy,”
ChemPhysChem, 8 2156
–2170
(2007). https://doi.org/10.1002/cphc.200700202 Google Scholar
J. X. Cheng,
“Coherent anti-Stokes Raman scattering microscopy,”
Appl. Spec., 61 197A
–208A
(2007). https://doi.org/10.1366/000370207781746044 Google Scholar
J. X. Cheng and
X. S. Xie,
“Coherent anti-Stokes Raman scattering microscopy: Instrumentation, theory, and applications,”
J. Phys. Chem. B, 108 827
–840
(2004). https://doi.org/10.1021/jp035693v Google Scholar
E. O. Potma, D. J. Jones, J. X. Cheng, X. S. Xie, and
J. Ye,
“High-sensitivity coherent anti-Stokes Raman scattering microscopy with two tightly synchronized picosecond lasers,”
Opt. Lett., 27 1168
–1170
(2002). https://doi.org/10.1364/OL.27.001168 Google Scholar
M. Zimmerley, C. Lin, D. V. Oertel, J. M. Marsh, J. L. Ward, and
E. O. Potma,
“Quantitative detection of chemical compounds in human hair with coherent anti-Stokes Raman scattering microscopy,”
J. Biomed. Opt., 14 044019
(2009). https://doi.org/10.1117/1.3184444 Google Scholar
H. W. Wang, T. T. Le, and
J. X. Cheng,
“Label-free imaging of arterial cells and extracellular matrix using a multimodal CARS microscope,”
Opt. Commun., 281 1813
–1822
(2008). https://doi.org/10.1016/j.optcom.2007.07.067 Google Scholar
B.-C. Chen, J. Sung, and
S.-H. Lim,
“Chemical imaging with frequency modulation coherent anti-Stokes Raman scattering (FM-CARS) microscopy at vibrational fingerprint region,”
J. Phys. Chem. B., 114 16871
–16880
(2010). https://doi.org/10.1021/jp104553s Google Scholar
W. Langbein, I. Rocha-Mendoza, and
P. Borri,
“Coherent anti-Stokes Raman micro-spectroscopy using spectral focusing: theory and experiment,”
J. Raman Spec., 40 800
–808
(2009). https://doi.org/10.1002/jrs.2264 Google Scholar
M. Muller and
J. M. Schins,
“Imaging the thermodynamic state of lipid membranes with multiplex CARS microscopy,”
J. Phys. Chem. B, 106 3715
–3723
(2002). https://doi.org/10.1021/jp014012y Google Scholar
M. N. Slipchenko, T. T. Le, H. Chen, and
J. X. Cheng,
“Compound Raman microscopy for high-speed vibrational imaging and spectral analysis of lipid bodies,”
J. Phys. Chem. B, 113 7681
–7686
(2009). https://doi.org/10.1021/jp902231y Google Scholar
T. Hellerer, A. M. K. Enejder, and
A. Zumbusch,
“Spectral focusing: high spectral resolution spectroscopy with broad-bandwidth laser pulses,”
Appl. Phys. Lett., 85 25
–27
(2004). https://doi.org/10.1063/1.1768312 Google Scholar
E. T. J. Nibbering, D. A. Wiersma, and
K. Duppen,
“Ultrafast nonlinear spectroscopy with chirped optical pulses,”
Phys. Rev. Lett., 68 514
–517
(1992). https://doi.org/10.1103/PhysRevLett.68.514 Google Scholar
A. F. Pegoraro, A. Ridsdale, D. J. Moffatt, Y. Jia, J. P. Pezacki, and
A. Stolow,
“Optimally chirped multimodal CARS microscopy based on a single Ti:sapphire oscillator,”
Opt. Express, 17 2984
–2996
(2009). https://doi.org/10.1364/OE.17.002984 Google Scholar
I. Rocha-Mendoza, W. Langbein, and
P. Borri,
“Coherent anti-Stokes Raman microspectroscopy using spectral focusing with glass dispersion,”
Appl. Phys. Lett., 93 201103
(2008). https://doi.org/10.1063/1.3028346 Google Scholar
I. Rocha-Mendoza, W. Langbein, P. Watson, and
P. Borri,
“Differential coherent anti-Stokes Raman scattering microscopy with linearly chirped femtosecond laser pulses,”
Opt. Lett., 34 2258
–2260
(2009). https://doi.org/10.1364/OL.34.002258 Google Scholar
B.-C. Chen and
S.-H. Lim,
“Optimal laser pulse shaping for interferometric multiplex coherent anti-Stokes Raman scattering microscopy,”
J. Phys. Chem. B, 112 3653
–3661
(2008). https://doi.org/10.1021/jp710743k Google Scholar
S.-H. Lim, A. G. Caster, and
S. R. Leone,
“Single-pulse phase-control interferometric coherent anti-Stokes Raman scattering spectroscopy,”
Phys. Rev. A, 72 041803
(2005). https://doi.org/10.1103/PhysRevA.72.041803 Google Scholar
W. Langbein, I. Rocha-Mendoza, and
P. Borri,
“Single source coherent anti-Stokes Raman microspectroscopy using spectral focusing,”
Appl. Phys. Lett., 95 081109
(2009). https://doi.org/10.1063/1.3216073 Google Scholar
J. Sung, B.-C. Chen, and
S.-H. Lim,
“Fast three-dimensional chemical imaging by interferometric multiplex coherent anti-Stokes Raman scattering microscopy,”
J. Raman Spec., https://doi.org/10.1002/jrs.2647 Google Scholar
F. Ganikhanov, C. Evans, B. G. Saar, and
X. S. Xie,
“High-sensitivity vibrational imaging with frequency modulation coherent anti-Stokes Raman scattering (FM CARS) microscopy,”
Opt. Lett., 31 1872
–1874
(2006). https://doi.org/10.1364/OL.31.001872 Google Scholar
S. Murugkar, C. Brideau, A. Ridsdale, M. Naji, P. K. Stys and
H. Anis,
“Coherent anti-Stokes Raman scattering microscopy using photonic crystal fiber with two closely lying zero dispersion wavelengths,”
Opt. Express, 15 14028
–14037
(2007). https://doi.org/10.1364/OE.15.014028 Google Scholar
K. M. Hilligosoe, T. V. Andersen, H. N. Paulsen, C. K. Nielsen, K. Molmer, S. Keiding, R. Kristiansen, K. P. Hansen, and
J. J. Larsen,
“Supercontinuum generation in a photonic crystal fiber with two zero dispersion wavelengths,”
Opt. Express, 12 1045
–1054
(2004). https://doi.org/10.1364/OPEX.12.001045 Google Scholar
B. Alberts, A. Johnson, J. Lewis, M. Raff, K. Roberts, and
P. Walter, Molecular Biology of the Cell, Garland Science, New York
(2002). Google Scholar
J. R. Beattie, S. E. J. Bell, and
B. W. Moss,
“A critical evaluation of raman spectroscopy for the analysis lipids: fatty acid methyl esters,”
Lipids, 39 407
–419
(2004). https://doi.org/10.1007/s11745-004-1245-z Google Scholar
C. B. Fox, R. H. Uibel, and
J. M. Harris,
“Detecting phase transisions in phosphatidylcholine vesicles by Raman microscopy and self-modeling curve resolution,”
J. Phys. Chem. B, 111 11428
–11436
(2007). https://doi.org/10.1021/jp0735886 Google Scholar
R. J. Meier, A. Csiszar, and
E. Klumpp,
“On the interpretation of the 1100 cm-l Raman band in phospholipids and other alkyl-containing molecular entities,”
J. Phys. Chem. B., 110 5842
–5844
(2006). https://doi.org/10.1021/jp060420w Google Scholar
C. L. Evans, E. O. Potma, M. Puoris'hagg, D. Cote, C. P. Lin and
X. S. Xie,
“Chemical imaging of tissue in vivo with video-rate coherent anti-Stokes Raman scattering microscopy,”
Proc. Natl. Acad. Soc. U.S.A., 102 16807
–16812
(2005). https://doi.org/10.1073/pnas.0508282102 Google Scholar
H. A. Rinia, N. J. Burger, M. Bonn, and
M. Muller,
“Quantitative label-free imaging of lipid composition and packing of individual cellular lipid droplets using multiplex CARS microscopy,”
Biophys. J., 95 4908
–4914
(2008). https://doi.org/10.1529/biophysj.108.137737 Google Scholar
E. M. Vartiainen, H. A. Rinia, M. Muller and
M. Bonn,
“Direct extraction of Raman line-shapes from congested CARS spectra,”
Opt. Express, 14 3622
–3630
(2006). https://doi.org/10.1364/OE.14.003622 Google Scholar
|


