
|
|
1.IntroductionEven though brain cancers are not among the most common types of cancer accounting for approximately 3% of all tumors,1 the therapy of brain tumors is a very important issue. First, they are especially abundant in children and adolescents. Here 22.9% of all cancers diagnosed originate in the brain and only leukaemia is more prevalent than tumors of the central nervous system.1 Second, since metastases are the most prevalent type of brain tumors, dealing with brain cancer will give valuable insight into the process of metastasizing, which is, to a large extent, responsible for the lethality of cancer. For the successful treatment of brain cancers, a precise assignment of the tumor type and grade is of utmost importance as is the detection of the tumor in an early development stage. These prerequisites of successful therapy need to be met, because medical treatment differs substantially for individual forms of tumors. This is again due to the fact that metastases are far more common than primary tumors, and successful treatment requires removal of the primary tumor as well. Furthermore, during surgery it is crucial to remove the cancerous tissue as completely as possible to prolong the time without symptoms and the survival rate of the patient.2 A particular challenge in neurosurgery is to preserve normal brain tissue and minimize deficits in brain functions. Nowadays, the commonly used standard method in neuropathology is staining with haematoxylin and eosine (H&E). The dye eosine stains proteins and the cytoplasm bright pink, while haematoxylin stains basophilic structures like DNA blue-purple. However, this rather simple method is limited to ex vivo investigations. According to the importance of cancer treatment not only in the brain tremendous efforts have been undertaken in order to improve and invent imaging techniques for an early detection of tumor tissue. Noninvasive approacheses for brain imaging to be stated here are computer tomography, magnetic resonance tomography (MRI), and positron emission tomography (PET).3 Immunohistochemistry is used to complement histopathology,4 whereas elastic light scattering,5 autofluorescence, optical coherence tomography,6 and fluorescent labeling2 are recent experimental methods that have been applied intraoperatively to identify cancerous tissue in vivo. In fluorescence imaging fluorescing molecules like fluorescein bound to human serum albumin (HSA)2 or the porphyrine derivative 5-aminolevulinic acid7 are injected. Due to the faster metabolic rate of tumor cells the fluorescing particles are enriched over time within the cancerous tissue. A few hours after application the tissue is illuminated by laser light during surgery and the fluorescing cancerous tissue is removed. This allows for a more thorough resection of the tumor compared with conventional methods.2 But despite its advantages, this technique suffers from severe restrictions. First of all, brain cancers do not accumulate fluorophores if the blood–brain barrier is still intact. This is especially true in the early stages of the cancer. In later stages the barrier is often damaged and fluorophores can penetrate more easily from the blood into cancerous tissue. As shown in Ref. 2, only 84% of the cancer absorbed the fluorescing species. Second, fluorescent labeling does not allow for tumor typing, because the dyes are not specific labels. This is, in principle, also true for other beforehand mentioned brain imaging techniques as MRI and PET. The tumor detection is based on a different enrichment of a marker substance in cancerous and physiological tissue. Third, fluorescence-based techniques suffer from the limited stability of the fluorophores, which tend to photobleach upon laser irradiation. Other optical methods like optical coherence tomography (OCT) and elastic light scattering use differences in physical properties, e.g., refractive index, for differentiation of cancerous and normal tissue. The work presented here aims at developing a fast, label-free, sensitive, and selective diagnostic tool for the investigation of cancerous tissue potentially even in vivo. To address these fundamental problems in current neuropathology and neurosurgery, vibrational spectroscopic methods have been used. Infrared (IR) and Raman spectroscopy — as longstanding and well-established methods for tissue typing and grading — have been applied to determine the chemical composition of tissue samples in order to validate the performance of the multiphoton microscopy approach. On this basis, nonlinear imaging techniques like coherent anti-Stokes Raman scattering (CARS), second harmonic generation (SHG), and two photon excited fluorescence (TPEF) have been employed for a rapid and label-free visualization of the morphology and composition of brain tissue. Raman and IR spectra provide molecule specific fingerprints. Since each cell or tissue has a distinct chemical composition, biological species or tissue types can be identified by their Raman and IR spectra.8, 9 Consequently, these methods are increasingly used for disease recognition.10 In the context of brain tissue, Fourier transform infrared (FTIR) and Raman microspectroscopic imaging have already been applied to classify malignant gliomas,11, 12 to determine the primary tumor of brain metastases13, 14, 15, 16 to detect meningioma17 and to identify tumors in mice and rats.18, 19, 20 However, even though IR and Raman spectroscopy are promising, they have some method-intrinsic limitations. IR spectroscopy suffers from the strong absorption of water, which is the reason why its application is hampered in vivo. 21, 22, 23 Furthermore, the wavelength of the IR light (∼2.5–10 μm) is larger than that of visible light; hence high optical resolution on a subcellular level cannot be achieved in IR microspectroscopy. Raman microspectroscopy on the other hand uses visible or near-IR light and is applicable in aqueous environment. However, the Raman scattering efficiency is very low. Therefore, integration times in the order of seconds per spectrum are needed and fast data acquisition cannot be realized for imaging. Furthermore weak Raman signals of tissue are often overwhelmed by the tissues’ autofluorescence. Both limitations can be overcome by using a nonlinear version of Raman scattering, i.e., coherent anti-Stokes Raman scattering (CARS) microscopy, has been applied. In CARS the sample is illuminated by two pulsed lasers whose frequencies differ by the frequency of the molecular vibration to be imaged.24, 25 The lasers are temporally and spatially overlapped on the sample at the focus of the microscope. The vibrational level selected for imaging is then selectively populated, because the beating frequency of both pulses corresponds to the vibration of interest and forces the molecules to vibrate. The excitation scheme is depicted in Fig. 1b. Due to the nonlinear enhancement the CARS signal is much stronger than the spontaneous Raman signal. Therefore, CARS allows for fast data acquisition while preserving the chemical specificity of vibrational spectroscopy. Using single-band CARS microscopy, i.e., imaging the spatial distribution of a single Raman band in a microscope, it is possible to achieve image acquisition with video repetition rate.26 This fast image acquisition rate of single-band CARS comes at the price of reduced chemical information compared to recording the full Raman and/or IR spectrum. However, the virtual freedom of the image from single photon fluorescence and the ability to follow biological processes on timescales of fractions of seconds with subcellular resolution combined with its relative simplicity in the experimental setup is unparalleled for all currently available optical imaging techniques. But two drawbacks have to be kept in mind. First, other nonlinear processes generate a method-intrinsic background at the CARS signal wavelength limiting the image contrast. Second, as the signal depends on the square of the concentration of scattering molecules spectral contributions of less abundant molecules are small. But despite these drawbacks it has been proven to be an extremely sensitive method for imaging lipids and other molecules rich in aliphatic C-H-stretching vibrations capable of investigating normal brain tissue and brain tumors.27, 28 In addition a variety of skin disorders such as, e.g., human basal cell carcinoma29 can be probed by CARS microscopy. In the present work we have combined CARS microscopy with SHG and TPEF imaging to obtain multimodal nonlinear spectroscopic images.30 SHG — as CARS — is a nonlinear scattering process. A diagram of the process is displayed in Fig. 1c. In SHG, two photons are fused to a single photon of twice the energy. This effect is limited to structures lacking inversion symmetry and depends on the square of the concentration of scatterers. Since the SHG signal is the coherent superposition of the emissions of single molecules only highly ordered molecular structures give rise to an intense signal. In tissue, the most abundant molecule having a large SHG cross section is collagen. The collagen distribution and structure is an important indicator for tumor type and grade, since the metastatic potential of tumors correlates with the degradation of collagen.31 Furthermore the structure of collagen governs the delivery of therapeutics in tumors.32 Beside these tumor-specific applications SHG allows for imaging microtubules in nerve tissue and connective tissue and is thence a promising technique for visualizing the composition and morphology of brain tissue.33 For the investigation of different diseases like liver fibrosis or chronic arthritis SHG has been successfully applied to visualize the collagen network.34, 35 The third applied nonlinear imaging method is TPEF. The scheme of TPEF is depicted in Fig. 1d. Here, two NIR photons are simultaneously absorbed and hence, TPEF is only observed within the laser focal spot where the photon density is highest. Therefore, bleaching effects and out of focus fluorescence are greatly reduced. Another advantage is the use of NIR illumination. Here, the depth penetration in tissue is highest. For all these nonlinear techniques a pulsed laser source is required to supply a high photon density at low average powers to avoid photodamage. Summarizing what has been laid out before the scope of this paper is to present a combination of spectroscopic techniques first for a precise and sensitive investigation of brain tissue and second for a rapid detection of cancerous tissue during surgery. Based on IR and Raman studies particular emphasize is put on CARS, SHG, and TPEF imaging as these nonlinear spectroscopic modalities contain the potential for fast bedside imaging applications in clinics.36 The manuscript is structured as follows. First, the methods and the experimental setup are presented. Afterwards, results are presented from the application of nonlinear imaging to examine the morphology of brain tissue sections from a domestic pig. To verify our findings we have checked the results using conventional H&E staining microscopy and IR and Raman studies. Then, the application of CARS imaging to investigate human brain tumor sections is displayed and discussed. 2.Methods2.1.Nonlinear Microscopic ImagingIn Fig. 1 the experimental setup for CARS, SHG, and TPEF imaging is depicted. This multimodal nonlinear imaging experimental setup is based on a previously reported setup for CARS microscopy.37 The main laser source is a coherent Mira HP Ti:Sa-Laser pumped by a Verdi-V18 Nd-Vanadate laser. The laser can be operated in fs or ps-pulse mode. For superior spectral resolution in CARS microscopy the laser is operated in the ps-pulse mode at 830 nm. A typical Raman line has a bandwidth of 2 to 10 cm−1. This corresponds very well to the linewidth of a ps laser, as a 1 ps laser pulse at 800 nm has a bandwidth of 15 cm−1 assuming a Gaussian line profile. A fraction of the laser serves as the Stokes pulse, another fraction is used to pump an optical parametric oscillator (OPO, APE, Berlin, Germany) generating the pump wavelength. It is widely tunable from 500 to 800 nm, allowing for imaging in the wavenumber region between 500 and 4000 cm−1. Both pulse trains are spatially and temporally overlapped, and subsequently fed into a commercial laser scanning microscope (LSM 510 Meta, Zeiss, Jena, Germany). To scan large sample areas a 10×/NA 0.3 EC Plan-Neofluar (Zeiss) has been used. The field of view is 1.2×1.2 mm2. Typical parameters for image acquisition are 1024×1024 pixels, 2.5 μs integrations time per pixel, averaging of eight single images, resolution 1.2 μm. For larger areas of interest, a mosaic of several single images is acquired. For SHG and TPEF imaging only the Ti:Sa-laser is used at 826 nm working in the ps-mode. In the microscope several stacked filters (Thorlabs, Newton, New Jersey; Omega Optical, Brattleboro, Vermont; LOT, Darmstadt, Germany) are used to separate the signal from the lasers used for excitation. For CARS imaging a set of short pass filters from Thorlabs and Omega optics has been used. The typical laser power at the sample is in the order of 50 mW for CARS microscopy. For SHG imaging a very narrow laser line bandpass filter centred at 413 nm has been employed (LOT) in combination with a stack of short pass filters from Omega optics and Thorlabs. For TPEF the internal filters of the microscope have been used. For image analysis and image processing LSM image examiner (Zeiss), LSM image browser (Zeiss) and ImageJ (Wayne Rasband, NIH) have been applied. Fig. 1(a) Setup for CARS, SHG, and TPEF imaging. A Ti:Sa ultrafast laser oscillator is operated in the ps-pulsing mode for high spectral resolution in CARS microscopy (∼10 cm−1). One fraction of the laser serves as Stokes beam or as excitation laser for SHG and TPEF imaging. The second fraction pumps an optical parametric oscillator (OPO) from APE generating the tuneable pump laser for CARS imaging in the range from 500–4000 cm−1. Pump and Stokes laser are recombined in space and time and fed into a commercial laser scanning microscope (Zeiss LSM 510 Meta). The signal is separated from the exciting lasers by a set of filters (Thorlabs, LOT, Omega Optical, Zeiss) and detected using a photomultiplier tube. CARS and SHG as shown in (b) and (c) are nonabsorptive processes. The CARS process requires simultaneous illumination by two lasers whose difference in frequency matches a vibrational resonance (b). The emitted light is shorter in wavelength than the wavelengths of the illuminating lasers. But this process is not background free. Other nonlinear processes also generate photons at the CARS signal wavelength, reducing the image contrast. In SHG two photons of longer wavelength are fused to form an elastically scattered photon of twice the energy. This process is only allowed in noncentrosymmetric media. Therefore this method allows for selective imaging of nonsymmetric structural proteins like collagen. In (d) the principle of TPEF imaging is depicted. By simultaneous absorption of two near infrared photons the molecules are excited to a higher electronic state and emit light of shorter wavelength when relaxing to the electronic ground state.  2.2.Raman Spectroscopic Imaging and Data AnalysisRaman images were collected in backscattering mode using a commercial microscopic Raman system (RXN1 Microprobe, Kaiser Optical Systems, Ann Arbor, MI, USA). The system consists of a multi-mode diode laser at 785 nm emission (Invictus – Laser from Kaiser optical system), an f/1.8 spectrograph with a holographic transmissive grating (Kaiser) and a Peltier-cooled, back-illuminated, deep-depletion CCD detector (Andor Technology, Belfast, UK). The microscope is coupled to the Raman system by fiber optics. Raman images were recorded in the serial mapping mode at 10 μm step size with 10 s exposure time per spectrum using a 100×/NA 0.9 objective. Each Raman spectrum covers the range of 200 to 3450 cm−1 at a spectral resolution of 4 cm−1. The acquisition software Holograms (Kaiser) automatically performs cosmic spike removal, wavelength calibration and intensity calibration. The Raman images were imported into Matlab (The Mathworks, Natick, MA, USA) for pre-processing. In-house written scripts were applied for background subtraction, baseline correction and vertex component analysis (VCA). The application of VCA to reconstruct Raman images has recently been described in detail.38 Briefly, given a set of mixed hyperspectral vectors and considering that each vector is a linear combination of spectral signatures, linear unmixing aims at estimating the number of reference substances, also called endmembers, their spectral signatures and their abundance fractions. If the number of substances and their signatures are not known, hyperspectral unmixing falls into the class of blind source separation problems. VCA offers an unsupervised solution to the blind source separation problem which was first described in 2005.39 VCA represents the image raw data in a space of smaller dimensionality aiming to retain all relevant information. Scope of VCA is that endmembers represent spectra of pure chemical constituents. Then, scores denote the concentration of the endmember spectra. The VCA algorithm iteratively projects data onto a direction orthogonal to the subspace spanned by the endmembers already determined. The new endmember signature corresponds to the extreme of the projection. The algorithm iterates until all endmembers are exhausted. Finally, the dimensionality of the procedure is reduced to a few endmembers, and all other spectra are expressed as linear combinations of these endmembers. 2.3.Fourier Transform Infrared ImagingFTIR images were collected in transmission mode using a commercial FTIR spectrometer (model 670, Varian, Agilent Technologies, Santa Clara, California) and an FTIR microscope with a 64×64 focal plane array detector (model 620, Varian). The microscope was equipped with a Cassegrain 15×/NA 0.4 objective. The microscope chamber was enclosed in a home-build box and purged by dry air to reduced spectral contributions from water vapor. Each image covers an area of 350×350 μm2 with each pixel corresponding to an area of 5.5×5.5 μm2. The mosaic data acquisition mode enables to assess larger sample areas by acquiring a series of FTIR images and composing them to one image. For the current work a 3×2 mosaic was collected covering areas of 1050×700 μm2. Each IR spectrum was acquired in the interval 900 to 4000 cm−1 at a spectral resolution of 4 cm−1 with a zero filling factor 1 and Blackman Harris term 3 apodization. The data sets were processed using the program Cytospec ( www.cytospec.com) and Matlab. After baseline correction and removal of low intensity spectra, K-means cluster analysis was used to partition the data set into K clusters so that the differences between the data within each cluster are minimized and the differences between clusters are maximized according to some defined distance measure. Here, the K-means cluster algorithm used multiplicative signal correction for intensity normalization, squared Euclidean distances, five clusters and the spectral regions from 900 to 1800 cm−1. 2.4.Tissue SpecimensFor CARS, SHG, and TPEF imaging of domestic pig brain tissue, unprocessed fresh cerebral tissue from a local slaughterhouse has been shock frozen in liquid nitrogen. Tissue sections of 20 to 50 μm thickness have been prepared using a Leica microtome model CM 3050 S. Parallel sections were stained with haematoxylin and eosine using a standard protocol. The stained sections were investigated by brightfield and laser scanning fluorescence microscopy. The unstained sections have been analyzed by CARS, SHG, and TPEF microscopy. Tumor tissue specimens from human brain neoplasms were procured during surgery at the university hospital in Jena. Tissue was shock frozen and cryostat sections of 10 μm thickness were cut. Slides were H&E stained and examined with brightfield microscopy by the neuropathologist Dr. Romeike. Parallel unlabeled sections were investigated by FTIR, Raman and CARS microscopy. 3.ResultsTo illustrate the potential of the nonlinear imaging methods in the field of neurosurgery with respect to conventional H&E staining the cerebellum of a domestic pig has been investigated. At H&E stained sections different brain cell types like Purkinje cells and granule cells as well as the cell nuclei, which are especially abundant in the granule cell layer, were identified by the neuropathologist Dr. Romeike. White and grey matter consisting of granule cell layer, Purkinje cell layer and the molecular layer are discernible. Furthermore, the white matter containing the myelin fibres for signal transmission, the arachanoid membrane, which envelopes the brain, and smaller and larger blood vessels penetrating the brain transporting oxygen and nutrients were discriminated in the H&E image as shown in Figs. 2a, 3a, 4a [see Fig. 2a for an overview and Figs. 3a and 4a for more detailed H&E images as indicated by the boxes in Fig. 2]. On the other hand, the CARS, SHG, and TPEF images 2(b) and 2(c) of the parallel section show at similar accuracy the basic morphology of the sample. As the field of view using a 10× objective was smaller than the tissue section, the H&E, CARS, SHG, and TPEF images were composed of 15×15 single images. CARS at the CH-stretching vibration of 2850 cm−1 shows a very pronounced signal in the white matter, since the nerve fibers are rich in fatty acids, which give rise to an intense CARS signal.28 Even the orientation of the fibres can be visualized, which is a particularly interesting capability of this method. In this respect, it seems very likely that polarization sensitive detection schemes27, 33, 40 will highlight the orientation of the nerve fibres in the brain with higher contrast. The gray matter appears darker in the CARS image. Fig. 2Comparison of (a) H&E, (b) CARS at 2850 cm−1, and (c) TPEF/SHG images of a cerebellum tissue section of a domestic pig. Similar information can be extracted using either H&E staining or nonlinear imaging methods. H&E staining visualizes the morphology of the cerebellum (a); the boxed region 1 and 2 are depicted in Figs. 3 and 4 for more detailed views. CARS allows us to differentiate white (green) and gray matter (blue) (b). In (c) a combined SHG and TPEF image shows the SHG emission (green) of the arachnoid membrane. In the TPEF channel (blue) (excitation 835 nm, emission 435–485 nm) the white matter appears darker than the grey matter and the granule layer is faintly accentuated. 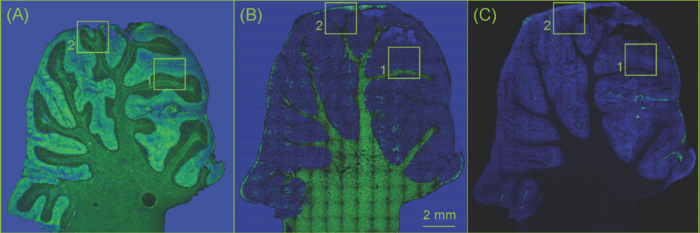 Fig. 3Comparison of a H&E stained section (a) and a composite CARS (green channel), SHG (red) and TPEF (blue) image of an unstained parallel section (b) of cerebellum of a domestic pig as indicated by the boxed area 1 of Fig. 2. This enlarged view (a) shows fine details on single cell level, the white matter with few nuclei, the granule cell layer with its extremely high density of small neurons, the larger Purkinje cells adjacent to the granule layer, blood vessels, and the arachnoid membrane. Except for the cell nuclei, single Purkinje cells and blood vessels, the basic structural components are also visible in the composite CARS (green), SHG (red), and TPEF (blue) image (b).  In Fig. 2c the spatial distributions of autofluorophores (TPEF, blue) and collagen (SHG, green) is displayed. For excitation the NIR laser was tuned to 826 nm. The TPEF signal has been detected in the range between 435–485 nm, hence the SHG signal, which appears at 413 nm is spectrally filtered and excluded. The image faintly shows the granule cell layer with its large amount of nuclei. The white matter appears darker than the uniformly illuminated gray matter. This is due to the fact, that several fluorophores are excited simultaneously, i.e., two-photon transitions in elastin, collagen, and NAD(P)H are excited within the bandwidth of the laser pulse.41 They all add to the signal in the spectral detection window and, consequently, their individual contributions are difficult to separate by the time-integrated measurements performed here. Since these molecules are distributed along the cellular structures, the TPEF image shows very well the morphology of the sample. SHG on the other hand selectively displays the arachnoid membrane which is composed of collagen. To visualize fine morphological details of the sample CARS, TPEF, and SHG imaging has been performed and a composite image is displayed in Fig. 3b. CARS allows to differentiate white (bright green) and gray matter. The arachnoid membrane, which is to a large extent composed of ordered collagen, is exclusively visualized by SHG (red), while TPEF allows to faintly discern the granule layer of the gray matter (blue). However, fine structural details on single cell level like single cell nuclei could not be visualized, which can be seen in the H&E image in Fig. 3a showing nuclei of the granule cell layer and single Purkinje cells. In Fig. 4 the boxed area 2 of Fig. 2 is magnified. The CARS image (B) allows visualizing white and gray matter as well as the molecular layer, the outermost layer of the gray matter. To increase the CARS image contrast a nonresonant image at 2700 cm−1 has been subtracted from a resonant CARS image following Refs. 42, 43 [Fig. 4c] resulting in a contrast rich image, which clearly allows to separate white and gray matter. However, even though the contrast improved significantly, single cells and the granule layer are not discernable at this level of optical magnification. Fig. 4Comparison of a H&E stained image of the boxed area 2 of Fig. 2 with CARS, SHG, and TPEF images of a parallel unstained section. (a) Cellular details are visible in the H&E stained image as assigned in Fig. 3a. The corresponding CARS image (b) shows white and grey matter and highlights the outermost layer of the cerebellum, the molecular layer. To increase the image contrast, a nonresonant CARS image at 2700 cm−1 has been subtracted resulting in a contrast rich image (c). The white matter appears bright, while the grey matter is much darker. Using TPEF and SHG however in (d), the granule cell layer is faintly visible (TPEF, blue), while SHG selectively highlights areas of densely packed and ordered collagen fibres (green), which are not exclusively within the arachnoid membrane but also in blood vessels. The size of each image is indicated by the scale bar of 200 μm. 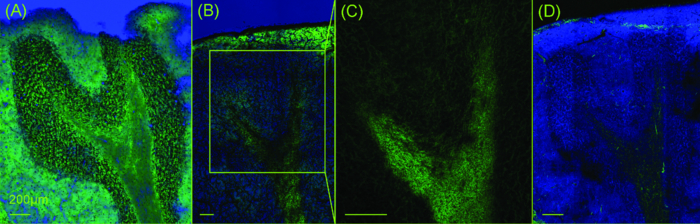 Additional TPEF and SHG imaging reveals further details as shown in Fig. 4d. Besides visualizing the arachnoid membrane the collagen structures of small blood vessels pervading the brain become visible by SHG imaging (green). Again the granule layer adjacent to the white matter is visible in the TPEF channel (blue). The nonlinear imaging modality pursued in this work has proven capable of resolving structural details of the sample comparable to H&E staining on a size scale larger than single cells. Hence, it can be concluded that such approach will be suited for resolving the morphology and tumor margins of primary brain tumors and metastases potentially even during surgery. Figure 5 compares the H&E stained tissue section of a brain metastasis [Fig. 5a], which originated from a lung carcinoma, with a CARS image recorded at 2850 cm−1 [Fig. 5b], Raman images [Fig. 5c, 5d, 5e, 5f] and an FTIR image [Fig. 5g] of an unstained parallel tissue section. Raman and FTIR imaging of the same tumor sample have been applied to evaluate the results from CARS imaging. The H&E stained tissue section reveals a solid tumor mass with high cell density in the right portion, a region of lower tumor cell density in the central part and necrotic tissue particular in the lower left portion. As the brain metastasis of a lung carcinoma contains the molecular information of the primary tumor, the biochemical composition and morphology significantly differs compared with brain tissue and necrosis. Hence, the solid tumor is identified in the CARS image by a well delineated, homogenous area of higher intensities. This corresponds to a distinct lipid content in comparison with brain tissue, as confirmed by the Raman and FTIR spectra that are presented below (Fig. 6). The area of lower tumor cell density appears more heterogeneously. The intensity profile along the diagonal is shown below allowing for tumor margin detection with a spatial resolution of approximately 10 μm. Within this CARS image single cell nuclei are visible. They appear darker, since the density of CH-stretching vibration is lower within the nuclei.28 Tumor islets identified by Raman and FTIR imaging are indicated by arrows. Such structures are also discernible in the CARS image. Fig. 5H&E stained tissue section (a), CARS image at 2850 cm−1 in blue-green false colors with a spectral profile along the diagonal line (b), Raman image analyzed by VCA (c)–(f) and FTIR image (g) analyzed by k-means clustering from brain metastasis of lung carcinoma. Even though only one resonance is used for CARS imaging, the tumor margin is clearly visible in (b). The transition of necrotic brain tissue to tumor is resolved within an accuracy of 10 μm due to the different intensity profile in necrotic and cancerous tissue. Single cell nuclei within the tumor appear dark because of reduced lipid content. The component (c) of the Raman image is assigned to blood vessels, (d) to tumor tissue, (e) to necrosis and (f) to cell nuclei. The cluster membership map of the FTIR image (g) separates tumor (orange), necrosis (yellow, cyan) and scattered tumor cells with necrosis (blue). Small islets of cancerous tissue outside the solid tumor are indicated by arrows. Comparing the images (b) with (c)–(g) the superior spatial resolution of CARS is apparent. The image acquisition time of CARS is also greatly reduced compared to FTIR and Raman imaging. Scale bar valid for all images.  Since the full vibrational spectrum is available for each position in the FTIR and Raman image, the analysis of these images reveals further insight in the composition of this tissue section. The VCA analysis of the Raman image resolves a component of high haemoglobin content between the solid tumor and the scattered tumor cells [Fig. 5c]. The assignment is confirmed by the endmember spectrum (Fig. 6, trace 1) which shows prominent haeme bands at 666, 739, 1250, and 1585 cm−1. The second component [Fig. 5c] corresponds to the solid tumor. In agreement with the higher CARS intensities the endmember spectrum (Fig. 6, trace 2) shows intense cholesterol (701 cm−1) and phospholipid bands (719, 1085, 1299, 1440, and 1657 cm−1). The area of lower tumor cell density corresponds to the third component [Fig. 5e]. The endmember spectrum (Fig. 6, trace 3) is dominated by spectral contributions of proteins. Bands of aromatic amino acids (Phe: 622, 1003, 1032, 1208 cm−1; Tyr: 643, 828, 851, 1208 cm−1; Trp: 757, 1340 cm−1) are identified. The positions of the protein amide III band (1240 cm−1) and amide I band (1668 cm−1) point to β-sheet secondary structures. The forth component [Fig. 5f]. is unevenly distributed in the left and right portion of the Raman image. The concentration is decreased in the central portion which corresponds to necrosis by comparison with the H&E stained image. The endmember spectrum (Fig. 6, trace 4) contains more intense bands due to DNA (497, 668, 727, 781, 1098, 1315, 1680 cm−1). This is consistent with a high cell density in tumor and a low cell density in necrotic tissue. Furthermore, the amide bands significantly shift to 1248 and 1660 cm−1 compared to the third endmember spectrum. This observation points to a change of secondary structures from β-sheets to more α-helical and unordered conformations. The band at 531 cm−1 is tentatively assigned to disulfide bridges between cysteine amino acids. Fig. 6Left: Endmember spectra of the Raman images [Fig. 5c, 5d, 5e, 5f] and right: mean cluster spectra of FTIR image from brain metastasis of lung carcinoma in Fig. 5g. See the results section for a detailed description and band assignment.  The cluster membership map of the FTIR image contains five clusters [Fig. 5g]. The clusters are assigned to the solid tumor (orange cluster), necrosis (yellow and cyan), the scattered tumor cells (blue), and the tissue margin (brown). The mean cluster spectra are overlaid in Fig. 6 (right). In agreement with the Raman signature the IR spectrum of the orange cluster contains more intense spectral contributions of phospholipids (1075, 1240, 1734, 2854, 2924 cm−1). Further differences compared with the other IR spectra are observed in the amide II (1539 cm−1) and amide A band (3290 cm−1) whose intensities are reduced relative to the amide I band (1654 cm−1). The variations of the blue, cyan, and yellow cluster are smaller. The cluster mean spectrum of the brown cluster at the tissue margin is not displayed because it is strongly affected by spectral contributions of OCT medium. 4.DiscussionAs the current neuropathologic investigation of brain tumor sections is based on H&E staining microscopy it is limited to fixed (ex vivo) tissue specimen. This work aims at providing nonlinear microspectroscopic tools allowing for a label free analysis of brain tissue with similar accuracy than the established H&E staining microscopy, which are potentially also applicable in vivo as already demonstrated.26, 32, 33, 36, 41, 44 Single-band CARS in resonance with the CH-stretching vibration combined with TPEF and SHG imaging can give similar insight into the composition and morphology of brain tissue as does H&E staining. This is at least true on a larger size scale. On single cell level the resolution of H&E microscopy has been superior. This is mainly due to the fact that in order to scan large sample areas a low magnification large field of view 10× objective has been used. Since SHG and CARS require phasematching, a high NA objective will not only increase the spatial resolution but also the efficiency of the signal generation for these processes. Further more the sample preparation is limiting the resolution. In this study dried sections from shock frozen tissue have been investigated. Due to the drying process the tissue shrinks. As a result the sample is not uniform in thickness and refractive index, which degrades the image contrast. This is because the laser beams cannot be focused to a diffraction limited spot deep in the tissue, which also affects the efficiency of the signal generation due to the nonlinear dependence on the intensity of the excitation lasers. To circumvent this problem the tissue will be cut at room temperature using a vibratome in forthcoming studies. Preparation based alterations of the tissue are thereby minimized. Therefore, it is expected, that even finer structural details will become generally visible in CARS images. This more elaborate sample preparation offers another advantage. Since sample modifications are small and the sections remain in a humid environment, the conditions are more similar to those in vivo. Although this ex vivo study revealed significant results in vivo assessment of tissue will form the core of future investigation. Especially SHG imaging has revealed paramount details, which are difficult to see if not completely invisible in H&E images. Since only ordered collagen is visualized, SHG offers high chemical selectivity. The image contrast is extremely high, because SHG selectively highlights exclusively the arachnoid membrane, blood vessels and other structures as axons composed of collagen. TPEF on the other hand allows for label free imaging the morphology of the sample. Even though the contrast is less pronounced than in H&E images, the main structural details of brain tissue can be visualized. These are white and grey matter. In the latter even the granule cell layer appears accentuated, which is invisible in the CARS images. CARS as the third nonlinear microspectroscopic technique employed is very promising for imaging the chemical composition. So far only the aliphatic CH-stretching band has been used for visualizing the distribution of lipids and membranes. However, this method already allows to clearly differentiate white and grey matter. Even the orientation of the nervous fibres is faintly visible. Due to differences in their chemical composition cancerous tissue could also be identified by CARS microscopy. The margin of lung tumor metastasis and necrosis has been detected with high spatial resolution of approximately 10 μm. FTIR and Raman imaging have identified four small tumor islets outside the solid tumor mass, which are also visible in the CARS image. In general the molecular specificity of single band CARS microscopy is lower than in Raman or FTIR imaging, because in contrast to FTIR and Raman imaging single band CARS utilizes only one Raman resonance for contrast generation. Furthermore the CARS signal is unevenly generated across the field of view decreasing to the edges. This is due to the phasematching condition, which is not equally satisfied across the full field of view. Hence, the tumor islets at the edge of the field of view are difficult to visualize. Nevertheless CARS is sufficiently sensitive to delineate the solid tumor and islets employing acquisition times, which are greatly reduced compared to Raman and FTIR microspectroscopy. However, as only single-band CARS has been applied in this study, detailed chemical information as encoded in the whole vibrational spectra of a sample has not been obtained yet by this nonlinear technique. Hence in order to validate the nonlinear imaging approach the underlying variations in chemical composition between cancerous and normal tissue were characterized with high accuracy in Raman and FTIR images that allow distinguishing different features within each tissue sections. It has already been demonstrated that these techniques enable tumor typing and grading.11, 12, 13, 14, 15 Therefore, to realize tumor typing or grading the entire vibrational fingerprint of a sample has to be used. The Raman and IR spectra indicate that the main spectral differences between cancer and normal tissue are assigned to proteins and lipids. But these spectral variations are usually small and distributed across a wide spectral range requiring the use of multivariate statistical analysis algorithms. But FTIR and Raman imaging are far too slow for being applicable in vivo. Furthermore, the use of FTIR is restricted to dry samples, thus, despite its great success in characterizing tissue sections its in vivo application will be hampered by the presence of water in biological samples. For an online, i.e., intrasurgery all-optical analysis of brain tissue CARS microscopy will be the method of choice, which might be combined with Raman analytics as recently demonstrated by Potma and co-workers in a proof-of-concept device.45 But since already single band CARS does provide sufficient information for the detection of tumor tissue,28 it is probably also capable of tumor typing, when more than a single resonance is used for imaging and when the results are combined with other nonlinear imaging modalities like SHG and TPEF. Furthermore, statistic image analysis can be applied to interpret CARS images.46, 47 These first results are very promising. A combination of nonlinear imaging techniques visualized the morphology of brain tissue and differentiated cancerous and necrotic brain tissue. These findings were verified by FTIR and Raman imaging. In the future further improvements of these nonlinear methods might allow for a rapid analysis of dissected brain tissue accompanying brain surgeries or biopsies. 5.Summary and OutlookIn order to become a useful complement or even substitute for standard staining methods, i.e., H&E staining, in neuropathology the technologically more complex nonlinear imaging methods must be able to demonstrate clear advantages in comparison to the established techniques. Here, it has been shown that a combination of recently developed multiphoton imaging modalities can provide similar structural information as does conventional H&E staining in neuropathology. In the present study CARS revealed general tissue textures as H&E stained samples, nevertheless, due to the use of a low-magnifying objective the CARS images do not reveal sub-cellular structures. On the other hand, CARS neither requires elaborate sample preparation, nor is its application limited to ex vivo studies as detection of the signals in backscattering direction is possible. However, the experimental setup is somewhat more complicated. Nonetheless, progress in laser technology may enable that these techniques will be implemented in a compact microscope comparable in size to the bright field microscopes nowadays widely used in hospitals. We believe that the implementation of fibre lasers48, 49, 50, 51 with their small footprint and robustness will bring CARS and nonlinear microscopy from specialized laser labs into hospital. By shifting the excitation laser wavelength further into the near-IR, lower photo induced damage and higher depth penetration is expected comparable to the situation established for two-photon fluorescence. Hence, investigations will not be limited to the surface of the sample, but contactless and hence noninvasive measurements of tissue a few hundred microns deep are realistic. By utilizing different resonances for CARS imaging especially within the fingerprint spectral region chemically selective imaging of more structural details inside the brain is expected. For instance the granule cell layer is extremely rich in DNA which could be used to selectively image this region. A rapid multispectral analysis of biopsies will allow for faster and more precise tumor typing. For the future we aim for a fast and reliable intraoperative diagnosis of the tumor type and grade by using solely nonlinear imaging modalities. AcknowledgmentsFinancial support from European Union via the Europäischer Fonds für Regionale Entwicklung (EFRE) and the Thüringer Ministerium für Bildung Wissenschaft und Kultur (TMBWK) (projects: B578–06001, 14.90 HWP, and B714–07037), via the German Science Foundation (Jena School of Microbial Communication) and the German Federal Ministry for Science and Education (BMBF) MediCARS (FKZ: 13N10774) is gratefully acknowledged. The authors thank Martin Hedegaard (University of Southern Denmark) for assistance with writing the Matlab scripts for VCA. B.D. thanks the Fonds der Chemischen Industrie for financial support. ReferencesGabriele Husmann and
Peter Kaatsch, Krebs in Deutschland, Robert Koch-Institut und die Gesellschaft der epidemiologischen Krebsregister in Deutschland e. V.,2010). Google Scholar
P. Kremer, M. Fardanesh, R. Ding, M. Pritsch, S. Zoubaa, and
E. Frei,
“Intraoperative Fluorescence Staining of Malignant Brain Tumors Using 5-Aminofluorescein-Labeled Albumin,”
Neurosurgery, 64 ons53
–ons61
(2009). https://doi.org/10.1227/01.NEU.0000335787.17029.67 Google Scholar
W. Chen,
“Clinical Applications of PET in Brain Tumors,”
J. Nucl. Med., 48 1468
–1481
(2007). https://doi.org/10.2967/jnumed.106.037689 Google Scholar
H. Takei, M. B. Bhattacharjee, A. Rivera, Y. Dancer, and
S. Z. Powell,
“New immunohistochemical markers in the evaluation of central nervous system tumors: a review of 7 selected adult and pediatric brain tumors,”
Arch. Pathol. Lab. Med., 131 234
–241
(2007). https://doi.org/http://www.ncbi.nlm.nih.gov/pubmed/17284108 Google Scholar
J. Gong, J. Yi, V. M. Turzhitsky, K. Muro, and
X. Li,
“Characterization of malignant brain tumor using elastic light scattering spectroscopy,”
Disease Markers, 25 303
–312
(2008). https://doi.org/http://iospress.metapress.com/content/RV6524Q54L485H05 Google Scholar
H. Böhringer, E. Lankenau, F. Stellmacher, E. Reusche, G. Hüttmann, and
A. Giese,
“Imaging of human brain tumor tissue by near-infrared laser coherence tomography,”
Acta Neurochirurgica, 151 507
–517
(2009). https://doi.org/10.1007/s00701-009-0248-y Google Scholar
W. Stummer, U. Pichlmeier, T. Meinel, O. D. Wiestler, F. Zanella, and
H.-J. Reulen,
“Fluorescence-guided surgery with 5-aminolevulinic acid for resection of malignant glioma: a randomised controlled multicentre phase III trial,”
The Lancet Oncology, 7 392
–401
(2006). https://doi.org/10.1016/S1470-2045(06)70665-9 Google Scholar
K. Gaus, P. Rösch, R. Petry, K.-D. Peschke, O. Ronneberger, H. Burkhardt, K. Baumann, and
J. Popp,
“Classification of lactic acid bacteria with UV-resonance Raman spectroscopy,”
Biopolymers, 82 286
–290
(2006). https://doi.org/10.1002/bip.20448 Google Scholar
C. Krafft, B. Dietzek, and
J. Popp,
“Raman and CARS microspectroscopy of cells and tissues,”
The Analyst, 134 1046
–1057
(2009). https://doi.org/10.1039/b822354h Google Scholar
C. Krafft, D. Codrich, G. Pelizzo, and
V. Sergo,
“Raman and FTIR microscopic imaging of colon tissue: a comparative study,”
J. Biophotonics, 1 154
–169
(2008). https://doi.org/10.1002/(ISSN)1864-0648 Google Scholar
C. Krafft, S. Sobottka, K. Geiger, G. Schackert, and
R. Salzer,
“Classification of malignant gliomas by infrared spectroscopic imaging and linear discriminant analysis,”
Analytical Bioanalytical Chem., 387 1669
–1677
(2007). https://doi.org/10.1007/s00216-006-0892-5 Google Scholar
C. Krafft, K. Thümmler, S. B. Sobottka, G. Schackert, and
R. Salzer,
“Classification of malignant gliomas by infrared spectroscopy and linear discriminant analysis,”
Biopolymers, 82 301
–305
(2006). https://doi.org/10.1002/bip.20492 Google Scholar
J. Popp, C. Krafft, N. Bergner, C. Matthaus, B. Romeike, R. Reichart, and
R. Kalff,
“FTIR, Raman, and CARS microscopic imaging for histopathologic assessment of brain tumors,”
Biomedical Vibrational Spectroscopy IV: Advances in Research and Industry, 756007
–756008 SPIE, San Francisco, CA
(2010). https://doi.org/10.1117/12.851080 Google Scholar
C. Krafft, L. Shapoval, S. B. Sobottka, G. Schackert, and
R. Salzer,
“Identification of primary tumors of brain metastases by infrared spectroscopic imaging and linear discriminant analysis,”
Technol. Cancer Research & Treatment, 5 291
–298
(2006). https://doi.org/http://www.ncbi.nlm.nih.gov/pubmed/16700626 Google Scholar
C. Krafft, L. Shapoval, S. B. Sobottka, K. D. Geiger, G. Schackert, and
R. Salzer,
“Identification of primary tumors of brain metastases by SIMCA classification of IR spectroscopic images,”
Biochimica et Biophysica Acta (BBA) – Biomembranes, 1758 883
–891
(2006). https://doi.org/10.1016/j.bbamem.2006.05.001 Google Scholar
C. Krafft, S. B. Sobottka, G. Schackert, and
R. Salzer,
“Raman and infrared spectroscopic mapping of human primary intracranial tumors: a comparative study,”
J. Raman Spectroscopy, 37 367
–375
(2006). https://doi.org/10.1002/(ISSN)1097-4555 Google Scholar
S. Koljenovic, T. B. Schut, A. Vincent, J. M. Kros, and
G. J. Puppels,
“Detection of meningioma in dura mater by Raman spectroscopy,”
Analytical Chem., 77 7958
–7965
(2005). https://doi.org/10.1021/ac0512599 Google Scholar
N. Amharref, A. Beljebbar, S. Dukic, L. Venteo, L. Schneider, M. Pluot, R. Vistelle, and
M. Manfait,
“Brain tissue characterisation by infrared imaging in a rat glioma model,”
Biochimica Et Biophysica Acta, 1758 892
–899
(2006). https://doi.org/10.1016/j.bbamem.2006.05.003 Google Scholar
K. R. Bambery, E. Schültke, B. R. Wood, S. T. R. MacDonald, K. Ataelmannan, R. W. Griebel, B. H. J. Juurlink, and
D. McNaughton,
“A Fourier transform infrared microspectroscopic imaging investigation into an animal model exhibiting glioblastoma multiforme,”
Biochimica Biophysica Acta, 1758 900
–907
(2006). https://doi.org/10.1016/j.bbamem.2006.05.004 Google Scholar
C. Krafft, M. Kirsch, C. Beleites, G. Schackert, and
R. Salzer,
“Methodology for fiber-optic Raman mapping and FTIR imaging of metastases in mouse brains,”
Analytical Bioanalytical Chem., 389 1133
–1142
(2007). https://doi.org/10.1007/s00216-007-1453-2 Google Scholar
G. Li, M. Thomson, E. Dicarlo, X. Yang, B. Nestor, M. P. G. Bostrom, and
N. P. Camacho,
“A Chemometric Analysis for Evaluation of Early-Stage Cartilage Degradation by Infrared Fiber-Optic Probe Spectroscopy,”
Appl. Spectrosc., 59 1527
–1533
(2006). https://doi.org/10.1366/000370205775142593 Google Scholar
T. M. Greve, K. B. Andersen, and
O. F. Nielsen,
“ATR-FTIR, FT-NIR and near-FT-Raman spectroscopic studies of molecular composition in human skin in vivo and pig ear skin in vitro,”
Spectroscopy, 22 437
–457
(2008). https://doi.org/10.3233/SPE-2008-0365 Google Scholar
M. Gloor, G. Hirsch, and
U. Willebrandt,
“On the use of infrared spectroscopy for the in vivo measurement of the water content of the horny layer after application of dermatologic ointments,”
Arch. Dermatological Res., 271 305
–313
(1981). https://doi.org/10.1007/BF00409459 Google Scholar
A. Zumbusch, G. R. Holtom, and
X. S. Xie,
“Three-Dimensional Vibrational Imaging by Coherent Anti-Stokes Raman Scattering,”
Phys. Rev. Lett., 82 4142
–4145
(1999). https://doi.org/10.1103/PhysRevLett.82.4142 Google Scholar
A. Volkmer,
“Vibrational imaging and microspectroscopies based on coherent anti-Stokes Raman scattering microscopy,”
J. Physics D: Applied Phys., 38 R59
–R81
(2005). https://doi.org/10.1088/0022-3727/38/5/R01 Google Scholar
C. L. Evans, E. O. Potma, M. Puoris'haag, D. Cote, C. P. Lin, and
X. S. Xie,
“Chemical imaging of tissue in vivo with video-rate coherent anti-Stokes Raman scattering microscopy,”
Proc. Natl. Acad. Sci. USA, 102 16807
–16812
(2005). https://doi.org/10.1073/pnas.0508282102 Google Scholar
Y. Fu, T. B. Huff, H.-W. Wang, H. Wang, and
J.-X. Cheng,
“Ex vivo and in vivo imaging of myelin fibers in mouse brain by coherent anti-Stokes Raman scattering microscopy,”
Opt. Exp., 16 19396
–19409
(2008). https://doi.org/10.1364/OE.16.019396 Google Scholar
C. L. Evans, X. Xu, S. Kesari, X. S. Xie, S. T. C. Wong, and
G. S. Young,
“Chemically-selective imaging of brain structures with CARS microscopy,”
Opt.s Exp., 15 12076
–12087
(2007). https://doi.org/10.1364/OE.15.012076 Google Scholar
N. Vogler, T. Meyer, D. Akimov, I. Latka, C. Krafft, N. Bendsoe, K. Svanberg, B. Dietzek, and
J. Popp,
“Multimodal imaging to study the morphochemistry of basal cell carcinoma,”
J. Biophoton., 3 728
–736
(2010). https://doi.org/10.1002/jbio.201000071 Google Scholar
J. Mertz,
“Nonlinear microscopy: new techniques and applications,”
Curr. Opin. Neurobiol., 14 610
–616
(2004). https://doi.org/10.1016/j.conb.2004.08.013 Google Scholar
L. A. Liotta, K. Tryggvason, S. Garbisa, I. Hart, C. M. Foltz, and
S. Shafie,
“Metastatic potential correlates with enzymatic degradation of basement membrane collagen,”
Nature, 284 67
–68
(1980). https://doi.org/10.1038/284067a0 Google Scholar
E. Brown, T. McKee, E. diTomaso, A. Pluen, B. Seed, Y. Boucher, and
R. K. Jain,
“Dynamic imaging of collagen and its modulation in tumors in vivo using second-harmonic generation,”
Nat. Med., 9 796
–800
(2003). https://doi.org/10.1038/nm879 Google Scholar
T. B. Huff and
J.-X. Cheng,
“In vivo coherent anti-Stokes Raman scattering imaging of sciatic nerve tissue,”
J. Microsc., 225 175
–182
(2007). https://doi.org/10.1111/jmi.2007.225.issue-2 Google Scholar
J. Caetano-Lopes, A. M. Nery, H. Canhão, J. Duarte, R. Cascão, A. Rodrigues, I. P. Perpétuo, S. Abdulghani, P. M. Amaral, S. Sakaguchi, Y. T. Konttinen, L. Graça, M. F. Vaz, and
J. E. Fonseca,
“Chronic arthritis leads to disturbances in the bone collagen network,”
Arthritis Res, Therapy., 12 R9
(2010). https://doi.org/10.1186/ar2908 Google Scholar
L. Gailhouste, Y. L. Grand, C. Odin, D. Guyader, B. Turlin, F. Ezan, Y. Désille, T. Guilbert, A. Bessard, C. Frémin, N. Theret, and
G. Baffet,
“Fibrillar collagen scoring by second harmonic microscopy: a new tool in the assessment of liver fibrosis,”
J. Hepatology, 52 398
–406
(2010). https://doi.org/10.1016/j.jhep.2009.12.009 Google Scholar
K. Konig and
I. Riemann,
“High-resolution multiphoton tomography of human skin with subcellular spatial resolution and picosecond time resolution,”
J. Biomed. Opt., 8 432
–439
(2003). https://doi.org/10.1117/1.1577349 Google Scholar
T. Meyer, D. Akimov, N. Tarcea, S. Chatzipapadopoulos, G. Muschiolik, J. Kobow, M. Schmitt, and
J. Popp,
“Three-dimensional molecular mapping of a multiple emulsion by means of CARS microscopy,”
J. Phys. Chem. B, 112 1420
–1426
(2008). https://doi.org/10.1021/jp709643h Google Scholar
M. M. Miljkovic, T. Chernenko, M. Romeo, B. Bird, C. Matthäus, and
M. Diem,
“Label-free imaging of human cells: algorithms for image reconstruction of Raman hyperspectral datasets,”
The Analyst, 135 2002
–2013
(2010). https://doi.org/10.1039/C0AN00042F Google Scholar
J. M. P. Nascimento and
J. M. B. Bioucasdias,
“Vertex Component Analysis: A Fast Algorithm to Unmix Hyperspectral Data,”
IEEE Trans. Geosci. Remote Sens., 43 898
–910
(2005). https://doi.org/10.1109/TGRS.2005.844293 Google Scholar
H. Wang, Y. Fu, P. Zickmund, R. Shi, and
J.-X. Cheng,
“Coherent anti-stokes Raman scattering imaging of axonal myelin in live spinal tissues,”
Biophys. J., 89 581
–591
(2005). https://doi.org/10.1529/biophysj.105.061911 Google Scholar
K. Schenke-Layland, I. Riemann, O. Damour, U. A. Stock, and
K. König,
“Two-photon microscopes and in vivo multiphoton tomographs – Powerful diagnostic tools for tissue engineering and drug delivery,”
Advanced Drug Delivery Reviews, 58 878
–896
(2006). https://doi.org/10.1016/j.addr.2006.07.004 Google Scholar
D. Akimov, S. Chatzipapadopoulos, T. Meyer, N. Tarcea, B. Dietzek, M. Schmitt, and
J. Popp,
“Different contrast information obtained from CARS and nonresonant FWM images,”
J. Raman Spectrosc., 40 941
–947
(2009). https://doi.org/10.1002/jrs.v40:8 Google Scholar
M. Greve, B. Bodermann, H. R. Telle, P. Baum, and
E. Riedle,
“High-contrast chemical imaging with gated heterodyne coherent anti-Stokes Raman scattering microscopy,”
Appl. Phys. B: Lasers d Optics, 81 875
–879
(2005). https://doi.org/10.1007/s00340-005-1979-y Google Scholar
S. Bégin, E. Bélanger, S. Laffray, R. Vallée, and
D. Côté,
“In vivo optical monitoring of tissue pathologies and diseases with vibrational contrast,”
J. Biophoton., 2 632
–642
(2009). https://doi.org/10.1002/jbio.v2:11 Google Scholar
M. Zimmerley, R. Younger, T. Valenton, D. C. Oertel, J. L. Ward, and
E. O. Potma,
“Molecular Orientation in Dry and Hydrated Cellulose Fibers: A Coherent Anti-Stokes Raman Scattering Microscopy Study,”
J. Phys. Chem. B, 114 10200
–10208
(2010). https://doi.org/10.1021/jp103216j Google Scholar
N. Vogler, T. Bocklitz, M. Mariani, V. Deckert, A. Markova, P. Schelkens, P. Rösch, D. Akimov, B. Dietzek, and
J. Popp,
“Separation of CARS image contributions with a Gaussian mixture model,”
J. Opt. Soc. Am. A, 27 1361
–1371
(2010). https://doi.org/10.1364/JOSAA.27.001361 Google Scholar
J. Hagmar, C. Brackmann, T. Gustavsson, and
A. Enejder,
“Image analysis in nonlinear microscopy,”
J. Opt. Soc. Am. A, 25 2195
–2206
(2008). https://doi.org/10.1364/JOSAA.25.002195 Google Scholar
G. Krauss, T. Hanke, A. Sell, D. Träutlein, A. Leitenstorfer, R. Selm, M. Winterhalder, and
A. Zumbusch,
“Compact coherent anti-Stokes Raman scattering microscope based on a picosecond two-color Er:fiber laser system,”
Opt. Lett., 34 2847
–2849
(2009). https://doi.org/10.1364/OL.34.002847 Google Scholar
K. Kieu, B. G. Saar, G. R. Holtom, X. S. Xie, and
F. W. Wise,
“High-power picosecond fiber source for coherent Raman microscopy,”
Opt. Lett., 34 2051
–2053
(2009). https://doi.org/10.1364/OL.34.002051 Google Scholar
M. Marangoni, A. Gambetta, C. Manzoni, V. Kumar, R. Ramponi, and
G. Cerullo,
“Fiber-format CARS spectroscopy by spectral compression of femtosecond pulses from a single laser oscillator,”
Opt. Lett., 34 3262
–3264
(2009). https://doi.org/10.1364/OL.34.003262 Google Scholar
A. F. Pegoraro, A. D. Slepkov, A. Ridsdale, J. P. Pezacki, and
A. Stolow,
“Single laser source for multimodal coherent anti-Stokes Raman scattering microscopy,”
Appl. Opt., 49 F10
–F17
(2010). https://doi.org/10.1364/AO.49.000F10 Google Scholar
|


