|
|
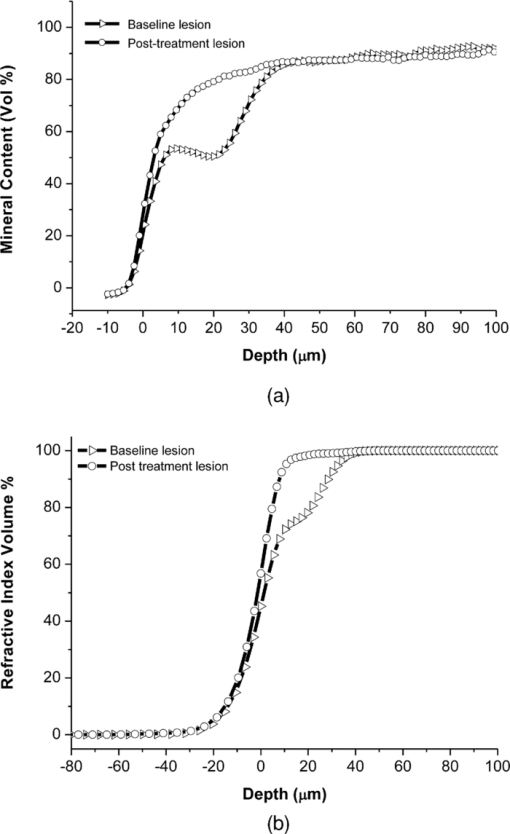
1.IntroductionThe current “gold standard” method to determine lesion mineral content in caries research is transverse microradiography (TMR);1 however, this technique is destructive because the sample to be investigated must be cut into thin slices. For in vitro longitudinal studies, a non destructive technique to assess and quantify de- and remineralization is desirable. Microindentation is also commonly used to provide an indirect measure of mineral changes.2 This method is based on applying a well-defined load to the enamel surface for a given time and the size of the indentation formed is measured, the dimensions of which will be dependent upon the mineral content of the specimen.3 However, microindentation is only useful for studying shallow lesions. Alternative techniques to TMR have been investigated, including quantitative light-induced fluorescence (QLF),4, 5 optical coherence tomography (OCT),6, 7 and x-ray micro-tomography (XMT).8 However, although these techniques are non-destructive, QLF provides no structural information about the lesion (i.e., lesion depth (LD)/mineral distribution), OCT is prone to errors resulting from back-scattering of the incident radiation, and XMT uses ionizing radiation and the data acquisition times make it too onerous for routine use. Recently, advances in ultrafast pulsed laser technology have facilitated the generation of radiation from the terahertz (THz) region of the electromagnetic spectrum. This region encompasses frequencies between infrared and microwaves and is defined as having a frequency between 0.1 and 20 THz (1 THz = 1012 Hz). This is of particular interest because many solids, liquids and gases have fundamental resonances in this part of the spectrum.9 The radiation is low energy (nonionizing) and can penetrate many common materials, such as plastics, papers, and ceramics. Within the sample, a structural or chemical modification that results in a refractive index (RI) change produces a reflection.10 These small RI changes can be imaged due to the high signal-to-noise ratio associated with this technique. This means that terahertz can reveal subsurface structures, eliminating the need to destroy a tooth sample by sectioning prior to radiography. The purpose of this study was to determine the ability of terahertz-pulsed imaging (TPI) to measure the remineralization of artificial caries lesions under simulated clinical conditions. A comparison was made with microindentation (using Vickers and Knoop diamonds) and TMR. 2.Methods2.1.Specimen PreparationForty-eight enamel specimens (5×5 mm) were prepared from bovine teeth free from white spots, cracks, and other defects. The topsides of the specimens were ground using 1200-grit paper until most of the tooth surface was flattened and then serially polished using 4000-grit paper followed by 1 μm diamond polishing suspension. Each specimen was mounted on the end of an acrylic rod (6.35 mm diameter × 50.8 mm long) using cyanoacrylate (Super Glue®), and the sides of each specimen were covered with an acid resistant varnish so that only the polished enamel surface was exposed. Baseline hardness of the sound enamel specimens was determined using Knoop and Vickers hardness indenters. Indentations (Knoop, 50 g for 15 s: Vickers, 200 g for 15 s) were made in the middle 2×2 mm area of the sample, at a distance of minimum 400 μm from each other, forming a square. The average specimen microhardness was determined from the four indentations on the surface of each specimen. Only specimens with a sound Vickers surface hardness between 260 and 310 kgf mm−2 were accepted for the study. 2.2.Lesion FormationArtificial caries lesions were formed in the enamel specimens by a 48 h immersion in a solution of 0.1 M lactic acid/0.2% Carbopol C907, which was 50% saturated with respect to hydroxyapatite and adjusted to pH 5.0. After demineralization, a reference area on each specimen was created by covering 1 mm on two opposite sides of the specimen surface with acid-resistant varnish (Revlon, New York, New York). The average specimen Knoop and Vickers microhardness was determined from four indentations on the surface of each specimen as described above. Only specimens with a lesion Vickers surface hardness between 25 and 45 kgf mm−2 were accepted. 2.3.pH-Cycling RegimeThe specimens were randomly divided (12 specimens per group) into four treatment groups (A = 10 ppm fluoride dentifrice, B = 675 ppm fluoride dentifrice, C = 1385 ppm fluoride dentifrice, D = 2700 ppm fluoride dentifrice). All treatments were sodium fluoride/silica-based dentifrices. A 50:50 mixture of pooled human saliva (used as expectorated):artificial saliva (2.20 g/L gastric mucin, 0.381 g/L NaCl, 0.213 g/L CaCl2.2H2O, 0.738 g/L KH2PO4, 1.114 g/L KCl) was used as the remineralization medium in all treatment regimens. Wax-stimulated saliva was collected from at least five individuals, pooled, and refrigerated until use. Fresh saliva/mineral mix was used each day (changed during the acid-challenge period). The cyclic treatment regimen consisted of a 4 h/day acid challenge in the lesion-forming solution and four, 1 min treatment periods. For each group, a slurry of each dentifrice was prepared by adding 5.0 g of dentifrice to 10 ml of saliva. After the treatments, the specimens were rinsed with running deionized water and placed back into the saliva mixture, (i.e., the remineralization solution). This cycling was repeated for 20 days. The daily treatment schedule for this study is given in Table 1. On the first day, treatment 1 was not given; the test began with 1 h in saliva to permit pellicle development prior to any treatments. Fig. 8Correlation plots for (a) ΔAEI versus ΔVHN, (b) ΔAEI versus ΔKHN, (c) ΔΔZ (THz) versus ΔΔZ (TMR) and (d) ΔLD(THz) versus ΔLD(TMR). Error bars represent standard errors. 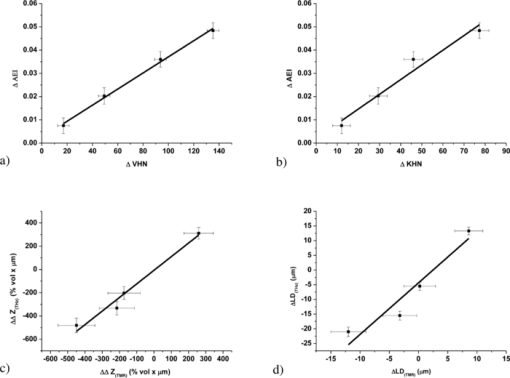 Table 1Daily treatment schedule.
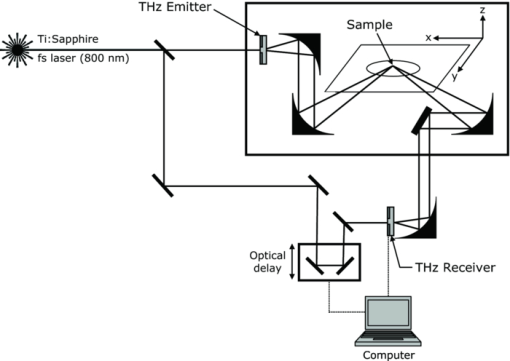
At the end of the cycling period, the average specimen Knoop hardness numbers (KHN) and Vickers hardness numbers (VHN) were determined from four indentations on the surface of each specimen as described above. The difference between the hardness following treatment and initial lesion hardness indicated the ability of each treatment to enhance remineralization after 20 days of treatments. 2.4.Terahertz Imaging and Data ProcessingAll specimens were imaged with a TPI imaga 1000 (TeraView Limited, Cambridge, United Kingdom) terahertz-pulsed imaging system before and after the 20-day remineralization period. The TPI imaga 1000 used a laser gated photoconductive semiconductor emitter and receiver to generate and detect pulses of terahertz light.11 The system utilized an ultrashort Ti:sapphire pulsed laser (Vitesse, Coherent, California), which generated 90 fs pulses centerd at 800 nm, with an 80 MHz repetition rate and an average power of 300 mW. A schematic of the imaging system is shown in Fig. 1. Initially, the laser output was split into two beams by a beam splitter, one was used to generate and the other for the detection of the terahertz pulses. The generation beam was focussed onto the terahertz photoconductive emitter, producing electron-holes pairs in the semiconductor that were accelerated by an externally applied bias producing bursts of broadband coherent terahertz light.11 The terahertz pulses were collected and refocused onto a specimen via a pair of off-axis parabolic (OAP) mirrors. Terahertz pulses reflected back from the specimen were collected and refocused with a further pair of OAP mirrors, onto the photoconductive receiver on which the detection beam was also focussed. The system produced a usable frequency range of 0.1–3 THz with an average power of ∼100 nW. Complete terahertz time-domain waveforms were obtained by sweeping the optical delay through the entire time range of the terahertz pulse at a rate of 15 Hz. The system has a spatial resolution of 60 μm at 3 THz and an axial resolution of ≤40 μm. The signal-to-noise ratio ∼5000:1. Each sample (lesion baseline and post-treatment) was positioned on an x-y stage and lowered into the focus of the terahertz beam. The terahertz beam path was purged with dry nitrogen to remove any water vapor and the optics were raster scanned in the x-y plane to collect a 6×6 mm grid of data points with a spacing of 50 μm: at each point, a complete terahertz waveform was acquired. The resulting data set was three-dimensional with time, which corresponded directly to depth as the third axis. Prior to each measurement, a terahertz reference waveform was recorded from a gold coated mirror. The acquired raw data represented the impulse function of the subject deconvolved with the reference data. Deconvolution was performed to extract the impulse function [Eq. 1]. Dividing the sample by the reference removed the system response, and a Gaussian filter function was applied to remove both the low and high-frequency noise components and produce a suitable time-domain response12, 13 Eq. 1[TeX:] \documentclass[12pt]{minimal}\begin{document}\begin{eqnarray} && {\rm Impulse \ function }\ ({\rm IF}) = {\rm FFT}^{ - 1} \left[ {\frac{{{\rm FFT}\left({{\rm filter}} \right) \times {\rm FFT}\left({{\rm raw}} \right)}}{{{\rm FFT}\left({{\rm reference}} \right)}}} \right],\nonumber\\ \\ &&\hspace*{-.8pc} \mbox{where}\ \mbox{FFT} \,{=}\, \mbox{Fast Fourier Transform.}\nonumber \end{eqnarray}\end{document}Following data processing, an average time-domain terahertz waveform was collected from the central 1.5×1.5 mm area of each specimen and from this, the intensity of the reflection from the air/enamel interface (AEI) and refractive index (RI) profile was extracted. 2.5.Extraction of Refractive Index ProfileThe terahertz RI profile through the lesion was calculated using [Eqs. 2, 3].13 Eq. 2[TeX:] \documentclass[12pt]{minimal}\begin{document}\begin{equation} n\left(x \right) = n_0 [ {1 + \partial \left(x \right)}], \end{equation}\end{document}Eq. 3[TeX:] \documentclass[12pt]{minimal}\begin{document}\begin{eqnarray} \partial \left(x \right) \propto \int_{x = 0}^{x = \infty } {{\mathop{\rm IF}\nolimits} .dx}, \hspace*{2pc}\\ \nonumber \\[-1pc] \hspace*{-1.7pc}\mbox{where}\ \mbox{IF is the impulse function and} \,n_{0}\, \mbox{is the RI in air}. \hspace*{.3pc}\nonumber \end{eqnarray}\end{document}By setting the RI of sound bovine enamel to 3.09 (100% mineral) (Ref. 14) and the RI of air to 1 (0% mineral), it was possible to calculate the RI profile throughout a specimen by scaling ∂(x) between 0 (on the surface) and 100 (in the sound enamel) expressed as percent volume RI. By calculating the area difference across the depth of the lesion between the sound enamel and either the baseline/post-treatment lesion profiles we obtained ΔZ (THz) for each specimen with equivalent units to ΔZ calculated using TMR Δ (units = volume% [TeX:] $\times\, \mu \rm m$ ). The post-treatment mineral change (ΔΔZ (THz)) was determined as follows: ΔΔZ = ΔZ treatment − ΔZ baseline. 2.6.Transverse MicroradiographyThin slices were removed from each specimen by cutting perpendicularly to the varnish strips and polished on an etched glass plate using an alumina slurry to a final thickness of ∼100 μm. For each specimen, two slices were prepared, one from the treated area and the other from the varnish-covered baseline lesion area. These slices were placed on high-resolution (Kodak Type 1A) radiographic plates along with a step wedge. The plates were exposed to x-rays generated from a source operating at 20 kV and 30 mA for 65 min and then developed and analyzed for changes in ΔZ (units = volume% [TeX:] $\times\, \mu \rm m$ ) and LD. The post-treatment mineral change (ΔΔZ (TMR)) was determined as follows: ΔΔZ = ΔZ treatment − ΔZ baseline. 2.7.Statistical AnalysisStatistical analyses were conducted using an analysis of covariance model (SAS software, version 8.2). Where significant differences were found, additional pair wise comparisons were performed using the Tukeys multiple comparisons test. Pearson correlation coefficients were calculated to determine if there were statistically significant correlations between TPI with microindentation or TMR. A level of significance of 0.05 was employed in all statistical tests. 3.Results and Discussion3.1.Terahertz Imaging ResultsA representative time-domain waveform of a demineralized enamel specimen is shown in Fig. 2. The primary (A) and secondary (B) peaks were due to the partial reflections from the AEI and lesion/sound enamel interface, respectively. These peaks were positive because the refractive index of air and demineralized enamel is lower than healthy (sound) enamel. As the remainder of the pulse continues through the specimen, an additional reflection (C) from the enamel/dentine junction is seen. This peak is negative because the pulse has moved from a region of high to low refractive index (the refractive index of enamel and dentine at terahertz frequencies are 3.09 and 2.6, respectively).14 Fig. 2Terahertz waveform from a single measurement point on a representative demineralized enamel specimen. 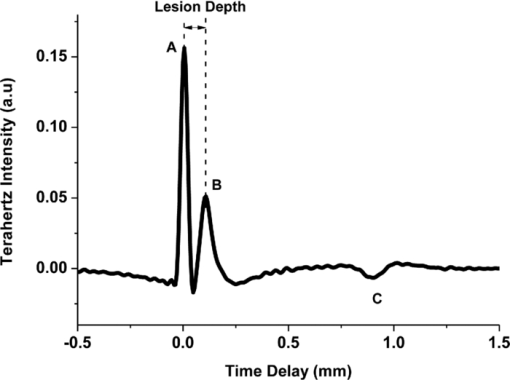 Three parameters were extracted from the reflected time domain pulse:
Because the entire pulse was used in the comparison analysis with TMR, the measurements should be equally sensitive to both low and high R lesions (the R parameter is equal to ΔZ/LD, i.e., the average decrease in mineral content within a lesion15). The absolute sensitivity of the technique was estimated to be better than ± 1% RI change. The experimental parameters, i.e. [TeX:] $\Delta {\rm AEI}, \Delta\Delta {Z}_{(\rm THz)}/\break \Delta\Delta{Z}_{(\rm TMR)}, \Delta{\rm LD}_{(\rm THz)}/\Delta{\rm LD}_{(\rm TMR)},\Delta{\rm VHN}/\Delta{\rm KHN}$ are shown in Table 2, and representative AEI intensity and layer thickness images for the four treatment groups are shown in Figs. 4, 5, 6, 7 (Note: the color-scale bar represents the intensity of the AEI reflection in arbitrary units (peak intensity images) and lesion depth in micrometers (layer thickness images). The left- and right-hand sides of the specimens in the post-treatment images are the areas covered by nail varnish. For the specimens treated with the 2700 ppm fluoride dentifrice (Fig. 7), it was not possible to generate a post-treatment lesion thickness image on the same scale as the other treatments due to the high level of remineralization). Fig. 4Representative terahertz images for an enamel specimen treated with 10 ppm fluoride: (a) baseline AEI reflection intensity, (b) baseline lesion thickness, (c) post-treatment AEI reflection intensity, and (d) post-treatment lesion thickness. 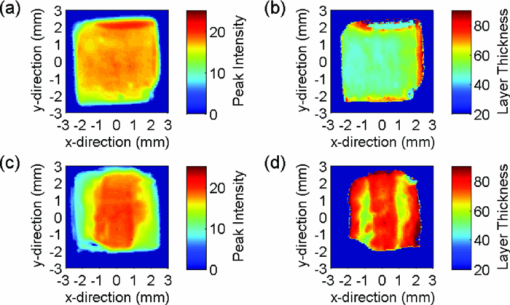 Fig. 5Representative terahertz images for an enamel specimen treated with 675 ppm fluoride: (a) baseline AEI reflection intensity, (b) baseline lesion thickness, (c) post-treatment AEI reflection intensity, and (d) post-treatment lesion thickness. 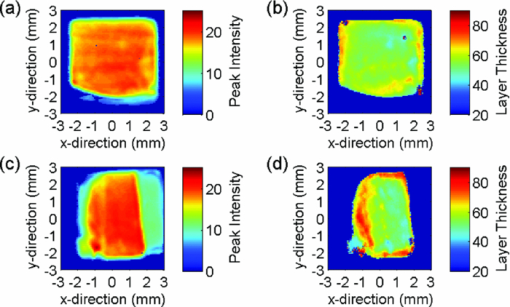 Fig. 6Representative terahertz images for an enamel specimen treated with 1385 ppm fluoride: (a) baseline AEI reflection intensity, (b) baseline lesion thickness, (c) post-treatment AEI reflection intensity, and (d) post-treatment lesion thickness. 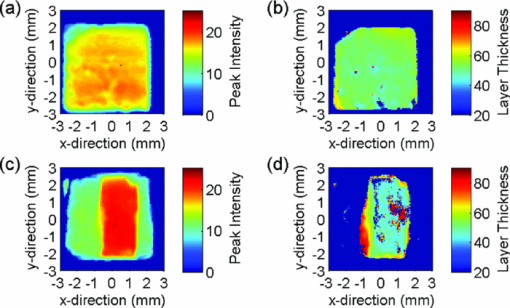 Fig. 7Representative terahertz images for an enamel specimen treated with 2700 ppm fluoride: (a) baseline AEI reflection intensity, (b) baseline lesion thickness, and (c) post-treatment AEI reflection intensity. 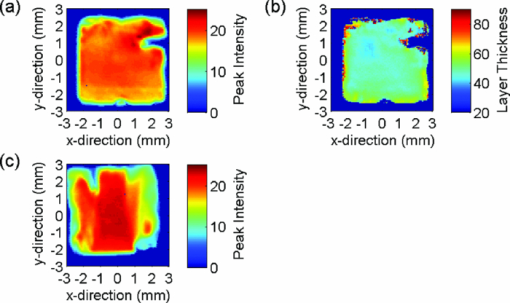 Table 2Change from baseline for TPI (ΔAEI/ΔΔZ/ΔLD), microindentation (KHN/VHN) and TMR (ΔΔZ/ΔLD) measurements following 20-day cycling with dentifrices containing different concentrations of fluoride.
There was a fluoride dose-dependent change from baseline in all TPI parameters, i.e. [TeX:] $\Delta {\rm AEI}, \Delta\Delta {\rm Z}_{(\rm THz)} \; {\rm and}\; \Delta{\rm LD}_{(\rm THz)}$ . An increase in the intensity of the AEI reflection was found in all treatment groups which was consistent with the increase in the refractive index mismatch between air and remineralized enamel. For specimens treated with the 10 ppm fluoride dentifrice, further sub-surface demineralization occurred following pH cycling, as indicated by the increase in lesion depth and positive ΔΔZ (THz). In all other treatment groups, lesion remineralization was identified. All product differences were significant, with the exception of (A) 10 and 675 ppm (AEI), (B) 1385 and 2700 ppm (AEI), (C) 675 and 1385 ppm (ΔΔZ (THz)), (D) 1385 and 2700 ppm (ΔΔZ (THz)), and 1385 and 2700 ppm (ΔLD(THz)). 3.2.Microindentation and Transverse Microradiography MeasurementsSpecimen analysis using microindentation and TMR showed a dose dependent change from baseline in all measurement parameters (Table 2). The TMR data showed that further demineralization occurred in the 10 ppm treatment group, all other treatments produced net remineralization. An increase in specimen hardness was found in all treatment groups. When comparing ΔKHN and ΔVHN, all differences were significant with the exception of 675 and 1385 ppm (ΔKHN). For ΔΔZ (TMR), the only significant difference was between 10 ppm and 675, 1385 and 2700 ppm dentifrices. 3.3.Correlation PlotsThe correlation plots (using adjusted mean data) between ΔAEI versus ΔVHN, ΔAEI versus ΔKHN, ΔΔZ (THz) versus ΔΔZ (TMR) and ΔLD(THz) versus ΔLD(TMR) are shown in Figs. 8a, 8b, 8c, 8d, respectively. A linear correlation was observed between all parameters: ΔAEI versus ΔVHN (r 2 = 0.997), ΔAEI versus ΔKHN (r 2 = 0.964), ΔΔZ(THz) versus ΔΔZ(TMR) (r 2 = 0.978), and ΔLD(THz) versus ΔLD(TMR) (r 2 = 0.915). The Pearson correlation coefficients (using unadjusted data for all specimens within each group) were 0.60 for ΔAEI versus ΔVHN and ΔAEI versus ΔKHN, 0.63 for ΔΔZ (THz) versus ΔΔZ (TMR), and 0.65 for ΔLD(THz) versus ΔLD(TMR). All correlations were statistically significant (p < 0.05). For the ΔΔZ (THz) versus ΔΔZ (TMR) correlation, 25% of the lesions were insufficiently robust to enable sectioning for radiography. Consequently, for some of the treatment groups the number of specimens used in the correlation study varied between 7 and 11. A greater number of significant differences (ΔΔZ and ΔLD parameters) were found between treatment groups when samples were analyzed by TPI. Both inter and intra specimen variations in mineral distribution were observed within each treatment group (Figs. 4, 5, 6, 7). These variations can be explained by considering that enamel is a heterogeneous matrix and because the demineralization solution is only partially saturated with respect to hydroxyapatite, the more soluble areas of the enamel will have an increased tendency to demineralize. In this study, specimen hardness was determined from an average of four indentations on a small area of the specimen and in TMR, ΔZ and LD were calculated from a single radiography section. Both techniques rely on these measurements being representative of the entire specimen and can be sensitive to nonuniformity in the mineral distribution. The use of TPI for measuring lesion depths in both high- and low-R lesions has been described previously by Pickwell,13 however, the present study is the first time a statistically significant lesion depth correlation between TPI and TMR has been reported for low-R lesions. There are several possible explanations for the improvement in the correlation, the most likely being that the measurements in the current study were made with a higher temporal resolution (i.e., a smaller point spacing on the terahertz pulse) than has been used previously, and that the signal-to-noise ratio has been improved due to advances in the terahertz technology. In order to prevent the intra specimen variability distorting the correlations, a subset was selected from each treatment group (n = 5) where the lesion mineral content and lesion depth was generally uniform across the measurement area and the linear correlation and Pearson correlation coefficients between ΔΔZ (THz) versus ΔΔZ (TMR) and ΔLD(THz) versus ΔLD(TMR) were recalculated. In both cases, there was a marked increase in the degree of correlation, [i.e., 0.978–0.999 (ΔΔZ) and 0.915–0.933 (LD) for the linear correlation coefficient, and 0.63–0.72 (ΔΔZ) and 0.65–0.78 (LD) for the Pearson correlation coefficients]. The use of TPI to assess de- and remineralization is advantageous for several reasons: (i) no sample preparation is required meaning that it can be used in longitudinal de- and remineralization studies; (ii) terahertz radiation is non-ionizing and the levels produced are considerably smaller than the levels we are naturally exposed to on a daily basis; (iii) terahertz radiation can penetrate depths ≥3 mm (however, this is dependent on the sample matrix); (iv) imaging of a 5-mm2 area can be obtained in under 15 minutes; (v) the spectral information generated by the instrument has the potential to be used for diagnostic purposes;14 and (vi) data are averaged across the entire specimen and so are insensitive to intra specimen variations in mineral distribution. Because the lesion mineral distribution can have a marked effect on the outcome of in vitro remineralization studies,16 it will be necessary to validate the technique for all types of lesions. In addition, an understanding of the relationship between mineral content and refractive index is important to support these findings. 4.ConclusionThe ability of terahertz imaging to detect mineral changes and measure lesion depths in enamel following remineralization with fluoride-containing dentifrices has been demonstrated in the present study. This technique was also sufficiently sensitive to discriminate between the levels of remineralization produced by the different dentifrices and could be suitable for monitoring mineral changes over time in de- and remineralization studies. AcknowledgmentsThe authors are indebted to Andrew Butler for his excellent help with the statistical analysis. ReferencesM. Huysmans and
C. Longbottom,
“The challenges of validating diagnostic methods and selecting appropriate gold standards,”
J. Dent Res., 83 C48
–52
(2004). https://doi.org/10.1177/154405910408301S10 Google Scholar
J. Arends, J. Schuthof, and
W. Jongebloed,
“Lesion depth and microhardness indentations on artificial white spot lesions,”
Caries Res., 14 190
–195
(1980). https://doi.org/10.1159/000260453 Google Scholar
J. Arends and
J. J. ten Bosch,
“Demineralization and remineralization evaluation techniques,”
J. Dent Res., 71 924
–928
(1992). Google Scholar
I. Pretty, W. Pender, W. Edgar, and
S. Higham,
“The in vitro detection of early enamel de- and re-mineralisation adjacent to bonded orthodontic cleats using quantitative light-induced fluorescence,”
Eur J. Ortho., 25 217
–233
(2003). https://doi.org/10.1093/ejo/25.3.217 Google Scholar
M. Ando, A. Hall, G. Eckert, B. Schemehorn, M. Analoui, and
G. Stookey,
“Relative ability of laser fluorescence techniques to quantify early mineral loss in vitro,”
Caries Res., 31 125
–131
(1997). https://doi.org/10.1159/000262387 Google Scholar
R. Jones and
D. Fried,
“Remineralisation of enamel caries can decrease optical reflectivity,”
J Dent Res., 85
(9), 804
–808
(2006). https://doi.org/10.1177/154405910608500905 Google Scholar
B. Amaechi, A. Podoleanu, G. Komarov, S. Higham, and
D. Jackson,
“Quantification of root caries using optical coherence tomography and microradiography: a correlation study,”
Oral Health Prev. Dent., 2 377
–382
(2004). Google Scholar
S. E. P. Dowker, J. C. Elliott, G. R. Davis, and
H. S. Wassif,
“Longitudinal study of the three-dimensional development of subsurface enamel lesions during in vitro demineralisation,”
Caries Res., 37 237
–245
(2003). https://doi.org/10.1159/000070865 Google Scholar
M. Beard, G. Turner, and
C. Schmuttenmaer,
“Terahertz Spectroscopy,”
J. Phys. Chem. B, 106 7146
–7159
(2002). https://doi.org/10.1021/jp020579i Google Scholar
J. Zeitler, Y. Shen, C. Baker, P. Taday, M. Pepper, and
T. Rades,
“Analysis of coating structures and interfaces in solid oral dosage forms by three dimensional terahertz pulsed imaging,”
J. Pharm Sci., 96
(2), 330
–340
(2007). https://doi.org/10.1002/(ISSN)1520-6017 Google Scholar
M. Van Exter and
D. Grischkowsky,
“Characterization of an optoelectronic terahertz beam system,”
IEEE Trans. Microw. Theory Tech., 38
(11), 1684
–1691
(1990). https://doi.org/10.1109/22.60016 Google Scholar
R. Woodward, B. Cole, V. Wallace, R. Pye, D. Arnone, E. Linfield, and
M. Pepper,
“Terahertz pulse imaging in reflection geometry of human skin cancer and skin tissue,”
Phys. Med. Biol., 47 3853
–3863
(2002). https://doi.org/10.1088/0031-9155/47/21/325 Google Scholar
E. Pickwell, V. Wallace, B. Cole, S. Ali, C. Longbottom, R. J. M. Lynch, and
M. Pepper,
“A comparison of terahertz pulsed imaging with transmission microradiography for depth measurement of enamel demineralisation in vitro,”
Caries Res., 41 49
–55
(2007). https://doi.org/10.1159/000096105 Google Scholar
D. Crawley, C. Longbottom, B. Cole, C. Cieslab, D. Arnone, V. Wallace, and
M. Pepper,
“Terahertz pulse imaging: a pilot study of potential applications in dentistry,”
Caries Res., 37 352
–359
(2003). https://doi.org/10.1159/000072167 Google Scholar
J. Arends, J. L. Ruben, and
D. Inaba,
“Major topics in quantitative microradiography of enamel and dentin: R parameter, mineral distribution visualization, and hyper-remineralization,”
Adv. Dent. Res., 11 403
–414
(1997). https://doi.org/10.1177/08959374970110040501 Google Scholar
R. J. M. Lynch, U. Mony, and
J. ten Cate,
“Effect of lesion characteristics and mineralising solution type on enamel remineralisation in vitro,”
Caries Res., 41 257
–262
(2007). https://doi.org/10.1159/000101914 Google Scholar
|
||||||||||||||||||||||||||||||||||||||||||||||||||||||||||||||||||||||

