|
|
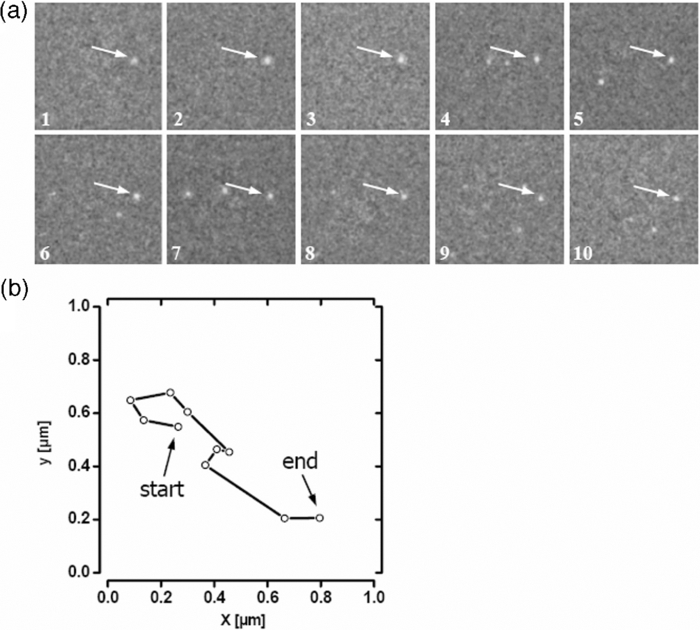
1.IntroductionThe G-protein-coupled receptor (GPCR) family is the most versatile group of cell membrane receptors and represents the largest receptor family in the human genome.1, 2 Currently, 30 to 50% of the drugs used for the treatment of, e.g., asthma, allergic rhinitis, pain, hypertension, and schizophrenia are acting at GPCRs.1 GPCRs transduce extracellular signals transmitted by diverse bioactive molecules into intracellular responses. Major mechanisms of signal transduction and receptor regulation were deciphered, and the involved proteins were identified. Stimulation of β2-adrenergic receptors (β2ARs) activates heterotrimeric G-proteins.3 Subsequently, Gsα activates the adenylate cyclase, which catalyzes the synthesis of the second messenger cyclic adenosine monophosphate (cAMP). An increasing intracellular cAMP-concentration activates protein kinase A (PKA), which triggers phosphorylation of various proteins leading to a cellular effect. Different mechanisms of deregulation prevent an over-stimulation of the cell. Phosphorylation of the agonist occupied β2AR by PKA and G-protein-coupled receptor kinase 2 (GRK2) followed by β-arrestin binding results in receptor desensitization.4 Finally, the β2AR becomes internalized via clathrin-coated pits. Various intracellular proteins (e.g., clathrin and dynamin) are involved in the internalization process.5 The elucidation of the crystal structure of the β2AR further improved the understanding of the associated signaling pathways.6, 7 It is well-known that the binding affinity between receptor and ligand affects the signaling of the β2AR.8, 9 Furthermore, for the β2AR in C6 cells two different receptor mobilities were described with two different KD-values.10 For the slow diffusing receptor a higher binding affinity was found. Thus, it can be supposed that there is a relationship between ligand binding affinity and receptor diffusion behavior. It was also shown by Prenner that an agonistic stimulation of the β2AR leads to a decrease of the diffusion constants for both the fast and slow diffusing receptors. Obviously, there is a correlation between receptor mobility and receptor state. Thus, one would expect different types of receptor trajectories characterizing, e.g., activated and desensitized receptor-ligand complexes. So far, the mobility of β2ARs in the plasma membrane of different cell types has been examined using fluorescence recovery after photobleaching (FRAP) and fluorescence correlation spectroscopy (FCS).10, 11, 12 However, single receptor trajectories, which would provide detailed information about the diffusion characteristics of receptor-ligand complexes, cannot be monitored with these techniques. The new and powerful light microscopic technique to visualize and track single fluorescent molecules or particles with high spatial resolution in real-time provides comprehensive information on the molecular dynamics within cell membranes or even inside living cells.13, 14 Here, we used state-of-the-art single molecule microscopy to record trajectories of single β2AR-ligand complexes on A549 cells employing fluorescently labeled noradrenaline as marker. Localization and tracking of single β2ARs allowed a thorough characterization of the receptor diffusion by analyzing the mean square displacements, the frequency distributions of the trajectory length, and the jump distance distributions. Also, we examined the effect of an agonistic stimulation by terbutaline on the diffusion characteristics and the covered trajectory area of the receptor-ligand complexes compared to control cells. To further visualize the receptor distribution during an agonistic stimulation over the entire cell, HEK293 cells over-expressing the β2AR as a green fluorescent protein (GFP) fusion protein were observed using confocal laser scanning microscopy. 2.Materials and Methods2.1.LigandSynthesis and functionality of Alexa Fluor 532 labeled NA (Alexa-NA) were described by our group.10, 12 2.2.Cell CultureThe human cancer cell line A549 was obtained from DSMZ (No. ACC 107). Cells were cultured in RPMI 1640 medium supplemented with 2 mM L-glutamine, 100 U/mL penicillin, 100 μg/mL streptomycin, and 10% fetal calf serum (all Gibco, Invitrogen, Karlsruhe, Germany). For experiments cells were seeded at density of 1.7 to 3.4×10⁴ cells/cm2 on heat-sterilized glass coverslips (#1, Ø18 mm, Marienfeld, Lauda-Königshofen, Germany) and cultured in 12-well chambers (Nunc, Langenselbold, Germany) at 37°C and 5% CO2. Cells were used for experiments after three to four days in culture at 80 to 90% confluency. Human embryonic kidney cells (HEK293) obtained from DSMZ (No. ACC 305) were cultivated in DMEM-F12 medium supplemented with 2 mM L-glutamine, 100 U/mL penicillin, 100 μg/mL streptomycin, and 5% fetal calf serum. HEK293 were stably transfected with a cDNA encoding for the β2AR tagged with EGFP (β2AR-GFP). The cloning procedure was described elsewhere.15 The plasmid was a kind donation of Professor M. J. Lohse, Department of Pharmacology and Toxicology, University of Würzburg. Generation of a HEK293 cell line stably expressing β2AR-GFP was described previously.10 For live cell imaging HEK293 cells over-expressing β2AR-GFP were plated onto heat-sterilized and poly-D-lysine-coated glass coverslips at a density of 2.5 to 5×10⁴ cells/cm2 in 12-well chambers and cultivated for two to four days at 37°C and 5% CO2. After reaching 70 to 80% confluency cells were used for confocal laser scanning microscopy. 2.3.Single Molecule MicroscopyAn inverted wide-field epi-fluorescence microscope (TE2000-S, Nikon, Kanagawa, Japan) was equipped with a 50 mW diode-pumped solid-state laser (LasNova GLK 3250 T01, 532 nm, 50 mW, Lasos, Jena, Germany). After passing an acousto-optical tunable filter (AOTF, A.A Sa, Saint-Rémy-Lès-Chevreuse, France), the laser was coupled into an optical single-mode fibre (kineFLEX, Point Source, Hamble, UK). The collimated laser beam with a diameter (1/e 2) of 0.7 mm was coupled into the backport of the microscope. Then, the laser beam passed a tube lens (f = 200 mm), a dichromatic mirror (Q540lp, Chroma Technology, Fürstenfeldbruck, Germany), and was imaged by a water immersion objective (Plan Apo VC, 60×/1.2 NA, Nikon) into the object plane yielding an illumination field of about 12 μm in diameter. Fluorescence light was separated from the excitation by the dichromatic mirror and an emission filter (HQ560/30, Chroma Technology). After a four-fold magnification by a lens system (VM Lens C-4× Nikon) images were recorded by an EMCCD camera (iXon DV-860DCS-BV, Andor, Belfast, IE) with a chip size of 128×128 pixels (24-μm pixel size). The effective pixel size of the EMCCD detector in the object plane was 100 nm. The EMCCD was cooled to –85°C. Trigger signals generated by the camera were used to control power and frequency of the laser illumination via the AOTF. The excitation intensity was adjusted to 1 kW/cm2. The cells were kept at 22°C throughout the measurement, but were not used longer than 90 min. The recording conditions were kept constant for all measurements (illumination time, 50 ms; frame rate, 10 Hz; read out rate, 5 MHz; vertical shift speed, 1.7 μs; pre-amplifier gain, 4.5×; baseline clamp activated; EMCCD gain, 100 to 130 units). 2.4.Confocal Laser Scanning MicroscopyFluorescence microscopy was performed with a confocal laser scanning microscope LSM510 Meta (Carl Zeiss, Jena, Germany) equipped with a Plan-Apochromat 63×/1.4 Oil DIC objective. The 488-nm line of an argon ion laser was separated for GFP excitation applying the beamsplitter HFT488/543 and for detection of the GFP fluorescence the band-pass filter BP505-530 was used. 2.5.Live Cell ExperimentsImmediately before imaging, cover slips were washed three times with Locke's Solution pH 7.3 [154.0 mM NaCl, 5.6 mM KCl, 2.3 mM CaCl2-dihydrate, 1.0 mM MgCl2-hexahydrate, 3.6 mM NaHCO3, 5.0 mM HEPES, 2.0 mM D-(+)-glucose-monohydrate]. Coverslips were mounted on a carrier above the microscope objective with an incubation volume of 300 μL. For single particle tracking (SPT) experiments, A549 cells were incubated with 0.5 nM Alexa-NA and data acquisition was started after 15 min. For this purpose the focus was positioned on the upper plasma membrane of a cell. For stimulation experiments, measurements were done 5, 15, 25, and 35 min after adding 1 μM terbutaline. All data calculated from live cell experiments represent mean values ± standard deviation (SD) of measurements from at least 3 different cells. For observing the spatial distribution of β2AR-GFP in HEK293 cells using laser scanning microscopy, data were acquired before and 5, 15, 25, and 35 min after adding 1 μM terbutaline. Pictures shown are representative for five independently conducted experiments. 2.6.Data AnalysisLocalization and tracking of single molecules throughout a time series of 2000 images were done using an automated particle tracking software (DiaTrack 3.01, Semasopht, Chavannes, CH). After background subtraction, particles were localized by approximation of a two-dimensional Gaussian function to the point spread function of each single molecule signal. Afterward, the localized signals were connected to trajectories. Each trajectory was visually inspected for plausibility using a custom-written MATLAB-based program (“Trackeditor”). Incorrectly connected signals were discarded. Raw data were further processed using Origin 7.5 (OriginLab, Northamptom, Massachusetts). The jump distances r were calculated as Eq. 1[TeX:] \documentclass[12pt]{minimal}\begin{document}\begin{equation} r = \sqrt {({x_i - x_{i + 1} })^2 + ({y_i - y_{i + 1} })^2 } \end{equation}\end{document}The trajectory areas were calculated using a further MATLAB-based program (“Trackselect”). The distance between the farthest single molecule positions within one trajectory was defined as the “trajectory diameter,” which was used to calculate the circular trajectory area. Given values for the trajectory areas are mean values ± standard error of the mean (SEM). 2.7.Trajectory Analysis2.7.1.Analysis of the mean square displacementIn the case of simple two-dimensional Brownian motion the mean square displacement (MSD) 〈r 2(t)〉 is related to the diffusion coefficient D:14 Eq. 2[TeX:] \documentclass[12pt]{minimal}\begin{document}\begin{equation} \langle {r^2 (t)} \rangle = 4Dt.\,\,\,\,\,\,\,\,\,\,\,\,\,\, \end{equation}\end{document}2.7.2.Jump distance analysisIn order to include the complete data pool we chose the analysis of jump distances developed by Cherry and co-workers.16, 17 This method is based on the probability distribution of jump distances as a function of the lag time t lag. p(r, t)dr is the probability that a particle starting at the origin will be found in a circular ring with the radius r and the width dr after a time t. For a molecule with two-dimensional random diffusion and a diffusion coefficient D it can be obtained: Eq. 4[TeX:] \documentclass[12pt]{minimal}\begin{document}\begin{equation} p({r,t})dr = \frac{1}{{4\pi Dt}}\exp \Big[ { - r^2 } \Big/ 4Dt \Big]2\pi rdr. \end{equation}\end{document}2.8.Localization PrecisionThe accuracy of the position determination was estimated using immobilized Alexa-NA molecules attached to a glass coverslip. Data acquisition was done under similar conditions as used for the cell experiments. Single molecule localization was performed using two-dimensional Gaussian fitting throughout a time series of single frames. The standard deviation of the measured coordinates for single Alexa-NA molecules directly reflected the localization precision. 3.Results3.1.Detection and Tracking of Single β2AR-Alexa-NA Complexes in Living CellsSingle-molecule microscopy was used to monitor the lateral diffusion of single β2ARs in the plasma membrane of living cells. To this end, A549 cells were incubated with noradrenaline coupled to the fluorescent dye Alexa Fluor 532 (Fig. 1). Focusing on the upper plasma membrane of an individual cell (Fig. 2) single diffraction-limited fluorescence spots were observed 15 min after ligand incubation [Fig. 3a]. A surface plot of the fluorescence intensity demonstrates that the signals of single receptor-ligand complexes were clearly distinguishable from the background noise [Fig. 3a]. Single-step photobleaching [Fig. 3b] of the individual fluorescent molecules demonstrated that indeed single molecules were observed,18 and also a receptor-ligand-ratio of 1:1. Ten single, subsequently recorded positions of an individual β2AR-Alexa-NA complex observed on the upper plasma membrane of an A549 cell are indicated in Fig. 4a. After determination of the precise particle position in each frame using two-dimensional Gaussian fitting, single trajectories were archived as depicted in Fig. 4b. A representative movie of single β2AR-Alexa-NA complexes diffusing within the plasma membrane of an A549 cell is given as 1. Analysis of individual Alexa-NA molecules immobilized on a glass surface revealed an average localization precision of 27 nm for the employed microscope setup.18 Video 1Diffusion of β2AR-Alexa-NA complexes in control cells. The video sequence contains 142 frames of individual β2AR-Alexa-NA complexes diffusing within the plasma membrane of an A549 cell. Trajectories detected by DiaTrack are displayed in color. (Cropped image size, 64×64 pixels, QuickTime, 444 KB.) 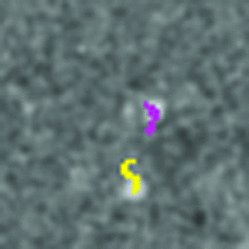 Fig. 1Molecular structure of Alexa-NA. Noradrenaline labeled with the fluorescent dye Alexa Fluor 532.  Fig. 2Focus positioning on the upper plasma membrane of a single cell. Detected trajectories are plotted in red on a bright field image of an A549 cell. The dotted white line indicates the position of the nuclear envelope. Scale bar: 10 Pixels = 1 μm. 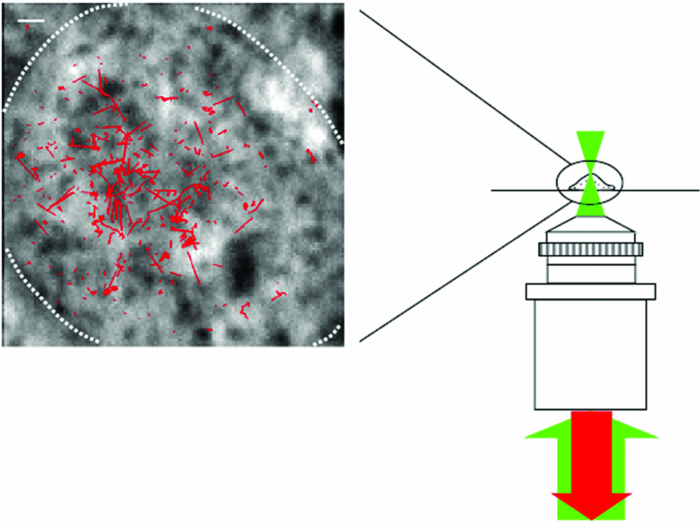 Fig. 3Detection of single β2AR-Alexa-NA complexes. (a) Fluorescence image of an individual A549 cell. Single diffraction-limited spots are monitored on the upper plasma membrane after incubation with 0.5 nM Alexa-NA. Please note the inverted color table. (b) Fluorescence signal of an individual β2AR-Alexa-NA complex demonstrating single-step photobleaching.  3.2.Single β2AR-Alexa-NA Complexes Reveal Different Modes of MotionThe visual inspection of the recorded single molecule trajectories suggested the existence of various diffusion modes. To begin with, trajectories were analyzed by determining the MSD as a function of time. Three representative trajectories of β2AR-Alexa-NA complexes and the corresponding MSD plots are shown in Figs. 5a, 5b, 5c, 5d. Some receptor-ligand complexes were obviously immobile [Fig. 5a]. Thus, a noteworthy increase in MSD was not recognized [Fig. 5d]. Fitting of the MSD-plot by Eq. 2 yielded a small, virtual diffusion coefficient of D = 1.9 × 10⁻¹⁰ ± 1.3 × 10⁻¹⁰ μm2/s. In contrast, some receptor-ligand complexes were probably diffusing within a restricted domain [Fig. 5b]. From the MSD analysis based on Eq. 3 a diffusion coefficient of D = 0.08 ± 0.01 μm2/s and a domain size r D = 0.34 ± 0.005 μm was determined. Finally, a large number of β2AR-Alexa-NA complexes showed a discontinuous movement, a heterogeneous mobility profile, since the diffusion properties change within the trajectory [Fig. 5c].19 MSD analysis of these trajectories is problematic. An apparent diffusion coefficient D 1-5 was often estimated from the first five MSD data points using Eq. 2 [Fig. 5d], with D 1-5 = 0.07 ± 0.001 μm2/s for the trajectory given in Fig. 5c. From the frequency distribution of the trajectory length a quite short binding duration of the ligand Alexa-NA to the β2AR was deduced (Fig. 6). The approximation of a bi-exponential function to the histogram yielded two different dwell times with τ1=77 ± 1 ms and τ2 = 388 ± 11 ms for 98±2% and 2 ± 0.2%, respectively (n = 9 containing 3424 trajectories). To obtain a more detailed view of the mobility we analyzed the frequency distribution of the jump distances, p(r, t)dr, of all trajectories. Approximation of Eq. 5 to the jump distance histogram provided three different diffusion coefficients (Fig. 7, n = 9 containing 3424 trajectories and 9904 single jumps) with 18±1% of D 1 = 0.005 ± 0.0003 μm2/s, 65 ± 2% of D 2 = 0.03±0.001 μm2/s, and 17± 2% of D 3 = 0.15±0.02 μm2/s. Molecules that do not move more than the threefold localization precision between two subsequent frames (27 nm, see above) can be regarded as immobile.20 Thus, receptor-ligand complexes with diffusion coefficients below 0.016 μm2/s were virtually immobile, which was true for all β2AR-Alexa-NA complexes characterized by D 1, D 2 and D 3 describe the lateral mobility of slow and fast diffusing β2AR-Alexa-NA complexes. Fig. 6Frequency distribution of the trajectory lengths of β2AR-Alexa-NA complexes (n = 9). Bi-exponential curve approximation with two different dwell times: 98 (±2)% of τ1 = 77 (±1) ms and 2 (±0.2)% of τ2 = 388 (±11) ms (solid line). The dotted line represents τ1 and the dashed line τ2.  Fig. 7Frequency distribution of the jump distances from β2AR-Alexa-NA complexes (binning 20 nm, n = 9). Curve approximation according to Eq. 5 yielded three diffusion coefficients (solid line, values see text). The dotted-dashed line represents D 1, the dotted line D 2, and the dashed line D 3.  3.3.Terbutaline Stimulation Leads to Immobilization of β2AR-Alexa-NA ComplexesIn order to examine the diffusion behavior of β2AR-Alexa-NA complexes under stimulating conditions, cells pre-incubated with Alexa-NA were treated with the β2-selective agonist terbutaline (1 μM). Molecular mobility was analyzed 5, 15, 25, and 35 min after stimulation (n = 3). 2 shows a representative sequence of single β2AR-Alexa-NA complexes diffusing within the plasma membrane of an A549 cell 35 min after terbutaline stimulation. Frequency distributions of the trajectory length after terbutaline stimulation did not reveal any significant change in the binding duration of Alexa-NA to the β2ARs on A549 cell (data not shown). Frequency distributions of jump distances were generated for each time point. The corresponding histograms and curve fits based on Eq. 5 are shown in Figs. 8a, 8b, 8c, 8d, 8e. Diffusion coefficients D 1–D 3 were determined in control experiments 15 min after Alexa-NA incubation and yielded D1 = 0.006±0.0004 μm2/s, D 2 = 0.03±0.002 μm2/s, and D 3 = 0.13±0.02 μm2/s [Fig. 8a]. These parameters were kept fixed when fitting the histograms in Figs. 8b, 8c, 8d, 8e in order to reduce the scattering of the fitting results due to parameter correlations. Compared to the control, we observed a left shift of the approximated curves towards smaller jump distances with increasing stimulation time. This shift towards smaller jump distances was reflected in an increase of the immobile fraction, which was characterized by diffusion coefficient D 1. The frequency distribution of the diffusion coefficients is depicted in Fig. 9. After terbutaline stimulation, a distinct, time-dependent increase of β2AR-Alexa-NA complexes with diffusion coefficient D 1 was observed compared to control cells. The fraction of immobile receptor-ligand complexes increased from 17±1% to 49±3% within 35 min after stimulation. Simultaneously, the fractions of receptor-ligand complexes with D 2 and D 3 decreased from 63±3% to 37±5% and from 20±4% to 14±6%, respectively (Fig. 9). Video 2Diffusion of β2AR-Alexa-NA complexes under stimulating conditions. The video sequence contains 102 frames of individual β2AR-Alexa-NA complexes diffusing within the plasma membrane of an A549 cell after 35 min stimulation with 1 μM terbualine. Trajectories detected by DiaTrack are displayed in color. (Cropped image size, 64×64 pixels, QuickTime, 314 KB.)  Fig. 8Frequency distribution of the jump distances from β2AR-Alexa-NA complexes under various conditions (binning 20 nm, n = 3). A549 cells incubated with 0.5 nM Alexa-NA (a, control) and subsequent stimulation with 1 μM terbutaline for (b) 5 min, (c) 15 min, (d) 25 min, and (e) 35 min. Curve approximations according to Eq. 5.  3.4.Terbutaline Stimulation Reduces the Diameter of β2AR-Alexa-NA TrajectoriesFinally, the impact of terbutaline stimulation (1 μM) on the spatial extension of the trajectories was analyzed as a function of time. In control cells, we calculated a mean trajectory area of 0.06±0.00007 μm2, which time-dependently decreased as follows: whereas a stimulation for 5 min did not alter the mean trajectory area, a decrease of approximately 17% to 0.05±0.00006 μm2 was found after 15 min, which was still the same after 25 min. After a stimulation period of 35 min, the mean trajectory area decreased by approximately 33% to 0.04±0.00008 μm2. After eliminating all trajectories of immobile receptor-ligand complexes with jump distances below 80 nm, a mean trajectory area of 0.1±0.0001 μm2 was found for the remaining mobile receptor-ligand complexes in control cells. The subsequent terbutaline stimulation did not affect the mean trajectory area of this receptor population. 3.5.Terbutaline Stimulation Leads to Internalization of β2AR-GFPIn order to prove the influence of terbutaline stimulation on the spatial distribution of β2ARs, HEK293 cells stably overexpressing the β2AR as a GFP fusion protein were investigated using confocal laser scanning microscopy. Before agonistic stimulation, β2AR-GFP is equally distributed within the plasma membrane of the cells [Fig. 10a]. After stimulating the cells with 1 μM terbutaline, initially just minor aggregated β2ARs were observed within the plasma membrane [Fig. 10b, arrows]. Fifteen minutes after adding terbutaline, β2AR-GFP becomes strongly internalized as indicated by the large cytosolic spots [Fig. 10c, arrows]. Further, the number of internalized GFP-tagged β2ARs increased with longer stimulation times [Figs. 10d and 10e]. Fig. 10LSM images of HEK293 cells stably over-expressing β2AR-GFP. Receptor distribution is shown before (a) and after stimulation with 1 μM terbutaline for (b) 5 min, (c) 15 min, (d) 25 min, and (e) 35 min. Arrows indicate internalized β2AR-GFP. Cropped image size (488×488 pixels). Scale bar: 10 μm. 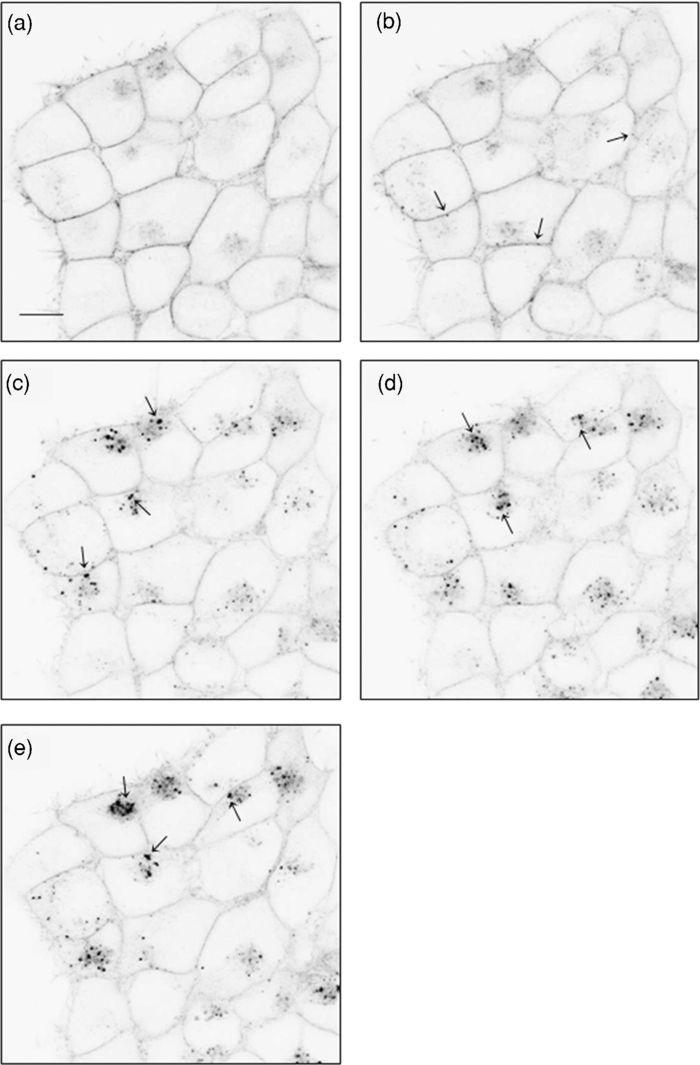 4.DiscussionThe binding of the fluorescent ligand Alexa-NA to the β2AR allowed us to follow the diffusion of single β2AR-Alexa-NA complexes on the plasma membrane of A549 cells.21 Both the specific binding to the β2AR on A549 cells and the agonistic profile of the ligand were evidenced by FCS displacement experiments and increased cAMP levels in C6 glioblastoma cells.10, 12 Using single-molecule microscopy and an automated tracking program, single molecular β2AR-Alexa-NA complexes were visualized, localized by image processing, and tracked. The MSD analysis of the trajectories demonstrated the heterogeneity of the diffusion. After ligand binding, many immobile β2ARs were observed. Receptor immobilization due to interactions with the cytoskeletal network or binding to intracellular proteins can be expected from a constitutively active receptor population, which is involved in the internalization process independent of a strong agonistic stimulation.22 Additionally, single β2AR-Alexa-NA complexes were observed diffusing within restricted domains, which corroborates the localization of the receptor within microdomains like lipid rafts.23, 24 Also, sterical hindrance of free diffusion due to the close proximity of the cytoskeleton to the plasma membrane is possible.25 Further, interactions with intracellular proteins can cause restricted receptor mobility. Using single particle tracking, hindered receptor motion was previously found for various GPCRs like the neurokinin 1 receptor (NK1R) and the human odorant receptor OR17-40.26, 27 Most interestingly, many β2AR-Alexa-NA complexes showed a heterogeneous mobility profile, where different velocities were found in different trajectory segments. Explaining the trajectory modes shown in Fig. 5 by specific interactions between cellular structures and the receptor-ligand complex seems to be more realistic than a formation just by chance, which is theoretically possible.28 Heterogeneous diffusion behavior as well as the existence of discontinuous motion complicate MSD analysis of these trajectories. Also, the occurrence of mainly short trajectories limits the significance of MSD analysis. Different explanations for the appearance of short trajectories can be discussed. Dye bleaching as a main reason can be excluded, since the laser intensity of 1 kW/cm2 used in our experiments is quite low as could be judged from the observation of Alexa-NA immobilized on coverslips. Another reason could be the internalization of the ligand-receptor complexes. However, the used concentration of 0.5 nM Alexa-NA should be too low to initiate a significant β2AR internalization. Most probably, a fast dissociation of the ligand from the receptor binding site was responsible for the short observation duration of the receptor-ligand complexes. In our experiments, we found two different dwell times of τ1 = 77±1 and τ2 = 388±11 ms. The existence of two dwell times can be rationalized by the ternary complex model, where the ligand, the receptor, and the G-protein are involved.29, 30 This model assumes that GPCRs exist in different states, an active and an inactive receptor state, with varying agonist affinities. In the active state, the receptors are coupled to G-proteins with a high affinity to agonists resulting in a longer existence of the ligand-receptor complexes. In the inactive state, receptors are uncoupled from G-proteins. Therefore, the binding affinity is low causing a short existence time of the ligand-receptor complex. Also, additional receptor states have been discussed.31, 32 Hence, the detected short binding duration can be explained from a successful G-protein activation, which leads to a change in ligand kinetics. Fast binding events with high on- and off-rates are not detectable with classical techniques for measuring ligand-receptor binding kinetics such as a radio-receptor assay. Fig. 5Different diffusion modes of single β2AR-Alexa-NA complexes. Receptor-ligand complex (a) immobile, (b) diffusing in a restricted domain, and (c) with a heterogeneous diffusion profile. (d) MSD(t) of the trajectories shown in (a) (circles), (b) (triangle), and (c) (rectangle). Solid lines represent the fit of the data according to free Brownian motion or confined diffusion (see text).  The jump distance frequency distribution allowed to determine three different diffusion coefficients. Due to the limited localization precision of the microscope setup, receptor-ligand complexes with diffusion coefficients below 0.016 μm2/s and actually immobile molecules cannot be discriminated. Therefore, receptor-ligand complexes with D 1 = 0.005±0.0003 μm2/s were regarded as immobile. Most β2AR-Alexa-NA complexes (65±2%) showed a D 2 of 0.03 ± 0.001 μm2/s. Additionally, receptor-ligand complexes diffusing with D 3 = 0.15±0.02 μm2/s were monitored. Obviously, D 2 and D 3 characterize β2AR-Alexa-NA complexes with typical membrane protein mobilities also found for various GPCRs, since diffusion coefficients between 0.011 and 0.207 μm2/s and between 0.002 and 0.1 μm2/s were determined previously for NK1R and for OR17-40, respectively.26, 27 Comparing the diffusion coefficients we have calculated from our SPT-experiments with the ones published for the β2AR using different techniques, similar values were found. Barak measured diffusion coefficients between 0.4 and 1.2 μm2/s for β2ARs conjugated to GFP with an immobile fraction of 25% using FRAP.11 Hegener have performed FCS measurements using β2AR-Alexa-NA complexes yielding diffusion coefficients of 0.1 and 2.9 μm2/s.12 Almost immobile particles can well be detected by SPT, while this is not possible using FCS, since immobile molecules do not cause fluorescence fluctuations, which are the basis of FCS analysis. It is well known that agonistic stimulation of β2ARs initiates a signaling cascade leading to the synthesis of the secondary messenger cAMP. The regulatory processes of receptor desensitization and internalization are accompanied by interactions with various intracellular proteins (e.g., GRK2 and arrestin).33 Therefore, terbutaline stimulation was expected to affect the mobility of the β2AR-Alexa-NA complexes due to the initiation of signaling and regulatory processes. In fact, stimulation of A549 cells with 1 μM terbutaline markedly increased the fraction of immobile receptor-ligand complexes. As signaling and receptor desensitization occurs within seconds after stimulation, mainly redistribution of the receptor-ligand complex into early endosomes might be responsible for the initial mobility reduction.5 This process is known to happen within a few minutes at room temperature. This is also verified by fluorescence images of HEK293 cells over-expressing β2AR-GFP, where first β2AR aggregates within the plasma membrane were found after 5 min of terbutaline stimulation. Later on, subsequent internalization of the β2AR via clathrin-coated pits also requires a reduction of lateral mobility. This mobility reduction found using SPT coincides with the strong agonist-induced β2AR-GFP internalization as documented by fluorescence images. Whereas classical techniques such as FCS and FRAP are operating in an indirect manner, SPT allows a direct visualization and detection of receptor immobilization after stimulation in real time resulting from pharmacological and biochemical processes. But we did not only observe a reduction of β2AR mobility in terms of an increase in the immobile fraction. At the same time the membrane surface area, which was covered on the average by the receptors, was clearly reduced. This fact was quantified by the average trajectory area of all receptor-ligand complexes, which decreased time-dependently from 0.06±0.00007 to 0.04±0.00008 μm2 upon terbutaline stimulation. Receptor diffusion within smaller domains allows a more efficient interaction between the involved components in receptor activation, desensitization, and internalization. A decrease in trajectory diameter after agonistic stimulation seems to be typical for GPCRs. A time-dependent decrease in diffusion domain size after substance P binding was found for the NK1R in HEK293 cells.27 The number of small-sized trajectories of the odorant receptor OR17-40 was increased after agonistic and antagonistic stimulation of HEK293 cells, respectively.26 In order to identify intermediate states between large and small trajectory areas, the time-dependent influence of terbutaline on exclusively mobile receptor-ligand complexes was investigated. Therefore we eliminated all trajectories of immobile receptor-ligand complexes with jump distances below 80 nm. As expected, the mean trajectory area of the remaining mobile receptor-ligand complexes increased to 0.1±0.0001 μm2 in comparison to the value found for all trajectories. After stimulation with 1 μM terbutaline for 35 min, intermediate states of trajectory areas were not found at any time point, as the mean trajectory area was unaffected. Thus, an agonistic stimulation of the β2AR immediately leads to an immobilization of receptor-ligand complexes. 5.ConclusionIn summary, we presented a detailed analysis of the two-dimensional diffusion behavior of single β2AR-Alexa-NA complexes on live A549 cells by single molecule microscopy and single particle tracking. This approach allows the differentiation of various receptor diffusion modes, which might be related to different receptor states. The discovery of a clear relationship between the receptor states, which are temporarily formed during stimulation and regulation, and the corresponding diffusion modes will be a big step forward in the field of molecular drug research. To what extent the diffusion behavior of a distinct receptor-ligand complex can selectively be influenced to improve the pharmacological efficacy of drugs will be investigated in future projects. Single molecule microscopy is an indispensable tool to improve our understanding of the molecular processes of receptor-mediated signaling. ReferencesW. A. Goddard III and R. Abrol,
“3-Dimensional structures of G protein-coupled receptors and binding sites of agonists and antagonists,”
J. Nutr., 137
(6 Suppl 1), 1528S
–1538S
(2007). Google Scholar
S. J. Hill,
“G-protein-coupled receptors: past, present and future,”
Br. J. Pharmacol., 147
(1), S27
–S37
(2006). https://doi.org/10.1038/sj.bjp.0706455 Google Scholar
U. Gether and
B. K. Kobilka,
“G protein-coupled receptors. II. Mechanism of agonist activation,”
J. Biol. Chem., 273
(29), 17979
–17982
(1998). https://doi.org/10.1074/jbc.273.29.17979 Google Scholar
D. J. Vaughan, E. E. Millman, V. Godines, J. Friedman, T. M. Tran, W. Dai, B. J. Knoll, R. B. Clark, and
R. H. Moore,
“Role of the G protein-coupled receptor kinase site serine cluster in β2-adrenergic receptor internalization, desensitization, and β-arrestin translocation,”
J. Biol. Chem., 281
(11), 7684
–7692
(2006). https://doi.org/10.1074/jbc.M500328200 Google Scholar
S. S. G. Ferguson,
“Evolving concepts in G protein-coupled receptor endocytosis: the role in receptor desensitization and signaling,”
Pharmacol. Rev., 53
(1), 1
–24
(2001). Google Scholar
V. Cherezov,
“High-resolution crystal structure of an engineered human β2-adrenergic G protein-coupled receptor,”
Science, 318
(5854), 1258
–1265
(2007). https://doi.org/10.1126/science.1150577 Google Scholar
D. M. Rosenbaum,
“GPCR engineering yields high-resolution structural insights into β2-adrenergic receptor function,”
Science, 318
(5854), 1266
–1273
(2007). https://doi.org/10.1126/science.1150609 Google Scholar
J. G. Baker, I. P. Hall, and
S. J. Hill,
“Influence of agonist efficacy and receptor phosphorylation on antagonist affinity measurements: differences between second messenger and reporter gene responses,”
Mol. Pharmacol., 64
(3), 679
–688
(2003). https://doi.org/10.1124/mol.64.3.679 Google Scholar
B. January, A. Seibold, B. Whaley, R. W. Hipkin, D. Lin, A. Schonbrunn, R. Barber, and
R. B. Clark,
“β2-adrenergic receptor desensitization, internalization, and phosphorylation in response to full and partial agonists,”
J. Biol. Chem., 272
(38), 23871
–23879
(1997). https://doi.org/10.1074/jbc.272.38.23871 Google Scholar
L. Prenner, A. Sieben, K. Zeller, D. Weiser, and
H. Häberlein,
“Reduction of high-affinity β2-adrenergic receptor binding by hyperforin and hyperoside on rat C6 glioblastoma cells measured by fluorescence correlation spectroscopy,”
Biochem., 46
(17), 5106
–5113
(2007). https://doi.org/10.1021/bi6025819 Google Scholar
L. S. Barak, S. S. G. Ferguson, J. Zhang, C. Martenson, T. Meyer, and
M. G. Caron,
“Internal trafficking and surface mobility of a functionally intact β2-adrenergic receptor-green fluorescent protein conjugate,”
Mol. Pharmacol., 51
(2), 177
–184
(1997). Google Scholar
O. Hegener, L. Prenner, F. Runkel, S. L. Baader, J. Kappler, and
H. Häberlein,
“Dynamics of β2-adrenergic receptor-ligand complexes on living cells,”
Biochem., 43
(20), 6190
–6199
(2004). https://doi.org/10.1021/bi035928t Google Scholar
J. P. Siebrasse, D. Grunwald, and
U. Kubitscheck,
“Single-molecule tracking in eukaryotic cell nuclei,”
Anal. Bioanal. Chem., 387
(1), 41
–44
(2007). https://doi.org/10.1007/s00216-006-0763-0 Google Scholar
M. J. Saxton and
K. Jacobson,
“Single-particle tracking: applications to membrane dynamics,”
Annu. Rev. Biophys. Biomol. Struct., 26 373
–399
(1997). https://doi.org/10.1146/annurev.biophys.26.1.373 Google Scholar
C. Krasel, M. Bunemann, K. Lorenz, and
M. J. Lohse,
“β-Arrestin binding to the β2-adrenergic receptor requires both receptor phosphorylation and receptor activation,”
J Biol. Chem., 280
(10), 9528
–9535
(2005). https://doi.org/10.1074/jbc.M413078200 Google Scholar
C. M. Anderson, G. N. Georgiou, I. E. G. Morrison, G. V. W. Stevenson, and
R. J. Cherry,
“Tracking of cell surface receptors by fluorescence digital imaging microscopy using a charge-coupled device camera. Low-density lipoprotein and influenza virus receptor mobility at 4 degrees C,”
J. Cell. Sci., 101
(2), 415
–425
(1992). Google Scholar
P. R. Smith, I. E. Morrison, K. M. Wilson, N. Fernandez, and
R. J. Cherry,
“Anomalous diffusion of major histocompatibility complex class I molecules on HeLa cells determined by single particle tracking,”
Biophys. J., 76
(6), 3331
–3344
(1999). https://doi.org/10.1016/S0006-3495(99)77486-2 Google Scholar
U. Kubitscheck, O. Kuckmann, T. Kues, and
R. Peters,
“Imaging and tracking of single GFP molecules in solution,”
Biophys. J., 78
(4), 2170
–2179
(2000). https://doi.org/10.1016/S0006-3495(00)76764-6 Google Scholar
J. P. Siebrasse, R. Veith, A. Dobay, H. Leonhardt, B. Daneholt, and
U. Kubitscheck,
“Discontinuous movement of mRNP particles in nucleoplasmic regions devoid of chromatin,”
Proc. Natl. Acad. Sci. USA, 105
(51), 20291
–20296
(2008). https://doi.org/10.1073/pnas.0810692105 Google Scholar
D. Grunwald, B. Spottke, V. Buschmann, and
U. Kubitscheck,
“Intranuclear binding kinetics and mobility of single native U1 snRNP particles in living cells,”
Mol. Biol. Cell., 17
(12), 5017
–5027
(2006). https://doi.org/10.1091/mbc.E06-06-0559 Google Scholar
A. Sieben,
“Characterization of the lateral diffusion of single β2-adreneric receptor-ligand-complexes in living cells,”
(2008). Google Scholar
B. de Vries, H. Meurs, A. F. Roffel, C. R. Elzinga, B. H. Hoiting, M. M. de Vries, and
J. Zaagsma,
“β-agonist-induced constitutive β2-adrenergic receptor activity in bovine tracheal smooth muscle,”
Br. J. Pharmacol., 131
(5), 915
–920
(2000). https://doi.org/10.1038/sj.bjp.0703664 Google Scholar
B. Chini and
M. Parenti,
“G-protein coupled receptors in lipid rafts and caveolae: how, when and why do they go there,”
J. Mol. Endocrinol., 32
(2), 325
–338
(2004). https://doi.org/10.1677/jme.0.0320325 Google Scholar
K. Simons and
E. Ikonen,
“Functional rafts in cell membranes,”
Nature (London), 387
(6633), 569
–572
(1997). https://doi.org/10.1038/42408 Google Scholar
A. Kusumi and
Y. Sako,
“Cell surface organization by the membrane skeleton,”
Curr. Opin. Cell. Biol., 8
(4), 566
–574
(1996). https://doi.org/10.1016/S0955-0674(96)80036-6 Google Scholar
V. Jacquier, M. Prummer, J. M. Segura, H. Pick, and
H. Vogel,
“Visualizing odorant receptor trafficking in living cells down to the single-molecule level,”
Proc. Natl. Acad. Sci. USA, 103
(39), 14325
–14330
(2006). https://doi.org/10.1073/pnas.0603942103 Google Scholar
Y. Lill, K. L. Martinez, M. A. Lill, B. H. Meyer, H. Vogel, and
B. Hecht,
“Kinetics of the initial steps of G protein-coupled receptor-mediated cellular signaling revealed by single-molecule imaging,”
ChemPhysChem, 6
(8), 1633
–1640
(2005). https://doi.org/10.1002/cphc.200500111 Google Scholar
M. J. Saxton,
“Lateral diffusion in an archipelago. Single-particle diffusion,”
Biophys. J., 64
(6), 1766
–1780
(1993). https://doi.org/10.1016/S0006-3495(93)81548-0 Google Scholar
A. De Lean, J. M. Stadel, and
R. J. Lefkowitz,
“A ternary complex model explains the agonist-specific binding properties of the adenylate cyclase-coupled β-adrenergic receptor,”
J. Biol. Chem., 255
(15), 7108
–7117
(1980). Google Scholar
P. Samama, S. Cotecchia, T. Costa, and
R. J. Lefkowitz,
“A mutation-induced activated state of the β2-adrenergic receptor. Extending the ternary complex model,”
J. Biol. Chem., 268
(7), 4625
–4636
(1993). Google Scholar
S. Maudsley, B. Martin, and
L. M. Luttrell,
“The origins of diversity and specificity in G protein-coupled receptor signaling,”
J. Pharmacol. Exp. Ther., 314
(2), 485
–494
(2005). https://doi.org/10.1124/jpet.105.083121 Google Scholar
R. Seifert, K. Wenzel-Seifert, U. Gether, and
B. K. Kobilka,
“Functional differences between full and partial agonists: evidence for ligand-specific receptor conformations,”
J. Pharmacol. Exp. Ther., 297
(3), 1218
–1226
(2001). Google Scholar
C. A. Moore, S. K. Milano, and
J. L. Benovic,
“Regulation of receptor trafficking by GRKs and arrestins,”
Annu. Rev. Physiol., 69 451
–482
(2007). https://doi.org/10.1146/annurev.physiol.69.022405.154712 Google Scholar
|