
|
|
1.IntroductionInterferometry-based quantitative phase contrast techniques enable high-resolution topography inspection of reflective surfaces,1 label-free minimally invasive live cell analysis, 2, 3, 4, 5, 6, 7, 8, 9 and quantitative tomographic imaging. 10, 11, 12, 13, 14 However, a drawback of many experimental arrangements 1, 2, 4, 5, 6, 7, 9, 10, 11, 12, 13 is the requirement for a separate reference wave, which results in a phase stability decrease and the demand for a precise adjustment of the intensity ratio between object and reference wave. To overcome these problems several approaches were reported. For example, in Fourier phase microscopy3 a programmable phase modulator is used for temporal phase shifting of a reference wave that is generated by the spatially filtered object wave. In diffraction phase microscopy,8 object and reference waves are generated by a diffractive optical element (DOE) in combination with a spatial filter. In spatial light phase microscopy,15 a spatial light modulator (SLM) is used to create a similar but more flexible setup. In quadriwave lateral shearing interferometry16 by a DOE, two orthogonal phase gradient maps are created from which quantitative phase contrast images are retrieved numerically. An interferometer setup in which the image of a sample is superimposed by an inverted image that is created by an additional lens in combination with movable mirrors to achieve an enhanced depth of field was reported in Ref. 17. Furthermore, in Ref. 18 an approach is described in which the reflective surface of a cover glass above the sample was used to generate a reference wave. Here, in order to avoid a separately generated reference wave, a Michelson interferometer approach for digital holographic microscopy (DHM) is presented. The advantage of the proposed setup as compared to other self-interference or common path-based approaches no additional components such as temporal phase shifting devices,3 lenses,17 or customized reflective surfaces18 are required. Furthermore, no optical elements such as DOEs16 or SLMs 14, 15 are used, which may be expensive or possibly affect the object wave by spatial filtering and thus decrease the lateral resolution. 2.Experimental Setup and Hologram EvaluationFigure 1 shows a sketch and a photo of the experimental setup, which was attached to an inverted research microscope (Zeiss Axio Observer A1, Carl Zeiss Micro Imaging GmbH, Göttingen, Germany). The sample was illuminated in transmission with coherent light [frequency doubled Nd:yttrium aluminium garnet (YAG) laser: (Compass 100, Coherent GmbH, Lübeck, Germany), λ = 532 nm] via a single mode optical fiber (SM). This was performed by inserting a nonpolarizing beam splitter cube (BS1) into the illumination path of the microscope's white light source (WS). Thus, the microscope condenser (CL) could be used for optimized (Koehler like) illumination. The sample (S) was imaged by a microscope lens (MO). Behind the MO the light was coupled into a Michelson interferometer arrangement, consisting of two mirrors (M1, M2) and a beam splitter cube (BS2), which was attached to the camera side port of the microscope. To create a suitable spatial carrier fringe pattern for off-axis holography, mirror M2 was tilted by an angle α in such a way that an area of the sample that contained no object was superposed with the image of the specimen. Note that due to the Michelson interferometer design in areas without specimen two wave fronts with nearly identical curvatures are superimposed. This is even fulfilled for an imaging geometry with two slightly divergent waves that differs from the collimated arrangement, which is sketched in Fig. 1a to simplify the illustration of the proposed measurement principle. Thus, an almost ideal pattern of parallel off-axis spatial carrier fringes is formed. In contrast to Mach–Zehnder setups, as for example described in Refs. 1, 2, 5, 6, 7, 9, 10, 11, 12, 13, the fringe curvature and orientation as well as the spatial carrier frequency do not depend on the object illumination alignment. Furthermore, two waves with almost identical intensity and polarization are created. Hence, a maximized constant interference fringe contrast is achieved, which is independent of the polarization and the intensity of the object illumination. The resulting digital off-axis holograms were recorded by a charge coupled device sensor (CCD, The Imaging Source DMK 41BU02, Bremen, Germany) and transferred via a USB 2.0 interface to a computer. The numerical reconstruction of the quantitative DHM phase contrast images from the digital holograms was performed by spatial phase shifting-based reconstruction as reported previously in Refs. 2 and 7. In the case of unfocused imaging, numerical autofocusing was applied as described in Ref. 19. Fig. 1Schematic (left) and photo (right) of the experimental setup. WS: white light source; BS1, BS2: beam splitter cubes; CL: condenser lens; SM: single mode fiber; S: sample (here: Petri dish with adherent cells); MO: microscope lens; M1, M2: mirrors; CCD: charge coupled device sensor; α: tilt angle; PC: computer; HC: heating chamber.  3.Cell PreparationIn order to analyze the capability of the method for quantitative phase contrast imaging, investigations on living human pancreas tumor cells [PaTu8988T, (Ref. 7)] were performed. The cells were observed in Petri dishes (μ-Dish, ibidi GmbH, Munich, Germany) with a collagen I coated bottom in cell culture medium (DMEM, supplemented with 5% fetal calf serum, 5% horse serum, and 2-mM L-glutamine, buffered with 20-mM Hepes). A heating chamber (HT200, ibidi GmbH, Munich, Germany) was used for temperature stabilization at 37°C. 4.ResultsFigure 2 illustrates the measurement principle by white light images and the evaluation of a digital hologram that were obtained from three living PaTu8988T cells by using a 40× microscope lens (Zeiss LD Plan-Neofluar 40/0.6 Korr). For both, white light imaging and hologram recording, the specimens were sharply focused onto the CCD sensor. Figures 2a, 2b, 2c show white light images of the cells obtained from mirror M1 (optical path of mirror M2 blocked), from mirror M2 (optical path of mirror M1 blocked), and the superimposed image obtained by using both mirrors, M1 and M2. In Fig. 2d a digital hologram is depicted which corresponds to the configuration in Fig. 2c. For hologram recording, the white light illumination was replaced by the coherent light of the frequency doubled Nd:YAG laser. The angle α between the two mirrors M1, M2 was chosen in such way that a spatial carrier fringe frequency with a spatial phase gradient near 0.5π per pixel20 for optimized numerical reconstruction was generated. The resulting parallel carrier fringe pattern is depicted in the enlarged part of Fig. 2d. Figure 2e shows the spatial frequency spectrum of the hologram in Fig. 2d that was calculated by a two-dimensional fast Fourier transformation (FFT). The narrow peaks that are marked in Fig. 2d with arrows demonstrate the high linear degree of the carrier fringe pattern. Finally, Fig. 2e presents the reconstructed quantitative phase contrast image. Each of the two sheared wave fronts serves as a reference wave for the complementary wave. Thus, the cells appear in inverse phase contrast as they are imaged with different mirrors. Fig. 2Principles of white light imaging and hologram evaluation. (a) white light image of PaTu8988T cells from mirror M1 (M2 blocked); (b) white light image from mirror M2 (M1 blocked); (c) white light image from M1+M2; (d) digital off-axis hologram with enlarged spatial carrier fringe pattern; (e) two dimensional frequency spectrum of (d); (f) quantitative phase contrast image numerically reconstructed from (d) (coded to 256 gray levels). 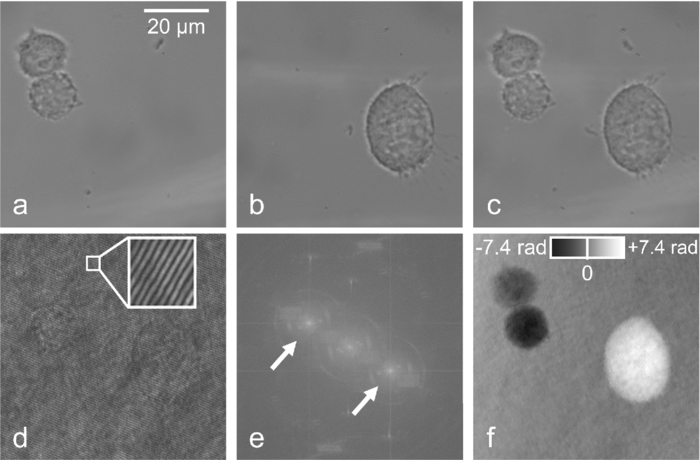 To characterize the phase stability of the Michelson interferometer approach, comparative time-lapse investigations with the setup sketched in Fig. 1 and a modular DHM system based on a Mach–Zehnder interferometer with a fiber optic reference wave (see detailed description in Ref. 21) were performed. The experiments were performed without a sample on the same vibration isolated table. Both systems were attached to the same Zeiss Axio Observer A1 microscope. Figures 3a and 3b exemplarily show the temporal dependency of the reconstructed phase distributions Δφ(t) in an area of 5×5 pixels as well as the corresponding calculated optical path length (OPL) changes ΔOPL = λ(Δφ/2π) for periods of 1 and 60 min. The phase contrast images were reconstructed from digital holograms that were recorded with acquisition rates of 1 hologram per second for the period of 1 minute and 1 hologram per minute for the period of 60 min. For the proposed Michelson interferometer setup an up to 5 times lower value for the standard deviations σΔφ,t and σΔOPL,t of the measured Δφ(t) and ΔOPL(t) values than for the Mach–Zehnder interferometer-based setup is obtained. The peaks that are observed in Fig. 3 for Δφ(t) and ΔOPL(t) for the Mach–Zehnder setup may be explained by thermal drifts and air fluctuations. These disturbances induce phase difference changes between the two fiber optical paths which appear significantly reduced in the Michelson interferometer setup. In order to compare the accuracy for the detection of optical path length changes within single quantitative phase contrast images the phase noise σΔφ, x,y was quantified for each system without a sample as described in Ref. 22. For the Michelson interferometer setup σΔφx,y was determined to 0.16 rad while for the Mach–Zehnder setup σΔφ,x,y amounted to 0.09 rad. This corresponds to mean accuracies for the detection of optical path length changes σΔOPL, x,y of 13.6 and 7.6 nm. Fig. 3Comparison of the temporal phase stability Δφ(t) of the simplified DHM concept to a fiber optic-based Mach–Zehnder setup (a) for a period of 1 min (acquisition rate one hologram per second); the standard deviations of the temporal phase changes σΔφ,t correspond to the mean accuracies for the detection of optical path length changes σΔOPL, t = 4.2 nm (simplified DHM setup), σΔOPL, t = 26.0 nm = 26.0 nm (Mach–Zehnder setup); and (b) for a period of 60 min (acquisition rate one hologram per min); the standard deviations of the temporal phase change σΔφ,t correspond to the mean accuracies for the detection of optical path length changes σΔOPL, t = 5.3 nm (simplified DHM setup), σΔOPL, t = 17.7 nm (Mach–Zehnder setup); black line: simplified Michelson interferometer setup, green line: fiber optic-based Mach–Zehnder interferometer.  Finally, in time-lapse measurements the migration of the PaTu8988T cells was analyzed. Therefore, 128 digital off-axis holograms of selected cells were recorded every 3 min over a period of 6.3 h by using a 20× microscope lens (Zeiss LD Acroplan 20×/0.4 Korr). Figure 4 shows exemplary quantitative phase contrast images. Video 1 (see Fig. 4) shows a corresponding fast motion movie. Subcellular structures like the nuclear envelope and the nucleoli as well as the thin borders of the cells become visible. Furthermore, cell migration and cell division can be clearly observed. Due to the high phase stability of the Michelson interferometer arrangement, 95% of the quantitative phase contrast images were obtained without reconstruction artifacts such as phase unwrapping errors. Note that cells that are imaged by different mirrors can be identified as nonambiguous as they appear in inverse phase contrast. Fig. 4Quantitative DHM phase contrast images of living PaTu8988T cells on a collagen coated surface for t = 0, t = 2 h, t = 4 h, t = 6 h. 1 shows a corresponding fast motion movie. (QuickTime, 1.4MB)  5.Discussion and ConclusionsIn summary, a significantly simplified and cost efficient approach for DHM with very low alignment demands was presented, which is capable for quantitative phase contrast imaging of living cells. The arrangement can be attached as a modular add-on to common research microscopes. The measurement concept leads to improved temporal phase stability in comparison to fiber optic Mach–Zehnder interferometer-based DHM systems. It has to be mentioned that due to the specific design of the experimental setup, specimen free reference areas (SFRAs) near the sample are required. The SFRAs should be at least the size of the investigated sample (here: the lateral cell diameter which amounts to ≈30 μm). Thus, the method is currently limited to single cell analysis with low densities of adherent or suspended cells in which the specimen appear laterally separated within the field of view. However, this problem may be solved by observation chambers with adequately structured coated bottom areas that prevent cell adherence. The analysis of the spatial phase noise within the quantitative phase contrast images shows that the accuracy for the detection of optical path length changes for the simplified DHM arrangement is lower than for a Mach–Zehnder setup. This may be explained by the circumstance that in the Michelson interferometer setup both waves are affected by coherent disturbances due to scattering effects from the microscope imaging system. Furthermore, for the described live cell imaging experiments, both waves pass the same volume of the chamber in which the cells are observed. Thus, additional scattering effects of the cell culture medium can be expected also in SFRAs. However, such disturbances individually depend on the applied measurement setup and the sample preparation. Nevertheless, Fig. 4 demonstrates that the proposed method is capable for label-free live cell imaging with subcellular resolution even for long-term migration observations. Thus, the simplified DHM concept prospects to be a versatile tool to generate quantitative phase contrast data in a very simple way, which may be further evaluated to quantify cell adherence and tumor cell motility, as well as for dry mass measurements and the analysis of the cellular refractive index. Moreover, due to almost identical optical path lengths within the interferometer, the system is also particularly suitable for the use of low cost light sources with a short coherence length. In addition, by using light sources with a decreased coherence length an improvement of the quantitative phase contrast images due to a minimization of disturbing coherence effects may be achieved. Finally, as the spatial carrier fringes are not affected by the object wave alignment, the setup prospects to be used in tomographic phase microscopy 10, 11, 12, 13 of transparent and reflective samples with suitable SFRAs. Here, a simplification of the experimental setup and an acceleration of the data acquisition time by application of spatial shifting based phase retrieval instead of temporal phase shifting may be achieved. AcknowledgmentsThis work was partly supported by the German Federal Ministry for Education and Research within the focus program “Biophotonics” (FKZ13N10937). ReferencesE. Cuche, P. Marquet, and
C. Depeursinge,
“Simultaneous amplitude contrast and quantitative phase-contrast microscopy by numerical reconstruction of Fresnel off-axis holograms,”
Appl. Opt., 38 6694
–7001
(1999). https://doi.org/10.1364/AO.38.006994 Google Scholar
D. Carl, B. Kemper, G. Wernicke, and
G. von Bally,
“Parameter optimized digital holographic microscope for high-resolution living cell analysis,”
Appl. Opt., 43 6536
–6544
(2004). https://doi.org/10.1364/AO.43.006536 Google Scholar
G. Popescu, L. P. Deflores, J. C. Vaughan, K. Badizadegan, H. Iwai, R. R. Dasari, and
M. S. Feld,
“Fourier phase microscopy for investigation of biological structure and dynamics,”
Opt. Lett., 29 2503
–2505
(2004). https://doi.org/10.1364/OL.29.002503 Google Scholar
P. Marquet, B. Rappaz, P. J. Magistretti, E. Cuche, Y. Emery, T. Colomb, and
C. Depeursinge,
“Digital holographic microscopy: a noninvasive contrast imaging technique allowing quantitative visualization of living cells with subwavelength axial accuracy,”
Opt. Lett., 30 468
–470
(2005). https://doi.org/10.1364/OL.30.000468 Google Scholar
C. J. Mann, L. F. Yu, C. M. Lo, and
M. K. Kim,
“High-resolution quantitative phase-contrast microscopy by digital holography,”
Opt. Express, 13 8693
–8698
(2005). https://doi.org/10.1364/OPEX.13.008693 Google Scholar
T. Ikeda, G. Popescu, R. R. Dasari, and
M. S. Feld,
“Hilbert phase microscopy for investigating fast dynamics in transparent systems,”
Opt. Lett., 30 1165
–1167
(2005). https://doi.org/10.1364/OL.30.001165 Google Scholar
B. Kemper, D. Carl, J. Schnekenburger, I. Bredebusch, M. Schäfer, W. Domschke, and
G. von Bally,
“Investigation of living pancreas tumor cells by digital holographic microscopy,”
J. Biomed. Opt., 11 034005
(2006). https://doi.org/10.1117/1.2204609 Google Scholar
G. Popescu, T. Ikeda, R. R. Dasari, and
M. S. Feld,
“Diffraction phase microscopy for quantifying cell structure and dynamics,”
Opt. Lett., 31 775
–778
(2006). https://doi.org/10.1364/OL.31.000775 Google Scholar
G. Coppola, G. Di Caprio, M. Gioffré, R. Puglisi, D. Balduzzi, A. Galli, L. Miccio, M. Paturzo, S. Grilli, A. Finizio, and
P. Ferraro,
“Digital self-referencing quantitative phase microscopy by wavefront folding in holographic image reconstruction,”
Opt. Lett., 35 3390
–3392
(2010). https://doi.org/10.1364/OL.35.003390 Google Scholar
V. Lauer,
“New approach to optical diffraction tomography yielding a vector equation of diffraction tomography and a novel tomographic microscope,”
J. Microsc., 205 165
–176
(2002). https://doi.org/10.1046/j.0022-2720.2001.00980.x Google Scholar
W. Choi, C. Fang-Yen, K. Badizadegan, S. Oh, N. Lue, R. R. Dasari, and
M. S. Feld,
“Tomographic phase microscopy,”
Nature Meth., 4 717
–719
(2007). https://doi.org/10.1038/nmeth1078 Google Scholar
M. Debailleul, V. Georges, B. Simon, R. Morin, and
O. Haeberlé,
“High-resolution three-dimensional tomographic diffractive microscopy of transparent inorganic and biological samples,”
Opt. Lett., 34 79
–81
(2009). https://doi.org/10.1364/OL.34.000079 Google Scholar
M. Sarmis, B. Simon, M. Debailleul, B. Colicchio, V. Georges, J.-J. Delaunay, and
O. Haeberlé,
“High resolution reflection tomographic diffractive microscopy,”
J. Mod. Opt., 57 740
–745
(2010). https://doi.org/10.1080/09500341003624743 Google Scholar
R. Fiolka, K. Wicker, R. Heintzmann, and
A. Stemmer,
“Simplified approach to diffraction tomography in optical microscopy,”
Opt. Express, 17 12407
–12417
(2009). https://doi.org/10.1364/OE.17.012407 Google Scholar
H. Ding and
G. Popescu,
“Instantaneous spatial light interference microscopy,”
Opt. Express, 18 1569
–1575
(2010). https://doi.org/10.1364/OE.18.001569 Google Scholar
P. Bon, G. Maucort, B. Wattellier, and
S. Monneret,
“Quadriwave lateral shearing interferometry for quantitative phase microscopy of living cells,”
Opt. Express, 17 13080
–13094
(2009). https://doi.org/10.1364/OE.17.013080 Google Scholar
J. Jang, C. Y. Bae, J.-K. Park, and
J. C. Ye,
“Self-reference quantitative phase microscopy for microfluidic devices,”
Opt. Lett., 35 514
–516
(2010). https://doi.org/10.1364/OL.35.000514 Google Scholar
N. T. Shaked, Y. Zhu, N. Badie, N. Bursac, and
A. Wax,
“Reflective interferometric chamber for quantitative phase imaging of biological sample dynamics,”
J. Biomed. Opt., 15 030503
(2010). https://doi.org/10.1117/1.3420179 Google Scholar
P. Langehanenberg, B. Kemper, D. Dirksen, and
G. von Bally,
“Autofocusing in digital holographic phase contrast microscopy on pure phase objects for live cell imaging,”
Appl. Opt., 47 D176
–D182
(2008). https://doi.org/10.1364/AO.47.00D176 Google Scholar
B. Kemper, J. Kandulla, D. Dirksen, and
G. von Bally,
“Optimization of spatial phase shifting in endoscopic electronic-speckle-pattern-interferometry,”
Opt. Commun., 217 151
–160
(2003). https://doi.org/10.1016/S0030-4018(03)01173-8 Google Scholar
B. Kemper, D. Carl, A. Höink, G. von Bally, I. Bredebusch, and
J. Schnekenburger,
“Modular digital holographic microscopy system for marker free quantitative phase contrast imaging of living cells,”
Proc. SPIE, 6191 61910T
(2006). https://doi.org/10.1117/12.662781 Google Scholar
C. Remmersmann, S. Stürwald, B. Kemper, P. Langehanenberg, and
G. von Bally,
“Phase noise optimization in temporal phase-shifting digital holography with partial coherence light sources and its application in quantitative cell imaging,”
Appl. Opt., 48 1463
–1472
(2009). https://doi.org/10.1364/AO.48.001463 Google Scholar
|


