
|
|
1.IntroductionCurrently most corneas that are used for cornea transplant surgery are from cadaveric donors and are procured, processed, and stored by eye banks.1 It is desirable that precious corneas from donors can be stored for longer periods of time with minimal structural and functional changes when needed for transplantation, and longer storage would effectively increase the supply repository, ensuring viable corneas are available when needed. The maximum storage time and the final quality of corneas for transplantation are mainly determined by the storage media, storage temperature, storage time, cooling rate, and warming-up rate.2, 3, 4 Therefore, it is very important to evaluate the influence of these factors on the morphological and functional changes during the preservation, especially when developing a new preservation medium. In clinics or eye banks, specular microscopy and corneal topology are the standard methods used to screen donor cornea quality by evaluating corneal morphology.5, 6, 7 However, these methods require the removal of the cornea from its sterile storage which might cause potential contamination and interrupt the tissue stability during storage. In addition, it is challenging for these methods to assess the cornea quality throughout the entire cornea. Therefore, a new technology is desirable to sterilely assess the entire cornea for testing the effects of storage media on maintaining corneal structures. Optical coherence tomography (OCT) is a noninvasive, high-resolution cross-sectional imaging technique and can be an ideal tool for corneal assessment.8, 9, 10 In this study, we systematically investigated the potential of ultrahigh-resolution OCT for assessing the morphological changes of human corneas preserved in two media including a test solution (TS) under development and a standard one [Optisol-GS from Bausch & Lomb Inc. (GS)]. The purpose for using the test and standard media was to see if the effects on corneal structures with different media over time can be assessed with OCT. Furthermore, the variation of the group refractive index in the two storage media were also monitored with OCT to accurately extract the corneal geometrical thickness and assess the optical properties during the preservation process. The preliminary results revealed that corneas in the two media exhibited different but correlated changes in corneal structure, thickness, group refractive index and hydration in 28 days’ or 15 days’ preservation and subsequent return to normothermic conditions (warming-up process). This study demonstrates that the noncontact, noninvasive, and high-resolution OCT is a powerful tool for noninvasive characterization of tissue structural and functional changes of preserved cornea and for assessment of the effects of preservation media on stored tissue integrity. 2.Methods and Materials2.1.Methods and Experimental SystemOCT imaging was performed using a traditional ultrahigh-resolution time-domain OCT system with a home-built Ti:Sapphire laser as the low-coherence light source, which had a center wavelength of 825 nm and a spectral bandwidth of 145 nm, as shown in Fig. 1a. The axial resolution in air was approximately 2.9 μm by measuring the FWHM of the envelope of the interference signal from a mirror; and in corneal tissue it was estimated to ∼2.1 μm by dividing the measured axial resolution in air by the measured refractive index of the corneas (∼1.38–1.4, see results in Sec. 3.2). The imaging beam was scanned over the cornea in a noncontact fashion by a handheld imaging probe which was mounted on a translation stage. The transverse resolution was measured as ∼5.6 μm in the focus, and outside the confocal range the transverse resolution degraded following the Gaussian beam profile along the imaging depth. Each OCT image consisted of 1000×1500 pixels (width×depth) corresponding to 1 mm wide by 1.2–2 mm depth with an A scan rate of ∼100 Hz. The excitation power on the tissue sample was controlled at about 3.5 mW, and a detection sensitivity of 105 dB was achieved. Fig. 1(a) Schematic of the time-domain OCT system with a home-built Ti:Sapphire laser as the low-coherence light source. The measured axial and transverse resolutions were 2.9 and 5.6 μm in air, respectively. (b) Scheme of the multiple consecutive OCT imaging. Six tiny registration sites were uniformly marked with India ink along the circumference of the corneal limbus and the six dots formed three lines that were across the cornea center.  In OCT images, the apparent separation between the anterior and the posterior surface of the cornea is defined as optical thickness (OT). The optical thickness in OCT is the product of the geometrical thickness (GT) and the group refractive index (n c) of the cornea,11 i.e., Eq. 1[TeX:] \documentclass[12pt]{minimal}\begin{document}\begin{equation} OT = n_c \times GT. \end{equation}\end{document}Eq. 2[TeX:] \documentclass[12pt]{minimal}\begin{document}\begin{equation} OS = (n_c - n_r) \,\times\, GT. \end{equation}\end{document}Eq. 3[TeX:] \documentclass[12pt]{minimal}\begin{document}\begin{equation} n_c = \frac{{OT}}{{OT - OS}} \times n_r, \end{equation}\end{document}Eq. 4[TeX:] \documentclass[12pt]{minimal}\begin{document}\begin{equation} GT = \frac{{OT - OS}}{{n_r}}, \end{equation}\end{document}Eq. 5[TeX:] \documentclass[12pt]{minimal}\begin{document}\begin{equation} \frac{{dn_c}}{{n_c}} = \frac{{OS}}{{OT - OS}}\sqrt {\left({\frac{{\delta OT}}{{OT}}} \right)^2 + \left({\frac{{\delta OS}}{{OS}}} \right)^2}, \end{equation}\end{document}Fig. 2(a) Schematic of the three steps in calculating refractive index. (b) Merged three OCT images of (1) the cover glass without the cornea (cyan color), (2) the cover glass with the cornea sitting on it (red color), and (3) the cornea sitting on the cover glass (magenta color). OT is the optical thickness of the cornea, and OS the optical shift of the cover glass due to the cornea. The group refractive index of the cornea is calculated as the ratio of OT over the difference between OT and OS.  2.2.MaterialsIn this pilot study, paired human corneas were randomly selected by the eye bank, with one cornea stored in the TS medium and the other in the GS medium at time of harvest. A total of three pairs of human corneas were involved in this study. Six tiny registration sites were uniformly marked with India ink along the circumference of the corneal limbus and the six dots formed three lines that were across the cornea center, as shown in Fig. 1b. Along each line, multiple consecutive OCT images were acquired in ∼60 s and stitched together with each image of 1000×1500 pixels (width×depth) corresponding to 1 mm wide by 1.2–2 mm depth. During OCT imaging (except the terminal time point), the entire cornea remained in the container (which sat on ice with the lid open) and submerged within the storage medium. During the measurement of the group refractive index, two pairs of the corneas were taken from the medium and put on a cover glass for 1–2 min. After imaging, the corneas were returned to 4°C storage. The same imaging procedure was performed on day 0, 1, 3, 5, 7, 10, 14 (and/or 17, 21, and 24). To study the influence of returning the corneas to a normothermic environment following preservation on the corneal structure, the corneas were removed from the storage media on day 15 or day 27 and incubated with cell culture medium (McCoys5A, 10% FBS, ATCC) at 37°C and 5% CO2. OCT imaging was conducted after 6 hours and 24 hours incubation, then fixed in 10% buffered formalin for further histological analysis. 3.Results and Discussions3.1.Corneal Morphological Changes During the PreservationFigure 3 illustrates representative time series OCT images of the pair of human corneas (with one in GS and the other in TS media) at some key time points (Day 0, 7, 17 and 27). The image size (width×depth) is 1×1.2 mm for Day 0 and 7, 1×1.5 mm for Day 17 and 1×2 mm for Day 27. As seen on Day 0 images, the layered structures of the corneas in both media can be clearly identified, including the epithelium, Bowman's membrane, stroma, Descemet's membrane, and endothelium.13 These layered structures remained almost intact in both media up to Day 7 (see Fig. 4). The images on Day 7 did show some bumpy appearance of the epithelial and it suggests minor damages of the superficial epithelial cells during the storage. From Day 10, the corneal epithelium in GS started becoming brushy, indicating the damage of the superficial epithelial cells, while the cornea in TS still kept its epithelial integrity. By Day 17, the corneal epithelium in GS was completely lost, whereas in TS the epithelium only became thinner. In a systematic evaluation of the entire cornea in GS, we found that the epithelium experienced gradual desquamation from Day 14 to Day 17 [see Figs. 5a and 5b]. It is noticed that the desquamation started from the corneal apex and then expanded to the edge of the cornea. By comparison, in TS the entire corneal epithelium became thinner and remained up to 21 days [see Figs. 5c and 5d]. Fig. 3Representative cross-sectional OCT images of corneas in preservation media (a) a standard medium—GS and (b) a test medium―TS on Day 0, 7, 17, and 27. Layered structures can be clearly identified. 1. Epithelium; 2. Bowman's membrane; 3. Stroma; 4. Descemet's membrane; and 5. Endothelium. Scale bar: 200 μm. 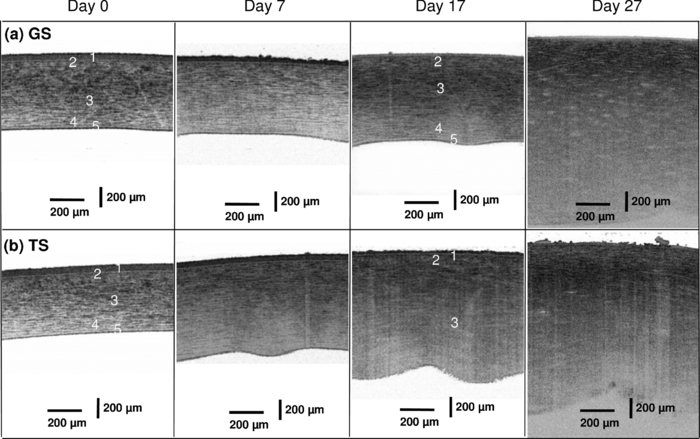 Fig. 4Representative OCT images of the cornea stored in GS on: (a) Day 3 and (b) Day 7 and in TS on (c) Day 3 and (d) Day 5. The layered structures remained almost intact in both media up to 10 days, except that the endothelium of the cornea in TS appeared obvious bumps.  Fig. 5Representative OCT images of the cornea stored in GS on: (a) Day 14 and (b) Day 17 and in TS on (c) Day 14 and (d) Day 21. In GS, the epithelium experienced gradual desquamation started from the corneal apex and then expanded to the edge of the cornea. By comparison, in TS the whole corneal epithelium only became thinner and remained up to 21 days.  In addition to desquamation, the endothelium and stroma in the corneas stored in the two media also experienced distinct changes. During systematic evaluation of the entire cornea, we found that some small bumps appeared in the endothelium of the corneas in TS from Day 3 and enlarged with time [see Figs. 4c and 4d], while no obvious bumps were observed in the endothelium of the cornea in GS up to Day 7 [see Figs. 4a and 4b]. Damage became evident for the endothelium in the cornea stored in TS from Day 14 to Day 21 [see Figs. 5c and 5d]. By contrast, the endothelium of the cornea in GS only showed obvious bumps from Day 14 to Day 17 [see Figs. 5a and 5b], but remained up to Day 21. Note that the bumps exhibit a little bit different spacing on Days 14 and 17 in the GS solution, which might be due to the sampling error among the daily measurements. During the warming-up process on Day 27, many pockets filled with the medium were observed in the upper stroma of the cornea in GS, whereas no significant changes were observed in the stroma of the cornea in TS. This difference may be attributed to the remaining thin epithelium as a barrier for the cornea in TS. Probably the most pronounced difference in structural changes of the corneas in the two media is the cornea thickening. Figure 6a compares the optical thickness of the entire cornea preserved in GS with the one in TS in a 28 days’ storage. The cornea thickness in GS was stable from Day 0 (0.77 ± 0.02 mm) to Day 14 (0.87 ± 0.03 mm), and then gradually increased to 1.17 ± 0.06 mm by Day 24. In TS the cornea thickness initially increased from 0.70 ± 0.03 mm (Day 0) to 1.19 ± 0.02 mm by Day 14, but remained relatively stable through Day 24. The thickening observed with either medium might be caused by edema which could induce severe functional damages. During the warming-up process, the corneas in both media dramatically swelled. Figure 6b shows the average optical thickness of the entire cornea preserved in GS and TS in 14 days’ storage. Similar tendency in the changes of the structure and thickness were observed in the first 14 days compared to the 28 days’ storage. Although the cornea in GS remained with structural integrity in the 14 days’ storage, it also dramatically swelled during the warming-up process. It suggests that severe functional damages to the cornea occurred during the 14 days storage. It is interesting to note that during the warming-up process the swelling degree of the cornea in TS was always less than that in GS in both 14 and 28 days’ storage. It may indicate some interesting mechanisms in the preserving process using the two different media. Overall, the distinct cornea structure and thickness changes during the storage were clearly identified by OCT images with those changes strongly reflecting the effect of the storage media on the cornea structures. 3.2.Variation of Corneal Refractive Index and Hydration During the PreservationFigures 7a and 7b compare the group refractive index and the calibrated physical thickness of the entire cornea preserved in GS with the one in TS. The group refractive index generally has a standard deviation of 0.2%–0.6%, which reflects no much fluctuation of the optical properties in the whole cornea. When preserved in the GS, the corneas demonstrated a stable averaged group refractive index of 1.40. This value is close to the reported one (i.e., 1.3854 at 814 nm).14 On the contrary, the averaged group refractive index of the cornea in TS gradually decreased from 1.395 on Day 1 to 1.380 on Day 14. During the return to normothermic environment on Day 15, the group refractive indices of the corneas in both media decreased to 1.375. The decrease in the group refractive index is consistent with the corneal thickening due to edema. Because the maximal variation of the group refractive index during the complete storage time window was only about 2%, the variations of the physical thickness during the preservation was similar to the changes of the optical thickness [see Figs. 6b and 7b]. Thus, assuming that the constant refractive index would lead to a 2% error in the thickness measurement, it is reasonable to use a constant corneal refractive index during the study of swelling and de-swelling of the cornea with OCT.15 Fig. 7Typical variation of corneal (a) group refractive index; (b) physical thickness; and (c) hydration in a 15 days’ storage and warming-up process. In both GS and TS media, the variation of the group refractive index over time is 2%, while the variation of hydration is 25%. (d) Scatter and linear fit of the group refractive index as a function of the water fraction. The fitting equation (n c = 1.51–0.16 f water, where n c is the group refractive index and f water is the fraction of water) shows that the group refractive indices of the ground substrates (e.g., water and medium) and main substrates (e.g., cells and collagen fibers) are 1.35 and 1.51, respectively. 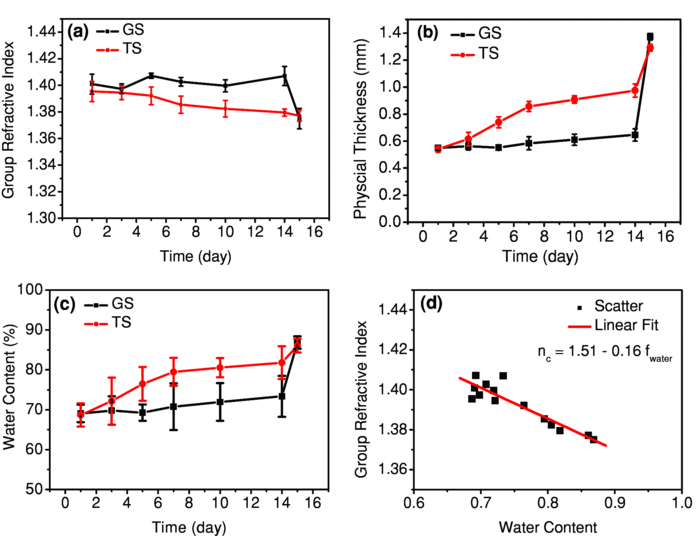 Clearly, the corneal thickening during the preservation is highly related to the corneal hydration, which is defined by the ratio of the water weight to the completely dry weight of the cornea. The corneal hydration, H, has been expressed by an empirical formula,16 Eq. 6[TeX:] \documentclass[12pt]{minimal}\begin{document}\begin{equation} H = 5.3 \,\times\, 10^{- 3} \,\times\, GT - 0.67, \end{equation}\end{document}Eq. 7[TeX:] \documentclass[12pt]{minimal}\begin{document}\begin{equation} f_{\it water} = \frac{H}{{H + 1}}. \end{equation}\end{document}Although the variation of the group refractive index during the complete storage time window was small, it definitely varied as a function of the water fraction. Figure 7d plots all the measured refractive index and the corresponding water fraction. By least square linear fitting of the curve, we found that the refractive index of the cornea can be expressed as, Eq. 8[TeX:] \documentclass[12pt]{minimal}\begin{document}\begin{equation} n_c = n_1 \,\times\, f_{\it water} + n_2 \,\times\, (1 - f_{\it water}), \end{equation}\end{document}4.ConclusionIn summary, the experimental results suggest that OCT is a powerful tool for assessing tissue structural and functional changes during storage. OCT offers sufficient resolution to distinguish the structural changes induced by different preservation media. OCT provides an efficient method to measure the physical thickness and optical properties like the group refractive index, and monitor the hydration during the storage. It can be potentially a valuable tool for cornea characterization, screening and preservation medium evaluation. The imaging speed of the time-domain OCT system is at best moderate (∼60 s for each entire cross section); yet it is adequate for this pilot study. With this time scale, there were no evident changes in cornea structures from the images. A higher speed afforded by a Fourier-domain OCT system will be a better choice in our future study in order to minimize any potential adverse effects on corneas, in particular, when imaging with a handheld probe and for achieving 3D volumetric data set. As for cornea preservation effects of the two storage media, the standard solution (GS) maintained the corneal endothelium but desquamated the corneal epithelium; by contrast, the TS remained the corneal epithelium but lost the endothelium. Overall, it is hard to conclude which medium is better in terms of preservation efficiency if only considering structural changes. In terms of functional changes (e.g., hydration), we found that GS is better than TS for short-term storage (within 7 days) as the onset of corneal edema was delayed in standard solution; but for long-term preservation, the test solution appears to hold stronger promise with further development. AcknowledgmentsThe authors gratefully acknowledge the support from the National Institutes of Health under Grant Nos. CA120480 and CA116442, and the National Science Foundation (Career Award-XDL). The research designated human corneas were kindly provided by SightLife (Seattle, WA). ReferencesW. Chu,
“The past twenty-five years in eye banking,”
Cornea, 19 754
–765
(2000). https://doi.org/10.1097/00003226-200009000-00020 Google Scholar
D. Camposampiero, R. Tiso, E. Zanetti, A. Ruzza, A. Bruni, and
D. Ponzin,
“Improvement of human corneal endothelium in culture after prolonged hypothermic storage,”
Eur. J. Ophthalm., 13 745
–751
(2003). https://doi.org/10.1097/00003226-20030400000015 Google Scholar
A. Greenbaum, S. M. Hasany, and
D. Rootman,
“Optisol vs Dexsol as storage media for preservation of human corneal epithelium,”
Eye, 18 519
–524
(2004). https://doi.org/10.1038/sj.eye.6700693 Google Scholar
M. H. J. Maathuis, H. G. D. Leuvenink, and
R. J. Ploeg,
“Perspectives in organ preservation,”
Transplantation, 83 1289
–1298
(2007). https://doi.org/10.1097/01.tp.0000265586.66475.cc Google Scholar
R. A. Laing, M. M. Sandstrom, and
H. M. Leibowitz,
“Clinical Specular Microscopy. 1. Optical-Principles,”
Arch. Ophthalmol. (Chicago), 97 1714
–1719
(1979). Google Scholar
B. A. Benetz, R. L. Gal, K. J. Ruedy, C. Rice, R. W. Beck, A. D. Kalajian, J. H. Lass, C. D. S. Grp,
“Specular microscopy ancillary study methods for donor endothelial cell density determination of cornea donor study images,”
Curr. Eye Res., 31 319
–327
(2006). https://doi.org/10.1080/02713680500536738 Google Scholar
T. Swartz, L. Marten, and
M. Wang,
“Measuring the cornea: the latest developments in corneal topography,”
Curr. Opin. Ophthalmol., 18 325
–333
(2007). https://doi.org/10.1097/ICU.0b013e3281ca7121 Google Scholar
D. Huang, E. A. Swanson, C. P. Lin, J. S. Schuman, W. G. Stinson, W. Chang, M. R. Hee, T. Flotte, K. Gregory, C. A. Puliafito, and
J. G. Fujimoto,
“Optical Coherence Tomography,”
Science, 254 1178
–1181
(1991). https://doi.org/10.1126/science.1957169 Google Scholar
A. S. Neubauer, S. G. Priglinger, M. J. Thiel, C. A. May, and
U. C. Welge-Lussen,
“Sterile structural imaging of donor cornea by optical coherence tomography,”
Cornea, 21 490
–494
(2002). https://doi.org/10.1097/00003226-200207000-00010 Google Scholar
J. S. Brown, D. Wang, X. Li, F. Baluyot, B. Iliakis, T. D. Lindquist, R. Shirakawa, T. T. Shen, and
X. D. Li,
“In situ ultrahigh-resolution optical coherence tomography characterization of eye bank corneal tissue processed for lamellar keratoplasty,”
Cornea, 27 802
–810
(2008). https://doi.org/10.1097/ICO.0b013e318169d6b7 Google Scholar
G. J. Tearney, M. E. Brezinski, J. F. Southern, B. E. Bouma, M. R. Hee, and
J. G. Fujimoto,
“Determination of the Refractive-Index of Highly Scattering Human Tissue by Optical Coherence Tomography,”
Opt. Lett., 20 2258
–2260
(1995). https://doi.org/10.1364/OL.20.002258 Google Scholar
Y. L. Kim, J. T. Walsh, T. K. Goldstick, and
M. R. Glucksberg,
“Variation of corneal refractive index with hydration,”
Phys. Med. Bio., 49 859
–868
(2004). https://doi.org/10.1088/0031-9155/49/5/015 Google Scholar
M. H. Ross, E. J. Reith, and
L. J. Romrell, Histology: A Text and Atlas, Lippincott Williams & Wilkins, Baltimore, MD(1989). Google Scholar
W. Drexler, C. K. Hitzenberger, A. Baumgartner, O. Findl, H. Sattmann, and
A. F. Fercher,
“Investigation of dispersion effects in ocular media by multiple wavelength partial coherence interferometry,”
Exp. Eye Res., 66 25
–33
(1998). https://doi.org/10.1006/exer.1997.0401 Google Scholar
Y. W. Feng, J. Varikooty, and
T. L. Simpson,
“Diurnal variation of corneal and corneal epithelial thickness measured using optical coherence tomography,”
Cornea, 20 480
–483
(2001). https://doi.org/10.1097/00003226-200107000-00008 Google Scholar
B. O. Hedbys, and
S. Mishima,
“Thickness-Hydration Relationship of Cornea,”
Exp. Eye Res., 5 221
–228
(1966). https://doi.org/10.1016/S0014-4835(66)80010-6 Google Scholar
D. W. Leonard and
K. M. Meek,
“Refractive indices of the collagen fibrils and extrafibrillar material of the corneal stroma,”
Biophys. J., 72 1382
–1387
(1997). https://doi.org/10.1016/S0006-3495(97)78784-8 Google Scholar
M. Daimon and
A. Masumura,
“Measurement of the refractive index of distilled water from the near-infrared region to the ultraviolet region,”
Appl. Opt., 46 3811
–3820
(2007). https://doi.org/10.1364/AO.46.003811 Google Scholar
X. J. Wang, T. E. Milner, M. C. Chang, and
J. S. Nelson,
“Group refractive index measurement of dry and hydrated type I collagen films using optical low-coherence reflectometry,”
J. Biomed. Opt., 1 212
–216
(1996). https://doi.org/10.1117/12.227699 Google Scholar
|


