|
|
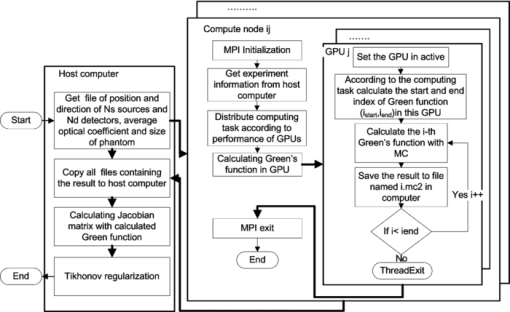
1.IntroductionAs fluorescence labeling technology develops, 1, 2 an increasing number of biologists want to observe the distribution of fluorescence targets in vivo. Therefore, fluorescence molecular tomography (FMT) 3, 4 has been developed. Because FMT can be used to quantitatively reveal the fluorescence marker's fluorescence yield 5, 6 and lifetime7 in vivo, FMT is a promising, small-animal imaging method for drug development and cancer research. 8, 9 The reconstruction algorithm is the core technology of FMT. The algorithm can be summarized as follows. 4, 10 First, the distribution of the photon density of fluorescence with a different source, which is called Green's function, is calculated. Then, by applying the Fréchet derivative, a Jacobian matrix is formed with the calculated Green's functions. Finally, the distribution of the fluorescence yield is inversely calculated from the Jacobian matrix by an optimization algorithm. The first step in the algorithm is called the forward problem, which investigates the propagation of light in tissue; the second and third steps are called the inverse problem, which reconstructs the distribution of the fluorescence yield. A traditional reconstruction algorithm has been proposed based on a diffusion approximation (DA) and using the finite-element method (FEM). 11, 12, 13, 14 The traditional method is very fast, but it is valid only when the reduced scattering coefficients of the tissue are far greater than the absorption coefficients. Although the FMT reconstruction method based on the high order of the radiative transport equation (RTE) is suitable for heterogeneous media with complex distributions of optical coefficients, low computational efficiency limits its application. For example, Joshi proposed a radiative transport-based frequency-domain fluorescence tomography with the most accurate angular discretization of RTE, but it requires more than 3.5 h on a 16-node Beowulf cluster.15 Monte Carlo (MC) methods were introduced in FMT. They are used to calculate the Green's functions with which the Jacobian matrix is formed to reconstruct the distribution of the fluorescence yield. Because MC methods are the gold standard for simulating the light propagation in tissue and are valid for all kinds of tissue, 16, 17, 18 they are suitable for small-animal imaging, which has a complex distribution of optical coefficients. Kumar proposed a reconstruction method based on a MC method that reconstructs the distribution of the fluorescence lifetime in time-domain fluorescence tomography for small-animal imaging. A phantom experiment showed that this method can clearly separate two fluorochromes with 6-mm spacing.19 Zhang also introduced MC methods into the reconstruction of fluorescence tomography for small-animal imaging.20 However, because of the low computational efficiency and the large number of Green's functions requiring calculation, more than 6 h are required to reconstruct the result, even with a parallel computing cluster of central processing units (CPUs). Graphics processing units (GPUs) have been introduced in MC simulations to accelerate the simulation of the propagation of light in tissue when the distribution of the optical coefficient is already determined. The GPU is the core of a graphics card. In the past, all software ran on CPU; GPUs were only used in image processing and output until general-purpose computing on graphics processing units were proposed and unleashed the power of GPUs for parallel computation. The peak floating-point operations per/s (flop/s) of marketavailable graphics hardware can reach 1000 Gflop/s, which is 10 times higher than that of a Harpertown CPU with a 3.2-GHz frequency.21 By using the power of the GPU for parallel computation, MC methods, which simulate the propagation of light in tissue, can be accelerated to speeds that are 100 to 1000 times faster than those obtained with the CPU only. For example, Alerstam used a single GPU to accelerate an MC simulation by a factor of 1000 for multilayered tissues;22 Lo proposed a multi-GPU-accelerated MC simulation for photodynamic therapy treatment;23 Fang and Boas sped up an MC simulation with a single GPU by a factor of 100 to 300 for complex 3-D turbid media;24 and Fang also released their code named Monte Carlo eXtreme (MCX).25 Until now, the FMT reconstruction method based on DA with FEM is still limited in high-scattering tissue; however, many kinds of tissues in small animals do not satisfy the condition of high-scattering, such as rabbit muscle, colon adenocarcinomas,26 the cerebral spinal fluid layer in the brain, and cysts in the human breast.24 FMT reconstruction methods based on the high orders of both RTE and MC are suitable for heterogeneity media with a complex distribution of optical coefficients, but poor computational efficiency has tremendously limited their applications. GPU can tremendously accelerate the speed of MC; however, it has not yet been used in FMT reconstruction. Furthermore, single GPU-accelerated FMT reconstruction cannot satisfy the demand for fast reconstruction because of the large number of source-detector pairs. In this paper, we propose a fast MC-based FMT reconstruction, which is suitable for 3-D heterogeneity media with refractive-index-unmatched boundaries and a complex distribution of optical coefficients. Phantom experiments with either high or low-scattering are used to demonstrate the accuracy and speed of the method. By analyzing the reconstructed localization and concentration of the fluorochromes, we compare the accuracy of our method with a traditional method based on DA with FEM. By the load-balancing strategy, we optimize the performance of the GPU cluster for faster reconstruction and compare with that based on CPU and single GPU. 2.Method2.1.Theory of FMTIn this section, a brief introduction to the theory of FMT reconstruction based on MC simulations accelerated by a GPU cluster will be given. The distribution of fluorescence photons in tissue can be expressed as follows: 3, 7 Eq. 1[TeX:] \documentclass[12pt]{minimal}\begin{document}\begin{equation} \phi _f (R_d,R_s) = \int {g^{\lambda em} (R_d,r)} x(r)\phi ^{\lambda ex} (r,R_s)dr, \end{equation}\end{document}Eq. 2[TeX:] \documentclass[12pt]{minimal}\begin{document}\begin{equation} x(r) = \eta \mu _{\alpha f} (r)\frac{{1 - j\omega \tau (r)}}{{1 + (\omega \tau (r))^2 }}, \end{equation}\end{document}When the light source is a narrow collimation laser, the light source can be expressed as a δ function, so ϕλex(r, R s) = g λex(r, R s) (Refs. 7 and 27), and, according to reciprocity,28 g λem(R d, r) = g λem(r, R d). Equation 1 can be expressed as follows: Eq. 3[TeX:] \documentclass[12pt]{minimal}\begin{document}\begin{equation} \phi _f (R_d, R_s) = \int {g^{\lambda em} (r,R_d)} x(r)g^{\lambda ex} (r,R_s)dr. \end{equation}\end{document}Eq. 4[TeX:] \documentclass[12pt]{minimal}\begin{document}\begin{equation} \hspace*{-8pt}J(R_d,R_s) = \frac{{\partial [\phi _f (R_s,R_d)]}}{{\partial x}} =\! \int {g^{\lambda em} (r,R_d)g^{\lambda ex} (r,R_s)} dr, \end{equation}\end{document}The number of reconstructed fluorescence yields of FMT was determined by the number of discrete points (Np). To reduce the ill-posed number of coefficients for FMT, the measurement points referring to the number of sources (Ns) multiplied by the number of detectors (Nd) must be greater than the number of reconstructed fluorescence yield, which is equal to Np. Therefore, the number of source-detector pairs is very large. When there are Ns sources, Nd detectors, and Np discrete points in the experiment, the Jacobian matrix can be expressed as follows: Eq. 5[TeX:] \documentclass[12pt]{minimal}\begin{document}\begin{equation} J = \left[ {\begin{array}{*{20}c} {J\big(R_d^1,R_s^1\big)} \\ {......} \\ {J\big(R_d^i,R_s^j\big)}\vspace*{3pt} \\ {J\big(R_d^{Nd},R_s^{Ns}\big)} \\ \end{array}} \right]. \end{equation}\end{document}In this paper, the Green's function in Eq. 4 was calculated by the kernel of MCX. According to Eq. 5, there are Ns + Nd Green's functions to be calculated to construct a (Ns × Nd) × Np Jacobian matrix. Combining the Jacobian matrix in Eq. 5, and according to Tikhonov regularization, 29, 30 the distribution of the fluorescence yield can be reconstructed. Tikhonov regularization can be expressed as Eq. 6[TeX:] \documentclass[12pt]{minimal}\begin{document}\begin{equation} \min (||Jx - y||^2 + \lambda ||\Gamma x||), \end{equation}\end{document}2.2.Acceleration by a GPU ClusterTo further improve the speed of the reconstruction method based on MC simulations, with the goal of satisfying the demand for fast reconstruction in FMT, a GPU cluster was constructed with MPICH2, which is a high-performance and widely portable implementation of the MPI standard (both MPI 1.0 and MPI 2.0). The entire calculation task of the Green's functions needed by the inverse problem was distributed to the GPU cluster. The hardware configuration is listed in Table 1. Three personal computers in a local area network equipped with a total of six GPUs of the G200 framework (which supports both double and single precision) were used to construct a GPU cluster. A flowchart of the GPU cluster-accelerated FMT reconstruction method based on MC simulations is shown in Fig. 1. Table 1The hardware of the GPU cluster.
The processes in Fig. 1 can be briefly summarized as follows:
3.Phantom ExperimentsIn this section, two phantom experiments for both low- and high-scattering media are used to demonstrate the accuracy and speed of MC-based FMT reconstruction accelerated by a GPU cluster. 3.1.Reconstruction AccuracyFour glass tubes (2.2-mm in diameter) with different concentrations of Dir-Boa fluorescence dye33 were placed in a rectangular box (13.5×40.5×60 mm) with a mixed solution of Intralipid and India ink. The concentration in the four glass tubes ranged from 1.8 μmol/L to 1.2 μmol/L. Two phantom experiments with different kinds of optical coefficients for the mixed solution of Intralipid and India ink were conducted. The glass tubes in the phantom experiment are heterogeneous media because the optical coefficients of the solution of Dir-Boa fluorescence dye (high-absorption, low-scattering) are different from those for the mixed solution of Intralipid and India ink, and the refractive index of glass is also mismatched with the mixed solution. The heterogeneity of the fluorescence solution is considered in the calculation of the Green's function for MC-based FMT reconstruction but not in that based on DA with FEM because it is not accurate for DA when μa > μs′. Case 1. The absorption coefficient of the first experiment was 0.23 mm−1, and the reduced scattering coefficient was 0.68 mm−1. In this case, μα ≈ μs′, which indicates a low-scattering case. In theory, the DA will be invalid. However, the MC simulation was accurate. Case 2. The absorption coefficient of the second experiment was 0.07 mm−1, and the reduced scattering coefficient was 1.8 mm−1. In this case, μα ≪ μs ′, which indicates the high-scattering case. In theory, the DA should be as accurate as the MC simulation. These two types of optical coefficients refer to the muscle tissue and the skin of a rabbit at a wavelength of 790 nm.26 A dual-modality imaging system combined with micro-computer tomography (micro-CT) and FMT 34 was then used to obtain the fluorescence images. A micro-CT slice was used to prove the localization accuracy of the reconstruction. The reconstruction area (1.35×40.5×20 mm) was smaller than the real size of the phantom because the fluorescence signal only appeared in that area. The spatial resolution of the FMT is about 1 mm;35 therefore, by applying a 1-mm3 discrete accuracy, the reconstruction area was separated into 14×41×20 voxels. In this experiment, there were 99 sources and 220 detectors, so 319 Green functions were calculated. Therefore, the amount of data from the experiment (99×220 = 21,780) was larger than the number of reconstructed fluorescence yield, which was equal to the number of voxels (14×41×20 = 11,480). As a result, the ill-posed FMT reconstruction could be relieved. Six GPUs were used to calculate the Green's functions, and 105 photon moves were simulated at each thread of the GPU. There were 2560 threads in total and 256 threads in each block of the GPU. We repeated this calculation 12 times to increase the total number of simulation photons and to avoid the kernel launch time-out error.25 In each calculation of a Green's function, there were 1.36 × 10⁷ photons to be simulated on average, and 4.34109 photons were simulated for the total reconstruction process. The reconstruction method based on a DA with the FEM refers to NIRFAST 36, 37and TOAST. 27, 38 By applying a 1-mm3 mesh, the reconstruction area was discrete, with 12,054 points and 50,100 tetrahedrons. Tikhonov regularization was solved with a conjugate gradient method that was stopped at the 18th iteration, when the difference between two consecutive iterations was less than 10−6. The reconstructed distribution of the fluorescence yield is shown in Fig. 2. Fig. 2Reconstruction slices. (a), (b), and (c) show the reconstruction slices for case 1. (d), (e), and (f) show the reconstruction slices for case 2. Micro-CT refers to the central reconstruction slice with Micro-CT. MC refers to the central reconstruction slice for the FMT reconstruction method based on MC simulations accelerated by a GPU cluster. FEM refers to the central reconstruction slice for the FMT reconstruction method based on a DA with the FEM. The position and size of the white circles in (b) and (c) were determined by the Micro-CT slice in (a), and the white circles in panels (e) and (f) were determined by the Micro-CT slice in panel (d). 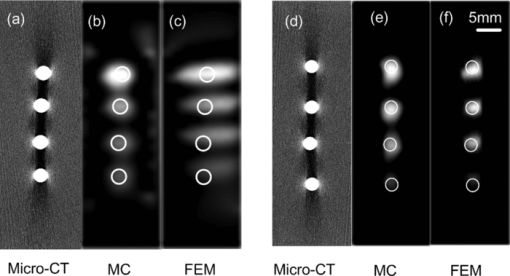 The average value of the reconstructed fluorescence coefficient of the four fluorochromes for both case 1 and case 2 was calculated from Figs. 2b, 2c, 2e, 2f. These values were calculated with different FMT reconstruction methods based on both MC simulations and DA. Because the fluorescence yield was in direct proportion to the concentration of the fluorochromes, the reconstructed concentrations of four fluorochromes were calculated through a linear fit of the fluorescence yield against the real concentration of the fluorochromes. The results are shown in Fig. 3. Fig. 3Reconstruction of the concentration of fluorochromes. (a) shows the reconstructed concentration versus the real concentration of four different fluorochromes for case 1. The concentrations were reconstructed by the FMT reconstruction method based on both MC simulations and DA. (b) represents the case 2 experimental conditions. The linear fit function is also shown in (a) and (b). 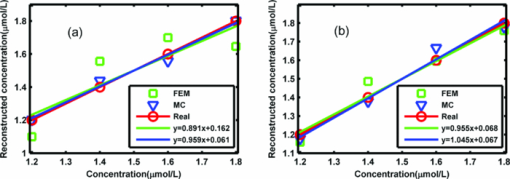 The error between the linear fit and the real reconstructed concentration was used to determine the coefficient of the linear fit, which refers to the linearity of the reconstructed concentration. The resulting values are listed in Table 2. The sum of squares error (SSE) refers to the error between the linear fit and the reconstructed concentration, and R-squared indicates the linearity of the fit. Under ideal conditions, the SSE is zero and R-squared is 1. Table 2The coefficients of the linear fit.
3.2.Acceleration PerformanceIn this section, the effect of the load-balancing method based on the calculation power of GPU is compared with equal-load-balancing. The acceleration performance for different numbers of GPUs in the GPU cluster is compared for both case 1 and case 2. We distribute all the tasks into GPU clusters with two different balancing methods: load-balancing with Eq. 7 and equal loading, which equally distributes the task into GPUs. We use the experimental data for case 1 and case 2. The configuration of the MC and GPU is mentioned in Sec. 3.2, and the reconstruction time is recorded for comparison. The results are shown in Table 3. Table 3Performance of load-balancing.
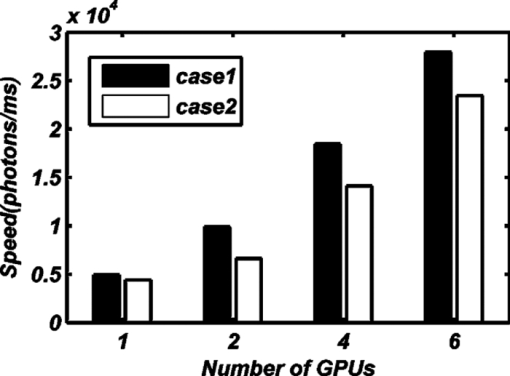
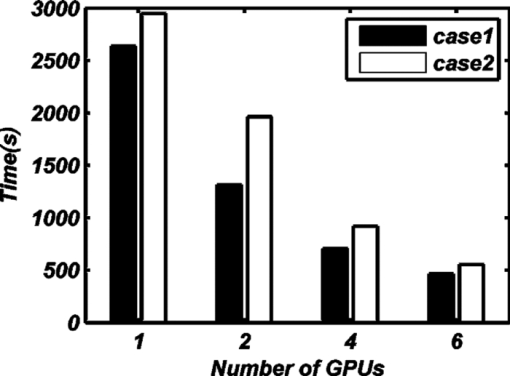
From Table 3, we find that load-balancing based on Eq. 7 increases the computational efficiency. We separately tested the performance of the FMT reconstruction method based on MC simulations with a GPU cluster containing one, two, four, or six GPUs. In every thread of the GPU, 105 photon moves were simulated. There were 7680 threads in total in computer 1 and computer 2, but there were 6144 threads in total in computer 3. Every block in the GPU contained 256 threads. Each GPU in a GTX295 graphics card contains 30 independent multiprocessors (MPs), which contain 16384 registers, and MCX occupies 54 registers at each thread. Therefore, 256 threads could be run simultaneously in each MP. For the entire GPU, 30×256 = 7680 threads could be run simultaneously. However, the GPU on the NVIDIA Quadro FX4800 graphics card of computer 3 only contained 24 MPs, so 24×256 = 6144 threads in total could be run simultaneously. With these settings, the computing power of a graphics card with a G200 framework can be fully unleashed. Each calculation of a Green's function was repeated 12 times to avoid kernel launch time-out errors25 and to increase the total number of simulated photons. For each calculation of a Green's function, there were 4×10⁷ simulated photons on average and 1.3×10¹⁰ in total for the entire reconstruction. Because the total number of photons in the reconstruction process was only determined by the total number of calculated Green's functions, the photon moves in each thread, the total number of threads, and the different numbers of GPUs in the GPU cluster did not influence the total number of simulation photons. However, there were small differences in the total number of photons when the GPU of the Quadro FX4800 in computer 3 was used because the total number of available threads for the Quadro FX4800 was only 6144. The influence of the number of GPUs in the GPU cluster on the amount of time consumed for the FMT reconstruction method based on MC simulations is shown in Fig. 4. The time data for one and two GPUs in the GPU cluster came from the computing node of computer 1. Four GPUs refers to the computing nodes of computers 1 and 2, and six GPUs in the GPU cluster refers to computing nodes of computers 1, 2, and 3. We also compared the acceleration ratio between the speeds of the CPU code and the GPU cluster code. The speed of the CPU code was estimated by the tMCimg code,39which was compiled with –O2(maxspeed) in Visual Studio 2008. Because it takes a long time to use the tMCimg in FMT reconstruction, we only tested the speed of tMCimg for one calculation of a Green's function. This speed was approximately equal to the speed for the whole reconstruction because the Green's function calculation consume 95% of the time needed for the total reconstruction. The results showed that for case 1, the calculation speed of a Green's function based on CPU code was 75 photons/ms, and for case 2, the speed was 7.6 photons/ms. The performance using different numbers of GPUs in the GPU cluster is shown in Fig. 5, and the acceleration ratio compared with the CPU is shown in Table 4. Table 4The acceleration ratio for different numbers of GPUs.
4.Discussion and ConclusionFor the low-scattering case (μa ≈ μs′), Figs. 2a, 2b, 2c, and Fig. 3a illustrate that the GPU-cluster-accelerated FMT reconstruction method based on MC simulations accurately reconstructed the localization and concentration of fluorochromes. The traditional reconstruction method based on a DA with the FEM failed in this case. This superiority of our method in reconstructing the concentration is quantitatively demonstrated in Table 2. In the experiment for the high-scattering case (μα ≪ μs ′), which has typically been reconstructed with the traditional reconstruction method based on a DA with the FEM, the GPU cluster–accelerated FMT reconstruction method based on MC simulations also accurately reconstructed the localization and concentration of fluorochromes. Figures 2d, 2e, 2f, Fig. 3b, and Table 2 show that, in the high-scattering case, the two methods achieve almost identical results. The only disparity is a very small difference in the linearity of the reconstructed concentration because the heterogeneity of the fluorescence solution is considered in the MC-based FMT reconstruction method accelerated by GPU clusters and the size of the fluorescence solution is small, which cannot cause a large error in the calculation of the Green's function. This small difference indicates the advantage of our method for heterogeneous media with refractive-index-unmatched boundaries. The GPU cluster-accelerated FMT reconstruction method based on MC simulations can accurately reconstruct the localization and concentration of fluorochromes for heterogeneous media under both low- and high-scattering conditions. In contrast, the traditional FMT reconstruction method based on a DA with the FEM was only valid for the case in which μα ≪ μs ′. Figure 4 shows that the FMT reconstruction method based on MC simulations accelerated by a single GPU for case 1 and case 2 requires 44 and 49 min to finish the whole process, which does not satisfy the demand for fast reconstruction in FMT. However, the FMT reconstruction method based on MC simulations accelerated with six GPUs for case 1 and case 2 requires only 7.7 and 9.2 min, which is the same as the time required by the FMT reconstruction method based on a DA with the FEM.12 We also found that the more GPUs in the GPU cluster, the less time was required for the FMT reconstruction based on MC simulations, which predicts that a GPU cluster with about 15 Nvidia GTX 480 graphic cards (about 3 times faster than Nvidia GTX 295) may require only 1 min to finish the entire FMT-reconstruction process. Note, however, that the larger reduced scattering coefficient required more processing time in the FMT reconstruction based on MC simulations because a larger reduced scattering coefficient means that the photons need more steps to escape from the tissue, which requires more time to calculate. The more GPUs in the GPU cluster, the faster the speed of the FMT reconstruction method based on MC simulations. Compared with the CPU code, the FMT reconstruction method based on MC simulations accelerated with 6 GPUs was 3088 times faster for case 2, but only 373 times faster for case 1. This difference is caused by the speed of the FMT reconstruction method based on MC simulations decreasing more quickly for the CPU code than for the GPU cluster when the reduced scattering coefficient increased. In summary, with the MPI standard and load-balancing method, we propose a fast FMT reconstruction method which is based on MC simulation and accelerated by a GPU cluster. Through two phantom experiments on both high- and low-scattering media, we prove that this method can accurately and rapidly reconstruct the fluorochrome localization and concentration for 3-D heterogeneous media with refractive-index-unmatched boundaries and complex distributions of optical coefficients. AcknowledgmentsWe gratefully acknowledge the financial support of the National Major Scientific Research Program of China (Grant No. 2011CB910400) and the National Natural Science Foundation of China (Grant No. 60828009). ReferencesR. Y. Tsien,
“Building and breeding molecules to spy on cells and tumors,”
Febs. Letters., 579
(4), 927
–932
(2005). https://doi.org/10.1016/j.febslet.2004.11.025 Google Scholar
M. Funovics, R. Weissleder, and
C. H. Tung,
“Protease sensors for bioimaging,”
Anal. Bioanal. Chem., 377
(6), 956
–963
(2003). https://doi.org/10.1007/s00216-003-2199-0 Google Scholar
V. Ntziachristos,
“Fluorescence Molecular Imaging,”
Annu. Rev. Biomed. Eng., 8
(1), 1
–33
(2006). https://doi.org/10.1146/annurev.bioeng.8.061505.095831 Google Scholar
A. B. Milstein, S. Oh, K. J. Webb, C. A. Bouman, Q. Zhang, D. A. Boas, and
R. P. Millane,
“Fluorescence optical diffuse tomography,”
Appl. Opt., 42
(16), 3081
–3094
(2003). https://doi.org/10.1364/AO.42.003081 Google Scholar
D. Y. Churmakov, I. V. Meglinski, and
D. A. Greenhalgh,
“Amending of fluorescence sensor signal localization in human skin by matching of the refractive index,”
J. Biomed. Opt., 9
(2), 339
–46
(2004). https://doi.org/10.1117/1.1645796 Google Scholar
D. Y. Churmakov, I. V. Meglinski, S. A. Piletsky, and
D. A. Greenhalgh,
“Analysis of skin tissues spatial fluorescence distribution by the Monte Carlo simulation,”
J. Phys. D, 36
(14), 1722
–1728
(2003). https://doi.org/10.1088/0022-3727/36/14/311 Google Scholar
A. T. Kumar, S. B. Raymond, G. Boverman, D. A. Boas, and
B. J. Bacskai,
“Time resolved fluorescence tomography of turbid media based on lifetime contrast,”
Opt. Express., 14
(25), 12255
–12270
(2006). https://doi.org/10.1364/OE.14.012255 Google Scholar
X. Montet, J. L. Figueiredo, H. Alencar, V. Ntziachristos, U. Mahmood, and
R. Weissleder,
“Tomographic fluorescence imaging of tumor vascular volume in mice,”
Radiology, 242
(3), 751
–758
(2007). https://doi.org/10.1148/radiol.2423052065 Google Scholar
G. Zacharakis, H. Kambara, H. Shih, J. Ripoll, J. Grimm, Y. Saeki, R. Weissleder, and
V. Ntziachristos,
“Volumetric tomography of fluorescent proteins through small animals in vivo,”
Proc. Natl. Acad. Sci. U.S.A., 102
(51), 18252
–18257
(2005). https://doi.org/10.1073/pnas.0504628102 Google Scholar
S. R. Arridge and
J. C. Schotland,
“Optical tomography: forward and inverse problems,”
Inverse Probl., 25
(12), 1
–59
(2009). https://doi.org/10.1088/0266-5611/25/12/123010 Google Scholar
X. A. Cong and
G. Wang,
“A finite-element-based reconstrution method for 3-D fluorescence tomography,”
Opt. Express, 13
(24), 9847
–9857
(2005). https://doi.org/10.1364/OPEX.13.009847 Google Scholar
B. Ralf Schulz, A. Ale, A. Sarantopoulos, M. Freyer, E. Soehngen, M. Zientkowska, and
V. Ntziachristos,
“Hybrid System for Simultaneous Fluorescence and X-ray Computed Tomography,”
IEEE Trans. Med. Imaging, 29
(2), 465
–473
(2009). https://doi.org/10.1109/TMI.2009.2035310 Google Scholar
D. Kepshire, N. Mincu, M. Hutchins, J. Gruber, H. Dehghani, J. Hypnarowski, F. Leblond, M. Khayat, and
B. W. Pogue,
“A microcomputed tomography guided fluorescence tomography system for small animal molecular imaging,”
Rev. Sci. Instrum., 80
(4), 043701
(2009). https://doi.org/10.1063/1.3109903 Google Scholar
Y. Tan and
H. Jiang,
“Diffuse optical tomography guided quantitative fluorescence molecular tomography,”
Appl. Opt., 47
(12), 2011
–2016
(2008). https://doi.org/10.1364/AO.47.002011 Google Scholar
A. Joshi, J. C. Rasmussen, E. M. Sevick-Muraca, T. A. Wareing, and
J. McGhee,
“Radiative transport-based frequency-domain fluorescence tomography,”
Phys. Med. Biol., 53
(8), 2069
–2088
(2008). https://doi.org/10.1088/0031-9155/53/8/005 Google Scholar
B. C. Wilson and
G. Adam,
“A Monte Carlo model for the absorption and flux distributions of light in tissue,”
Med. Phys., 10
(6), 824
–830
(1983). https://doi.org/10.1118/1.595361 Google Scholar
T. Li,
“MCVM: Monte Carlo Modeling of Photon Migration In Voxelized Media,”
J. Innov. Opt. Health Sci., 3
(2), 91
–102
(2010). https://doi.org/10.1142/S1793545810000927 Google Scholar
L. Wang, S. L. Jacques, and
L. Zheng,
“MCML―Monte Carlo modeling of light transport in multi-layered tissues,”
Comput. Methods Programs Biomed., 47
(2), 131
–46
(1995). https://doi.org/10.1016/0169-2607(95)01640-F Google Scholar
A. T. N. Kumar, S. B. Raymond, A. K. Dunn, B. J. Bacskai, and
D. A. Boas,
“A time domain fluorescence tomography system for small animal Imaging,”
IEEE Trans. Med. Imaging, 27
(8), 1152
–1163
(2008). https://doi.org/10.1109/TMI.2008.918341 Google Scholar
X. Zhang, C. Badea, M. Jacob, and
G. A. Johnson,
“Development of a noncontact 3-D fluorescence tomography system for small animal in vivo imaging,”
Proc. SPIE, 7191 71910D
(2009). https://doi.org/10.1117/12.808199 Google Scholar
NVIDIA CUDA™ Programming Guide., 2009). http://developer.download.nvidia.com/compute/cuda/2_3/toolkit/docs/NVIDIA_CUDA_Programming_Guide_2.3.pdf Google Scholar
E. Alerstam, T. Svensson, and
S. Andersson-Engels,
“Parallel computing with graphics processing units for high-speed Monte Carlo simulation of photon migration,”
J. Biomed. Opt., 13
(6), 060504
(2008). https://doi.org/10.1117/1.3041496 Google Scholar
W. C. Y. Lo, T. D. Han, J. Rose, and
L. Lilge,
“GPU-accelerated Monte Carlo simulation for photodynamic therapy treatment planning,”
Proc. SPIE, 7373 737313
(2009). https://doi.org/10.1117/12.831944 Google Scholar
Q. Q. Fang and
D. A. Boas,
“Monte Carlo Simulation of Photon Migration in 3-D Turbid Media Accelerated by Graphics Processing Units,”
Opt. Express., 17
(22), 20178
–20190
(2009). https://doi.org/10.1364/OE.17.020178 Google Scholar
Q. Fang, Monte Carlo eXtreme (MCX), 2009). http://mcx.sourceforge.net/cgi-bin/index.cgi?Home Google Scholar
J. F. Beek, P. Blokland, P. Posthumus, M. Aalders, J. W. Pickering, H. J. C. M. Sterenborg, and
M. J. C. vanGemert,
“In vitro double-integrating-sphere optical properties of tissues between 630 and 1064 nm,”
Phys. Med. Biol., 42
(11), 2255
–2261
(1997). https://doi.org/10.1088/0031-9155/42/11/017 Google Scholar
S. R. Arridge,
“Optical tomography in medical imaging,”
Inverse Probl., 15
(2), R41
–R93
(1999). https://doi.org/10.1088/0266-5611/15/2/022 Google Scholar
S. R. Arridge and
M. Schweiger,
“Photon-measurement density functions. Part 2: Finite-element-method calculations,”
Appl. Opt., 34
(34), 8026
–8037
(1995). https://doi.org/10.1364/AO.34.008026 Google Scholar
B. W. Pogue, T. O. McBride, J. Prewitt, U. L. Osterberg, and
K. D. Paulsen,
“Spatially variant regularization improves diffuse optical tomography,”
Appl. Opt., 38
(13), 2950
–2961
(1999). https://doi.org/10.1364/AO.38.002950 Google Scholar
A. N. Tikhonov, A. S. Leonov, and
A. G. Yagola, Nonlinear Ill-Posed Problems (Applied Mathematics & Mathematical Computation), Springer, Berlin
(1997). Google Scholar
D. Calvetti, S. Morigi, L. Reichel, and
F. Sgallari,
“Tikhonov regularization and the L-curve for large discrete ill-posed problems,”
J. Comput. Appl. Math., 123
(1–2), 423
–446
(2000). https://doi.org/10.1016/S0377-0427(00)00414-3 Google Scholar
T. Rubaek, P. M. Meaney, P. Meincke, and
K. D. Paulsen,
“Nonlinear microwave imaging for breast-cancer screening using Gauss-Newton's method and the CGLS inversion algorithm,”
IEEE Trans. Antenn. Propag., 55
(8), 2320
–2331
(2007). https://doi.org/10.1109/TAP.2007.901993 Google Scholar
Z. Zhang, W. Cao, H. Jin, J. F. Lovell, M. Yang, L. Ding, J. Chen, I. Corbin, Q. Luo, and
G. Zheng,
“Biomimetic Nanocarrier for Direct Cytosolic Drug Delivery,”
Angew. Chem. Int. Ed., 48
(48), 9171
–9175
(2009). https://doi.org/10.1002/anie.200903112 Google Scholar
X. Yang, H. Gong, G. Quan, Y. Deng, and
Q. Luo,
“Combined system of fluorescence diffuse optical tomography and micro-CT for small animal imaging,”
Rev. Sci. Instrum., 81
(5), 054304
(2010). https://doi.org/10.1063/1.3422252 Google Scholar
E. E. Graves, J. Ripoll, R. Weissleder, and
V. Ntziachristos,
“A submillimeter resolution fluorescence molecular imaging system for small animal imaging,”
Med. Phys., 30
(5), 901
–11
(2003). https://doi.org/10.1118/1.1568977 Google Scholar
H. Dehghani and
D. T. Delpy,
“Near-infrared spectroscopy of the adult head: effect of scattering and absorbing obstructions in the cerebrospinal fluid layer on light distribution in the tissue,”
Appl. Opt., 39
(25), 4721
–9
(2000). https://doi.org/10.1364/AO.39.004721 Google Scholar
M. Schweiger and
S. Arridge, TOAST., 2008). http://web4.cs.ucl.ac.uk/research/vis/toast/license.html Google Scholar
D. A. Boas, J. P. Culver, J. J. Stott, and
A. K. Dunn,
“Three dimensional Monte Carlo code for photon migration through complex heterogeneous media including the adult human head,”
Opt. Express., 10
(3), 159
–170
(2002). Google Scholar
Comparison of Nvidia graphics processing units., http://en.wikipedia.org/wiki/Comparison_of_Nvidia_graphics_ Google Scholar
|
|||||||||||||||||||||||||||||||||||||||||||||||||||||||||||||||||||||||||||

