|
|
1.IntroductionSince its introduction nearly 40 years ago, laser photocoagulation has been the standard of care for several retinopathies.1, 2 Conventionally, this treatment has involved the application of 100–500 ms pulses, often resulting in collateral thermal damage to the inner retina3 due to heat diffusion from the primary light absorbing layer, the retinal pigmented epithelium (RPE). In patterned scanning laser photocoagulation, patterns of 4–50 exposures are delivered sequentially in a single step, with pulse durations in the range of 20 ms.4 These shorter exposures have been shown to be less painful than traditional retinal photocoagulation, while restricting damage to the RPE, outer retina and inner choroid.5, 6 Small clinical trials have also demonstrated a similar efficacy to traditional retinal photocoagulation.7, 8, 9 However, coagulation at shorter pulse durations requires higher peak temperatures, increasing the potential for thermomechanical injury due to vapor bubble formation.10 Early argon laser (488 and 514 nm) studies demonstrated that the threshold energies for coagulation and hemorrhage decreased with pulse duration,10, 11 with the difference between these thresholds disappearing around 10 ms. In a more recent study of 532-nm laser exposures in rabbit, the safe therapeutic window (TW), defined as the ratio of threshold power resulting in thermomechanical rupture of Bruch's membrane (“rupture”) to that of mild coagulation, was measured to approach unity at 1 ms.12 Pulse durations of <20 ms are desirable in clinical practice because their application may further decrease treatment time and patient discomfort, and allow for application of larger patterns. Therefore, it would be beneficial to increase the TW for these pulse durations. In this study, we examine two potential approaches to this end: spatial and temporal modulation of the laser energy distribution to improve temperature uniformity across the beam and during the pulse. Thermal cellular damage in the millisecond regime is often described using the Arrhenius model.13, 14 It assumes a rate of decline in the concentration of a critical molecular component for cellular metabolism D(t) with temperature T(t), Eq. 1[TeX:] \documentclass[12pt]{minimal}\begin{document}\begin{equation} dD(t) = - D(t)A\,\exp \left[ { - \frac{{E*}}{{{\rm R}T(t)}}} \right]dt, \end{equation}\end{document}where E* and A are the activation energy and rate constant parametrizing the process, and R is the gas constant (8.31J K−1mol−1). Tissue damage is encapsulated in the Arrhenius integral Ω, a function of the decrease in critical molecular component D(τ), relative to its initial value D 0 over the pulse length τ: Eq. 2[TeX:] \documentclass[12pt]{minimal}\begin{document}\begin{equation} \Omega (\tau) = - \ln \left[ {\frac{{D(\tau)}}{{D_0 }}} \right] = A\int_0^\tau {\exp \left[ { - \frac{{E*}}{{{\rm R}T(t)}}} \right]} dt. \end{equation}\end{document}With conventional flat-top or Gaussian radial beam profiles, heat diffusion during the pulse results in an elevated temperature at the beam center. Such overheating results in a higher maximum temperature than necessary to produce the desired retinal coagulation and increases the probability of rupture. A beam shape with a lower central irradiance compensates for the effects of thermal diffusion, resulting in a more uniform temperature profile and thermal damage zone. Conventionally used constant-power pulses result in increasing temperature during the pulse, asymptotically approaching a steady-state value. The increasing temperature produced by a square pulse leads to an exponential increase in the Arrhenius reaction rate [integrand of Eq. 2] at the end of the pulse, while most of the pulse duration does not effectively contribute to the tissue coagulation [depicted in Fig. 1a]. The entire pulse length can be more efficiently utilized by varying the laser power to compensate for heat diffusion. Such a pulse consists of an initial constant-power phase to bring the temperature up to a desired level and a slow decrease to maintain this temperature. With such a pulse shape, a larger fraction of the pulse duration effectively contributes to the Arrhenius integral, which allows for coagulation with shorter pulses at a given peak temperature [Fig. 1b]. Fig. 1Schematic representation of pulse shape, corresponding temperature, and Arrhenius rate [the integrand of Eq. 2] in photocoagulation. Power and Arrhenius rate are given in arbitrary units (a.u.). (a) Conventional constant-power pulse of 20 ms results in slow temperature rise, where 95% of the Arrhenius integral occurs over the final 7 ms. (b) Pulse shaped to maintain constant temperature uses pulse duration more effectively. With this pulse shape, half the original duration can give the same Arrhenius integral with the same peak temperature. 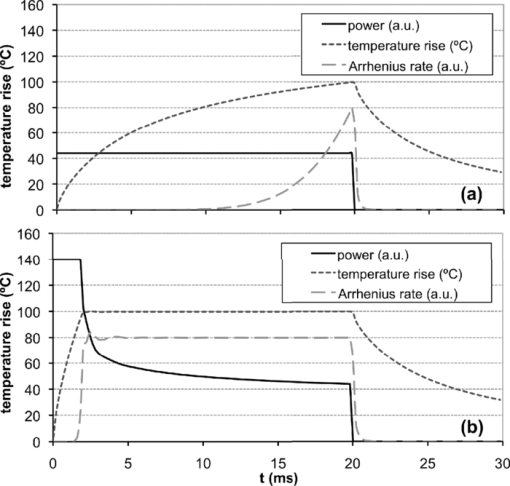 Some studies of retinal thermotherapy with an annular beam or modulated pulse have been performed previously, though none with the specific goal of improving the therapeutic window. An early computational and theoretical study looked at coagulation and vaporization thresholds with a copper vapor laser (511 and 578 nm, 150-ms bursts of 20-ns pulses) using an annular beam.15 The system was shown to be suitable for coagulation at a sufficiently high repetition rate (>500 Hz), but the influence of the beam shape was not studied. Minimum visible lesion (MVL) thresholds (3-μs pulses at 590 nm) for retinal spot sizes of >160 μm have been shown to scale proportional to the beam area with both annular and flat-top beams.16 Recently, computational modeling of MVL threshold was used to estimate the exposure limits for annular retinal beam profiles.17 However, this study did not consider retinal rupture thresholds or the therapeutic window of photocoagulation. The effect of continuous pulse modulation on pain perception during retinal photocoagulation was assessed in a small clinical study,18 where 300-ms pulses of diode laser (810 nm) with decreasing power were used. These modulated pulses were found to be significantly less painful than constant power pulses of the same total energy, but changes in coagulation and rupture thresholds due to pulse modulation were not investigated. A selection of beam and pulse parameters that provide uniform spatial or temporal temperature distributions in the retina can be assisted by computational modeling of retinal heating. Models can be refined to account for differences in heat deposition in various retinal layers and pigmentation variability across the fundus.19 We report the results of computational modeling in conjunction with in vivo experiments to evaluate the therapeutic window of retinal photocoagulation with both an annular beam and modulated pulse in the duration range of 2–50 ms. 2.Methods2.1.Computational Model of Retinal Heating with Annular BeamA previously described20 finite element model of retinal heating constructed in the COMSOL Multiphysics computational package (v 3.5, COMSOL Inc., Burlington, Massachusetts) was used to estimate temperature rise at the RPE for annular and flat-top beam shapes. This model approximated the retina as a series of homogeneous absorbing layers and calculated temperature by solution of the axisymmetric heat conduction equation.21 Absorption and scattering coefficients were taken from experimental data and literature, and are given in Table 1. A radial irradiance distribution of the form Eq. 3[TeX:] \documentclass[12pt]{minimal}\begin{document}\begin{eqnarray} \hspace*{-1pc} I(r) &=& A_0 \left\{ {\exp \left[ { - \left({\frac{{r - r_0 }}{{w_0 }}} \right)^2 } \right]} \right\} + \exp \left[ { - \left({\frac{{r + r_0 }}{{w_0 }}} \right)^2 } \right]\nonumber\\ &&+ A_1 \left[ {1 + {\rm erf}\left({\frac{{r_0 - r}}{{w_1 }}} \right)} \right] \end{eqnarray}\end{document}Eq. 4[TeX:] \documentclass[12pt]{minimal}\begin{document}\begin{equation} M(\%) = \left\{ {1 - \frac{{I(r = 0)}}{{{\rm max}\left[ {I(r)} \right]}}} \right\}100\%. \end{equation}\end{document}Fig. 8(a) Aerial cross section of in-focus flat-top beam with functional fit [Eq. 3]. (b) Flat-top cross section, defocused by 0.5 mm. FWHM diameter remains constant, but falloff on the beam edge becomes wider. (c) Computed profile of temperature increase at RPE for in-focus and 0.5-mm defocused flat-top beam (10-ms pulse duration, mild coagulation threshold power, 0.66× demagnification of fit profiles). (d) Aerial cross section of in-focus 75% modulated annular beam with functional fit. (e) Annular beam cross section, defocused by 0.5 mm. FWHM diameter increases by 8%, and central depression is reduced. (f) Computed profile of temperature increase at RPE for in-focus and 0.5-mm defocused annular beam (10-ms pulse duration, mild coagulation threshold power, 0.66× demagnification). 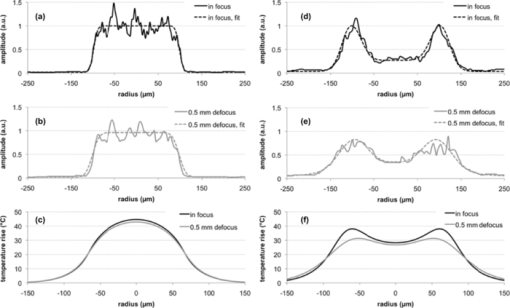 Table 1Optical properties of absorbing ocular tissues at 532 nm, from Sramek (Ref. 20). Layer thicknesses for rabbit retina were taken from literature and estimated from histology (Refs. 21 and 33). Absorption and scattering coefficients determined from experiments and literature (Refs. 21 and 34).
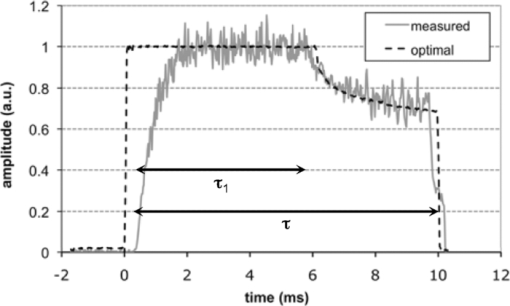
2.2.Pulse-Shape OptimizationTo reduce computation time in the optimization of the pulse shape, a semianalytical approximation to the model described in Sec. 2.1 was constructed. This simplified model approximated the posterior pole as two homogeneous absorbing layers, a 4-μm retinal pigment epithelium adjacent to a 70-μm choroidal layer embedded in an infinite nonabsorbing medium. The axisymmetric heat-conduction model was coupled with an Arrhenius damage model. The Green's function solution to the heat-conduction equation21 was numerically integrated in MATLAB (Version 7.4, MathWorks, Natick, Massachussets) for the RPE temperature rise at the center of a flat-top beam during a pulse of length τ, Eq. 5[TeX:] \documentclass[12pt]{minimal}\begin{document}\begin{equation} \Delta T(\tau)\! =\! \frac{{\kappa P}}{{2(\pi \kappa)^{3/2} \rho c_{\rm p} R^2 }}\int_0^\tau\, {dt}' \frac{{f(t' - t)}}{{\sqrt {t'} }}\big({1 - e^{ - \textstyle\frac{{R^2 }}{{4\kappa t'}}} } \big)Z_{{\mathop{\rm int}} } (t'), \end{equation}\end{document}Eq. 6[TeX:] \documentclass[12pt]{minimal}\begin{document}\begin{equation} \hspace{-1pt}Z_{\rm int} (t')\hspace*{-.5pt} =\hspace*{-.5pt} \alpha _1 \int^{z_{\rm RPE}}_{0}\hspace*{-.5pt} {dz'e^{ - (z^{\prime 2 /4\kappa t'}) - \alpha _1 z'}} + \alpha _2 \int_{z_{{\rm RPE}} }^{z_{{\rm CH}} } {dz'e^{ - (z^{\prime 2 /4\kappa t'}) - \alpha _2 z'} }. \end{equation}\end{document}The pulse shape included two distinct phases: a constant-power phase (t < τ1) and a decreasing power phase (τ1 < t < τ). Vectors f(τ1 ,τ) representing the pulse shape f(t) were constructed for pulse durations τ of 5, 10, and 20 ms and τ1 between 0.01·τ and 0.99·τ. The decreasing power phase was approximated as a spline defined at 20 evenly spaced points. A multiparameter numerical optimization was performed for spline points that minimized the mean-square error of computed ΔT(t) and constant temperature on the interval [τ1,τ] for all (τ1,τ) pairs considered. To find the duration of the initial phase τ1 maximizing the therapeutic window in this model, the thresholds of rupture and mild coagulation were estimated. Temperature rise of 143°C was defined as a threshold of vaporization and retinal rupture, corresponding to a 180°C temperature at vaporization and 37°C ambient temperature in accordance with previous measurements.20 In calculating the powers that brought peak temperature up to this threshold, the Z int term was modified to include a central “hot spot” of elevated absorption coefficient (αHS = 5900 cm−1) with an 11-μm radius, corresponding to a maximally pigmented RPE cell, as in the previously described finite element model of retinal coagulation.20 Mild coagulation thresholds were estimated as the power at each duration that brought the peak Arrhenius integral [Eq. 2] up to the corresponding peak value in the finite element model of retinal coagulation. This model's Arrhenius parameters (E* = 340 kJ/mol, A = 1.6 × 1055), inferred from ex vivo rabbit RPE viability measurements, were used in these calculations.20 Initial phase durations (τ1) of 3.3, 6.4, and 11 ms maximized the therapeutic window for pulse durations of 5, 10, and 20 ms, respectively, with pulses decaying down to 0.63, 0.71, and 0.76 of the peak amplitude along the optimized splines. An optimal shape calculated for a 10-ms duration pulse is shown in Fig. 2. 2.3.Optoelectronic Setup: Annular BeamA modified slit lamp (Zeiss, SL 130) was used to support the laser delivery system and provide a view of the fundus [Fig. 3a] during annular beam irradiation in rabbits. Optical radiation from a 3-W, 532-nm diode-pumped solid state laser (DPSSL, MP532–3W, Monocrom S.L., Vilanova i la Geltrú, Spain) was used for treatment. This laser has a specified M 2 < 4, and a minimum waist diameter of 0.12 mm at the output coupler. At the output of the laser head, a mechanical shutter (CS45, Uniblitz Electronics, Rochester, New York) was used to cut off the first 15 ms of the laser output to limit initial transient oscillations and reduce the pulse rise time to < 0.4 ms, as measured by a 100-MHz bandwidth photodetector (1621, New Focus, Inc., Santa Clara, California). The beam was coupled into a multimode optical fiber (FG200LCC, 5 m length, Thorlabs, Inc., Newton, New Jersey) with a 200-μm core diameter and 0.22 numerical aperture (NA) using a 125-mm focal length lens. An annular illumination pattern was achieved by coupling the beam into the fiber at an angle. Adjusting the lateral displacement of the laser beam from the center of the focusing lens in the range of 10–15 mm allowed for variation of the incidence angle Θ at the entrance to the fiber within 4–7 deg with respect to normal. The focal length and coupling angle was chosen such that the beam NA nearly matched the acceptance NA of the fiber, while the laser spot size underfilled the diameter of the fiber. Power transmission through the fiber with this coupling method was >50%, resulting in peak power in the slit lamp's aerial focal plane of up to 1 W. A 635-nm diode laser (LabLaser 4 mW E, Coherent, Inc., Santa Clara, California) was folded into the path via a dichroic mirror for alignment. Fig. 3(a) Simplified diagram of the annular beam photocoagulation setup. Annular profile is achieved by coupling into a multimode fiber at an angle. A conventional slit-lamp and fiber coupler serve as the delivery system. A 635-nm, 4-mW laser diode provided an aiming beam. (b) Sample aerial beam cross sections for 50% and (c) 75% modulation, with the average functional fit from Eq. 3 used in computational modeling. Aerial beam diameters (FWHM) are 233 and 247 μm for 50 and 75% modulation, respectively. 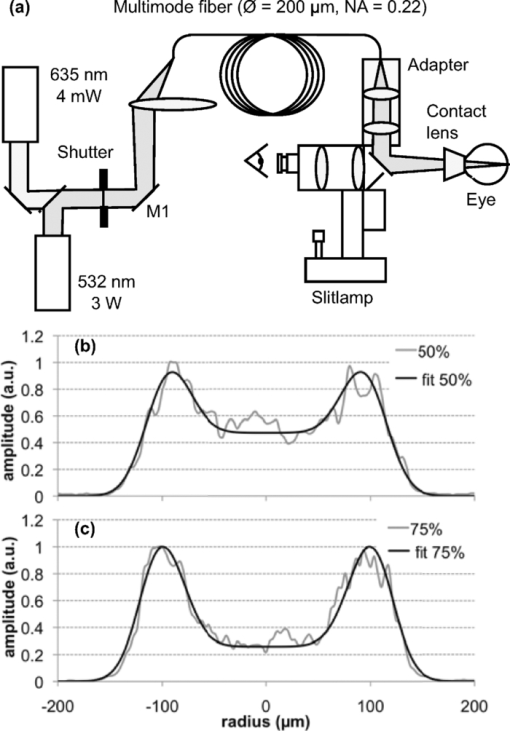 This particular coupling method resulted in an angular distribution at the distal end of the fiber centered about ±Θ. The central irradiance amplitude (modulation depth) could be controlled by variation of the position of the coupling mirror [M1 in Fig. 3a]. This allowed for continuous variation between the flat-top and fully modulated annular profiles. Two central amplitude modulation depths [defined in Eq. 4] were tested in this study: 50 and 75%. Although fiber-based photocoagulation systems typically image the distal end of a fiber onto the retinal plane to produce a flat-top beam profile, in this system an annular profile was created by imaging a plane displaced roughly 0.5 mm from the fiber end. A conventional slit-lamp adapter (LaserLink, Lumenis, Santa Clara, California) was used to image this plane near the fiber tip onto the retina. The beam shape in the aerial focal plane was detected before every experiment with a CCD (Micropublisher 3.3, Q-imaging) to ensure that a proper profile was achieved. At the aerial image plane of the slit-lamp microscope, the full-width-half-max (FWHM) spot size measured 233 ± 3 and 247 ± 4 μm for 50 and 75% modulation depth, respectively [Figs. 3b and 3c]. The 10–90% laser irradiance transition occurred over 37 μm on the external edge of the annulus in both cases. Peak spatial variation of the beam irradiance due to speckling was estimated for each beam image by examining a circular contour coinciding with the irradiance maximum. Variation was 16% standard deviation relative to the mean on the contour, averaged over all images. A graphical user interface (LabView, National Instruments Corporation, Austin, Texas) for the laser power supply (DS11, OSTech GmbH, Berlin) allowed for adjustment of duration and power, and a foot pedal activated the laser. This system was used to produce constant-power pulses of 2–50 ms in duration, with irradiance variations during the pulse and pulse-to-pulse energy variation of ∼10%, as measured by the fast photodetector and a thermal power sensor (10A, Ophir Optronics, Jerusalem, Israel), respectively. 2.4.Optoelectronic Setup: Modulated PulseA PASCAL photocoagulator (Topcon Medical Laser Systems, Inc., Santa Clara, California) provided optical radiation from a continuous wave frequency-doubled Nd:YAG laser (532 nm). The device consisted of a modified slit lamp and optical system that telecentrically imaged the surface of a multimode step index optical fiber through a two-axis scanner. Peak output power could be continuously varied from 10 to 2500 mW. A graphical user interface allowed for control of clinical parameters, including spot size, duration, and power, and a foot pedal activated the laser. This system was used to produce pulses of 2–50 ms in duration with a 200-μm spot size (flat-top beam) in the aerial focal plane. To achieve shaped pulses, a trigger signal from the photocoagulator foot pedal was conditioned with a digital delay generator (DG535, Stanford Research Systems, Sunnyvale, California) and used to gate the output of an arbitrary waveform generator (33120A, Agilent, Santa Clara, California). A graphical user interface allowed for control of the pulse shape and amplitude from the waveform generator. This interface was programmed with the optimal pulse shapes computed in MATLAB, as described in Sec. 2.2. The shaped pulse was used as an input to the PASCAL laser driver, which modulated the power of the laser pulse according to the input waveform, as exemplified in Fig. 2. Rise time for the pulse was <1 ms, and fall time was <0.6 ms. Power variations during the initial phase of constant power were <10% relative standard deviation, as measured with the 100-MHz bandwidth photodetector. Pulse-to-pulse energy variation for identical pulses was <5%. The measured laser output waveforms, excluding the rise and fall periods, did not significantly deviate from the supplied voltage waveforms, as indicated by reduced χ2 values close to unity for these comparisons (χ2 = 1.01, 1.15, and 0.96; degrees of freedom = 150, 173, and 224 for 5-, 10-, and 20-ms pulse durations, respectively). Spatial irradiance variations due to speckling, estimated from aerial beam images, were ∼10% relative standard deviation, and no difference in speckle pattern was observed between the initial and final power levels of the modulated pulse. To produce flat-top beam, constant-power exposures for comparison to both annular beam and shaped pulse thresholds, the photocoagulator was operated in a conventional regime with pulse durations in the range of 2–50 ms. 2.5.In Vivo Threshold MeasurementsTwenty-two Dutch-Belted rabbits (1.5–2.5 kg weight) were used in accordance with the Association for Research in Vision and Ophthalmology Resolution on the Use of Animals in Ophthalmic and Vision Research with approval from the Stanford University Animal Institutional Review Board. Ketamine hydrochloride (35 mg/kg), xylazine (5 mg/kg), and glycopyrrolate (0.01 mg/kg) were used for anesthesia. Pupil dilation was achieved by one drop each of 1% tropicamide and 2.5% phenylephrine hydrochloride, and topical tetracaine hydrochloride 0.5% was used for local anesthesia. Lesions were placed in both eyes of each rabbit in acute experiments. In annular beam experiments, 14 animals were treated with 75% depth of modulation. Exposures of 2, 5, and 10 ms were placed in one eye of each animal while 20 and 50 ms exposures were placed in the other eye. Eight additional animals were treated with the 50% modulation depth. Three exposure durations (5, 10, and 20 ms or 2, 5, and 50 ms) were placed in both eyes with this configuration. Between 8 and 14 eyes were treated with each beam shape and pulse duration, and ∼200 total lesions were placed per eye. Modulated pulse exposures were placed in each eye of 11 rabbits. Pulses of 5 and 10 ms were placed in one eye of each animal, and 20-ms exposures were placed in the other eye. In every eye, constant power, flat-top beam exposures of the same duration as those used with annular beam and shaped pulse were placed to allow for direct comparison of the therapeutic window of each treatment on an eye-to-eye basis. The threshold powers of mild coagulation and rupture at each pulse duration were measured for the two annular beam shapes with pulses of constant power and for a flat-top beam with modulated power. For comparison, these thresholds were also recorded for constant-power exposures with a flat-top beam shape. Between 12 and 48 separate lesions were placed per eye at each pulse duration for each treatment type. Power was titrated to produce lesions with clinical grades ranging from invisible to rupture. A standard retinal laser contact lens (OMRA-S, Ocular Instruments, Bellevue, Washington) was placed onto the dilated eye using hydroxypropyl methylcellulose as a contact gel. Taking into account the combined magnifications of the contact lens and rabbit eye of 0.66,22 the aerial spot sizes of 233 and 247 μm for the annular beams and 200 μm for the flat-top beam corresponded to retinal spot sizes of 154, 163, and 132 μm, respectively. Thresholds for mild coagulation were measured prior to rupture in order to limit the view obscuration due to occasional bleeding into the vitreous. Lesions were all placed in the central fundus in areas with similar pigmentation. The clinical appearance of the laser lesions was graded by one of two observers (L.L. and T.L.) within 3 s of delivering the laser pulse according to the following scale: invisible, barely visible, mild, intense, and rupture. A barely visible lesion was one that just crossed the limit of clinical detection, whereas a mild lesion produced more significant blanching. An intense lesion had an area of central whitening, with or without a ring of translucent edema. Thermomechanical rupture of Bruch's membrane was assumed when a vapor bubble, bleeding, or discontinuity (hole or rip) in the retinal architecture was visualized. As rupture was assessed to occur with or without visible bleeding, this upper threshold was a more conservative estimate of the upper threshold of the therapeutic window than hemorrhage alone, as used in previous studies.10, 11 ED50 threshold powers for mild coagulation and rupture in each eye were calculated by Probit analysis23 in MATLAB 7.4. The difference in therapeutic window between flat-top and annular beam shapes, as well as modulated and constant-power pulse shapes, was calculated for each eye and averaged over all eyes for each pulse duration. 2.6.Statistical AnalysisThe therapeutic window is expected to have a ratio statistical distribution, with the underlying threshold laser powers following correlated normal distributions. This ratio distribution can deviate significantly from a normal distribution, making nonparametric hypothesis testing preferable.24 Independently for the annular beam and shaped pulse thresholds, a paired permutation test25, 26 was performed in MATLAB 7.4 against the flat-top, constant-power pulse data for the null hypothesis that the measured therapeutic windows came from the same distribution. 2.7.Lesion HistologyTo compare histology of the retinal lesions produced to annular (50% modulation) and flat-top beams, mild coagulation lesions were produced in two eyes with 5-, 10-, and 20-ms pulse duration. Lesions were placed one and seven days prior to euthanasia and enucleation. The eyes were fixed in 1.25% glutaraldehyde/1% paraformaldehyde in cacodylate buffer at pH 7.4. They were then postfixed in osmium tetroxide, dehydrated with a graded series of ethanol, and embedded in epoxy resin. Sections of 1-μm thickness were stained with toluidine blue and examined by light microscopy. Thirty-eight lesions in total were analyzed by histology. 2.8.Retinal Temperature Estimations from Computational ModelingA nonlinear least-squares numerical estimation of the fit parameters in Eq. 3 was performed in MATLAB 7.4 for each beam image to provide a functional description of the irradiance distribution on the retina. The resulting average parameter values are listed in Table 2. Radial dimensions of the fits were reduced by 0.66× to account for demagnification by the contact lens/rabbit eye system in vivo,22 and power transmittance to the retina of 40% was assumed.20 Further changes to the beam shape due to the optical system of the eye were not considered. With these irradiance profiles, temperature rise was calculated for 2–50 ms exposures with both flat-top and annular beams using the model described in Sec. 2.1. The experimental modulation depths of 0 (flat top), 50, and 75% were considered, and measured threshold powers for light coagulation were used to compute temperature rise in the retina. Table 2Mean fit parameters (with standard deviation, SD) from Eq. 3 for 50 and 75% modulated annular beam and flat-top beam, corresponding to aerial beam images (N = 13).
3.ResultsMean mild coagulation and rupture ED50 threshold powers are shown in Fig. 4 (empty and filled symbols, respectively). Probit slope (ED84/ED50) was calculated for each pulse duration, threshold type (coagulation or rupture), and eye. Average slopes over all eyes were 1.09 for the annular beams, 1.15 for the modulated pulse, and 1.07 for the constant-power pulse (flat-top beam). The safe TW appeared to increase logarithmically with pulse duration for both annular and flat-top beam shapes with constant-power exposures [Fig. 5a], similarly to previous measurements with a flat-top beam and constant-power pulse.12 Fig. 4(a) Mild coagulation (hollow) and rupture thresholds (solid) for flat-top beam (■), 50% modulated annular beam (●), and 75% modulated annular beam (▲) as a function of pulse duration. Error bars indicate standard deviation in threshold measurements. Thresholds for annular beam were 70% larger on average than for flat-top beam. (b) Mild coagulation (hollow) and rupture thresholds (solid) for modulated pulse (▲) and constant-power pulse (■) as a function of pulse duration. Higher peak power was needed to rupture with 5 and 10 ms modulated, while mild coagulation threshold was comparable to constant-power pulses. 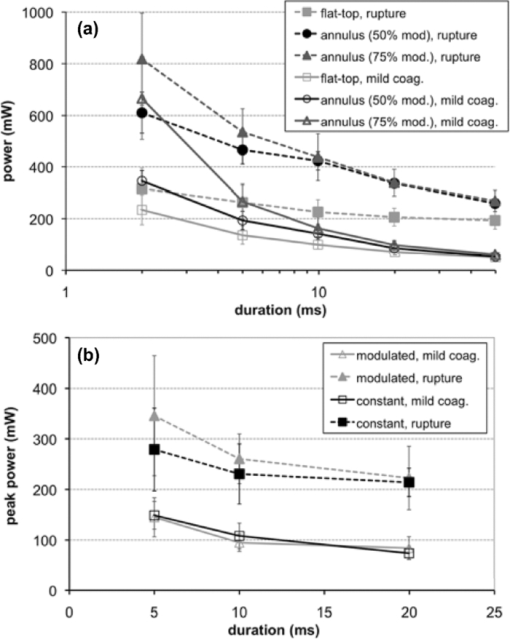 With the annular beams, the increase in TW was found to be statistically significant (p < 0.05) for 10–50 ms exposures with 75% modulation depth and for 10–20 ms with 50% modulation depth. The mean relative increase in TW over flat-top beam was 24% over all statistically significant observations. The magnitude of this change increased with duration for both beam shapes, and the 50% modulated beam demonstrated a modest improvement (+0.1 average increase in TW) over the 75% modulated beam. These results are summarized in Fig. 5b, with error bars corresponding to the 95% confidence interval. The flat-top thresholds in Fig. 4a and TW in Fig. 5a represent the mean values over all experiments, paired with either annular beam modulation level. The mean increase in TW shown in Fig. 5b represents the paired increase for each modulation level. An increase in therapeutic window (p < 0.003) was found for 5- and 10-ms modulated pulses, but not for 20-ms pulse duration [Fig. 5c]. The mean TW increase for 5 ms was +0.51, whereas the increase for 10 ms was +0.61, corresponding to changes of 27% and 29%, respectively. These results are summarized in Fig. 5d. Overall, improvement in TW for both annular beam and modulated pulse at 10 ms pulse duration was 28%. Figure 6 compares histological sections of the mild coagulation lesions produced with 5-ms exposures using flat-top and 50% modulated annular beams. At one day, lesion diameter d, measured as the size of the defect at the RPE-photoreceptor junction and pooled over all exposure durations, was 37% larger on average for the annular beam than for the flat-top beam (annular: d = 182 ± 22 μm, N = 6; flat-top: d = 133 ± 12 μm, N = 7) as expected due to the larger spot size. In both types of lesions, there was edema and vacuolization present in the inner nuclear layer (INL) and outer nuclear layer (ONL). Inner and outer segments of photoreceptors were shortened, and nuclei in the ONL were pyknotic. RPE continuity appeared disrupted and RPE cells were hyperpigmented. At one week, the ONL and photoreceptor layer were replaced by an anuclear matrix, and the photoreceptor defect at the level of the photoreceptor-RPE junction had shrunk (annular: 102 ± 15 μm, N = 16; flat-top: 105 ± 11 μm, N = 9) relative to the initial size for both lesion types. Fig. 6The 5-ms pulse duration, mild coagulation: One-day histological sections of both annular and flat-top lesions show disruption of the photoreceptor outer segments and pyknotic nuclei in the outer nuclear layer. At the one week, lesion size is reduced and no inner retinal edema is present. Radial extent of damage at the RPE-photoreceptor junction is indicated by the white line below each lesion. GCL indicates ganglion cell layer and CHO choroid. 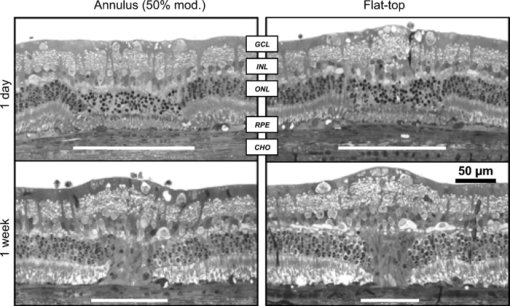 Beam fit profiles and corresponding computed temperature rise for 2–50 ms pulse durations with flat-top, 50%, and 75% modulated annular beams are shown in Fig. 7. If overheating is considered relative to temperature rise at a 50-μm radius (the approximate extent of the flat portion of the flat-top beam), central overheating remains between 20 and 35% over the 2–50 ms duration for the flat-top beam. A 50% modulation appears to be optimal for pulse durations of >10 ms, with over-/underheating relative to the temperature at the irradiance maxima of <10%. The 75% modulated annular beam demonstrates central underheating for all pulse durations, with the amount of underheating decreasing from 74 to 6% over the 2–50 ms durations. Temperature magnitudes ranged from 60 to 104°C, comparable to previously estimated temperatures at coagulation threshold in the millisecond regime.20, 27 Fig. 7(a) Average functional fit [Eq. 3] to measured beam irradiance for flat-top, 50% modulated annular beam, and 75% modulated annular beam, in arbitrary units (a.u.). (b–f) Computed maximum temperature rise for 2–50 ms durations. Mean threshold powers for mild coagulation with each beam shape were used in calculation of temperature. 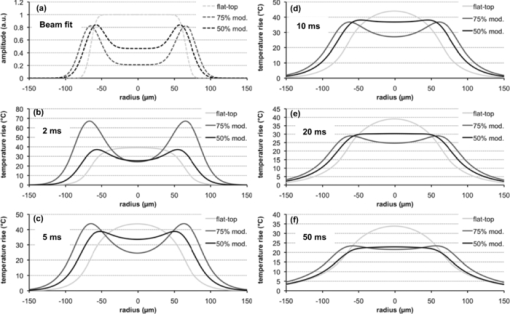 4.DiscussionThe goal of this study was evaluation of potential improvements in a photocoagulation therapeutic window with an annular beam or modulated pulse. Both approaches yielded encouraging results in animal tests, while several factors affecting their practical implementation in clinical settings should be considered. 4.1.Optimization of Beam and Pulse ShapesThe statistically significant improvement in safe therapeutic window for 10–20 ms pulse durations suggests that decreasing irradiance in the beam center had indeed the desired effect on temperature distribution for pulse durations sufficiently long for heat to diffuse into the center. The amplitude and width of the required central depression depend on the pulse duration and beam size. A characteristic length scale for temperature elevation in an isotropic 3-D geometry is the thermal diffusion length L D = (6κτ)1/2, where κ is the thermal diffusivity of the medium (1.5 × 10⁻⁷ m2/s for liquid water) and τ is the pulse duration. L D is the radius at which the local temperature rise T(L D ,t) caused by an instantaneous point source of heat is maximized at time τ. With the peak-to-center distance of the annular beam on the retina of ∼60 μm and the heat diffusion length in water for a 2-ms pulse L D = 42 μm, the heat produced along the peak of the annulus is not expected to reach the center at this duration. This is indeed supported by the small change in TW with 2-ms pulses. On the other hand, the diffusion length for a 5-ms pulse is 67 μm, indicating that some central heating from points in the periphery occurs at this duration. The computed temperature profiles shown in Fig. 7 indicate that the 50% modulated beam is expected to provide a relatively uniform temperature distribution with pulse durations of >5 ms. Computational estimation of the therapeutic window is complicated by the difficulty of modeling the ophthalmoscopic visibility of the lesion. The Arrhenius integral has been used for estimation of the cellular damage zone in a binary (live-dead) representation,20, 28 most suitable for assessment of RPE damage. Ophthalmoscopic visibility of retinal lesions has been associated with destruction of the photoreceptors, as confirmed histologically21 and by optical coherence tomography.29 However, estimation of lesion ophthalmoscopic visibility in a computational model is limited by the lack of a comprehensive theory linking the Arrhenius integral to increased scattering of the damaged tissue. Therefore, a significant simplification was used in the semianalytical model in optimizing the pulse shape for coagulation. Coagulation threshold was estimated solely on the peak Arrhenius value rather than a more physical measure of ophthalmoscopic visibility based on light scattering distributed through the depth of retina. A more comprehensive theory linking the Arrhenius damage integral to lesion visibility would help refine the computational model of photocoagulation. Although the experimental pulse shapes used in this study were a close approximation to the computed optimal shapes, there are some additional aspects of the optimization and experimental implementation that should be considered. The rise time of the laser (600 μs) turned out to be significant relative to the short pulse lengths used. A refined model should take into account this limitation, and parametric optimization should be performed for the experimentally attainable power profiles. The simplified semianalytical model used for optimizing the pulse shape was also missing several aspects that affect the temperature distribution in the retina, namely, inner retinal absorption and scattering, a highly absorbing pigmented choroidal layer and an irradiance distribution based on measurements of the intraocular beam shape.20 Although these additional features can be implemented in future models, they are unlikely to significantly change the results. Heat generation in the pigmented choroidal layer is expected to contribute to temperature rise in the RPE, and the departure from a flat-top beam profile will change the dynamics of heat flow from the center. However, a comparison of the temperature traces for a 20-ms exposure with and without these modifications resulted in only a 2% maximum temperature difference and 1.1% average difference when the traces were normalized to the same average temperature. 4.2.Delivery of Optimally Shaped BeamThe delivery of an optimal spatiotemporal irradiance distribution is complicated by two primary factors: imperfections in the ocular optical system and transient defocusing inherent to any clinical photocoagulation procedure. Transmittance through the transparent media of the eye is reduced by small-angle scattering.20, 21, 30 Because the annular beam used in this study has a larger NA than a conventional flat-top beam, it is expected to suffer from worse scattering, accordingly. The eye is also not an ideal optical system, and the optical transfer function of the eye31 will lead to broadening of the beam. This factor inhibits precise computational modeling of vaporization and coagulation, and adds uncertainty about the irradiance distribution on the retina. The modulation depth may change, reducing the benefit from an annular beam, and a scattering-enlarged spot size would alter the optimal pulse shape. Despite these concerns, annular lesions were visible ophthalmoscopically after 2- and 5-ms treatment with a 75% modulation depth in the photocoagulation threshold measurements, suggesting that scattering does not completely eliminate the central irradiance modulation in an annular beam. Perhaps more importantly for clinical application is imperfect focusing during the treatment. Although the use of a parfocal photocoagulation system and contact lens provides for a large depth of focus,32 errors due to the manual nature of focusing are inevitable during photocoagulation. The degree of defocusing depends on the skill and fatigue of the surgeon and the subject's level of motion. This is expected to be minimized in the case of the anesthetized animals used in this study and may be significantly worse in a clinical setting. The annular beam defocuses in a different manner than the flat-top beam. Figure 8 demonstrates the effect of a ±0.5 mm (aerial) defocus on the measured flat-top and 75% modulated beams. For the flat-top beam, the FWHM diameter remains constant, with an increase in the 10–90% fall-off distance from 18.3 to 34.5 μm. With the 75% modulated beam, the same defocus reduces the central depression, resulting in a modulation depth of 61% and an 8% larger FWHM diameter. Figures 8c and 8f show computed temperature profiles at the RPE/photoreceptor interface for 10-ms exposures with the defocused beams (demagnified by 0.66×). Peak temperature for the flat-top decreases by 2%, while the modulated beam peak temperature decreases by 10%. Further defocusing to ±1 mm eliminates the central depression of the annular beam and increases the aerial FWHM diameter to 290 μm, further decreasing expected peak temperature. This suggests that the modulated beam should not be any more prone to rupture with defocusing than conventional treatment. Interestingly, consistent focusing of the annular beam during lesion placement was easier than with the flat top due to the dark center being visible when in focus. It remains to be seen if a consistent focus can be achieved in a clinical setting with an annular beam. Because depth of focus of an optical system scales as (NA)−2, the focal depth of the annular beam can be increased by decreasing beam diameter prior to the imaging lens, using a fiber with smaller NA. 4.3.Reproducibility in Clinical ContextOther factors in addition to beam delivery influence the translation of these animal findings to a clinical context. As in many in vivo measurements, the determination of threshold powers for coagulation and rupture is inherently a subjective assessment. The distinction between a minimally visible lesion and mild coagulation is particularly sensitive to bias. Although the MVL threshold is more objective because it depends solely on visibility rather then judgment of the lesion character, the mild coagulation threshold is more clinically relevant and more familiar as a photocoagulation end point to the clinician. We attempted to control for subjectivity by blinding the observer to the laser settings, using the same lesion judgment criteria for all treatment types, and pairing threshold measurements by placing both conventional flat-top lesions and annular beam or shaped-pulse lesions in each eye. The retinal coagulation lesions applied in this study were confined to an area of similar pigmentation adjacent to the medullary ray in rabbits. Limitations exist with regard to the extrapolation of these data from rabbits to humans. For example, lesion grades are enhanced in more peripheral areas of the fundus compared to the posterior retina in humans. Lesion histological character was similar for annular and flat-top beams after one week (Fig. 6), but comparative assessment of the clinical efficacy of these beams in retinal photocoagulation may still be required. 4.4.Spatiotemporal Beam ModulationProduction of spatially and temporally modulated treatment beams in a clinically practical photocoagulation system would require relatively simple modifications to existing clinical laser systems. Fiber-based beam shaping, which allows for control over modulation depth, is straightforward to implement, but system stability should be considered because the mode structure and coupled power are sensitive to mechanical strain on the fiber. Imaging of the beam after several experiments indicated that movement of the fiber due to motion of the slit lamp did not significantly change the radial profile. Even so, alternative methods for shaping the beam should be explored, such as masking the fiber tip or using spatial light modulators. In diode-pumped solid state laser systems, adjustment of the laser power during the pulse requires only analog modulation of the laser pump current. This can be achieved with the insertion of a simple pulse-shaping circuit in existing laser systems. More sophisticated approaches could use additional digital logic to allow for adjustment of the pulse shape to pulse duration. A logical extension to the separate beam and pulse-shaping approaches discussed in this work is a combined approach, allowing the beam shape to evolve during the pulse. Rather than simply providing for a uniform radial temperature distribution at the end of the pulse, spatiotemporal optimization of the beam evolution ideally results in a constant temperature maintained across the entire lesion diameter throughout the pulse. This would provide maximum coagulation over a defined area at a given fixed peak temperature and could be practically achieved by changing the coupling angle during the pulse in the multimode fiber. Retinal pigmentation has been estimated to vary by about a factor of 2 across the human fundus;19 a clinical treatment minimizing the risk of rupture of Bruch's membrane has a therapeutic window accommodating the corresponding variability in the coagulation threshold. Our results in rabbit indicate that an annular beam or modulated pulse can provide for a therapeutic window of ∼3 with a 10-ms pulse duration, rather than 20 ms with a flat-top beam and constant-power pulse (Fig. 5). A similar increase in TW was obtained by increasing the aerial spot size from 200 to 500 μm with a 10-ms pulse duration.12 Although substantial questions remain about the practicality of achieving optimal irradiance distributions in a clinical setting, the potential benefits of treatment with shorter pulse durations encourage further investigation along these lines. Fig. 5(a) TW (ratio of rupture and mild coagulation thresholds) as a function of pulse duration for flat-top beam (■), 50% modulated annular beam (●), and 75% modulated annular beam (▲). Measured TW varied logarithmically with pulse duration (lines) and was found to decrease with duration for all beam shapes. TW > 3 (highlighted) at 10 ms with annular beam. (b) Difference in TW between annular beam and flat-top with 95% confidence intervals. Statistically significant results from permutation test (p < 0.05) are indicated (*). (c) TW for modulated pulse (▲) and constant-power pulse (■). No difference in TW was observed for 20-ms pulse duration, while 5- and 10-ms modulated pulse TW was larger. (d) Difference in TW between modulated pulse and constant-power pulse. 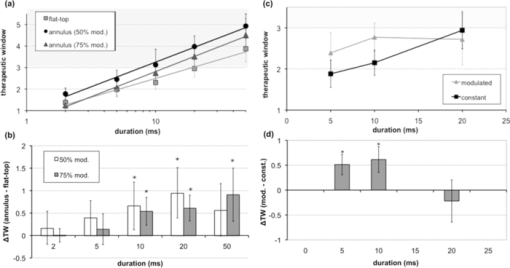 AcknowledgmentsThe authors thank Roopa Dalal for histological preparations and Alex Chang for laboratory support, as well as Nicholas Henderson for discussions on optimization methodology and Ryan Tibshirani for guidance with statistical analysis. Funding was provided by the U.S. Air Force Office of Scientific Research (Grant No. FA9550-04-1-0075), Stanford Photonics Research Center, and the Heed Ophthalmic Foundation. ReferencesEarly Treatment Diabetic Retinopathy Study Research Group, “Treatment techniques and clinical guidelines for photocoagulation of diabetic macular edema. Early Treatment Diabetic Retinopathy Study Report Number 2,”
(1987) Google Scholar
H. L. Little, H. C. Zweng, and
R. R. Peabody,
“Argon laser slit-lamp retinal photocoagulation,”
Trans. Am. Acad. Ophthalmol. Otolaryngol., 74 85
–97
(1970). Google Scholar
M. A. Mainster,
“Decreasing retinal photocoagulation damage: principles and techniques,”
Semin. Ophthalmol., 14 200
–209
(1999). https://doi.org/10.3109/08820539909069538 Google Scholar
M. S. Blumenkranz, D. Yellachich, D. E. Andersen, M. W. Wiltberger, D. Mordaunt, G. R. Marcellino, and
D. Palanker,
“Semiautomated patterned scanning laser for retinal photocoagulation,”
Retina, 26 370
–376
(2006). https://doi.org/10.1097/00006982-200603000-00024 Google Scholar
S. Al-Hussainy, P. M. Dodson, and
J. M. Gibson,
“Pain response and follow-up of patients undergoing panretinal laser photocoagulation with reduced exposure times,”
Eye, 22 96
–99
(2008). https://doi.org/10.1038/sj.eye.6703026 Google Scholar
M. M. Muqit, G. R. Marcellino, J. C. Gray, R. McLauchlan, D. B. Henson, L. B. Young, N. Patton, S. J. Charles, G. S. Turner, and
P. E. Stanga,
“Pain responses of Pascal 20 ms multi-spot and 100 ms single-spot panretinal photocoagulation: Manchester Pascal Study, MAPASS Report 2,”
Br. J. Ophthalmol., 94
(11), 1493
–1498
(2010). Google Scholar
D. Modi, P. Chiranand, and
L. Akduman,
“Efficacy of patterned scan laser in treatment of macular edema and retinal neovascularization,”
Clin. Ophthalmol., 3 465
–470
(2009). https://doi.org/10.2147/OPTH.S6486 Google Scholar
M. M. K. Muqit, C. Sanghvi, R. McLauchlan, C. Delgado, L. B. Young, S. J. Charles, G. R. Marcellino, and
P. E. Stanga,
“Study of clinical applications and safety for Pascal(R) laser photocoagulation in retinal vascular disorders,”
Acta Ophthalmol., https://doi.org/10.1111/j.1755-3768.2009.01854.x Google Scholar
M. Nagpal, S. Marlecha, and
K. Nagpal,
“Comparison of laser photocoagulation for diabetic retinopathy using 532-nm standard laser versus multispot pattern scan laser,”
Retina, 30
(3), 452
–458
(2010). Google Scholar
R. Birngruber, V. P. Gabel, and
F. Hillenkamp,
“Fundus reflectometry: a step towards optimization of the retina photocoagulation,”
Mod. Prob. Ophthalmol., 18 383
–390
(1977). Google Scholar
A. Obana,
“The therapeutic range of chorioretinal photocoagulation with diode and argon lasers: an experimental comparison,”
Lasers Light Ophthalmol., 4 147
–156
(1992). Google Scholar
A. Jain, M. S. Blumenkranz, Y. Paulus, M. W. Wiltberger, D. E. Andersen, P. Huie, and
D. Palanker,
“Effect of pulse duration on size and character of the lesion in retinal photocoagulation,”
Arch. Ophthalmol., 126 78
–85
(2008). https://doi.org/10.1001/archophthalmol.2007.29 Google Scholar
M. Niemz, Laser-Tissue Interactions: Fundamentals and Applications, Springer, Berlin
(2002). Google Scholar
D. M. Simanovskii, M. A. Mackanos, A. R. Irani, C. E. O’Connell-Rodwell, C. H. Contag, H. A. Schwettman, and
D. V. Palanker,
“Cellular tolerance to pulsed hyperthermia,”
Phys. Rev. E, 74 11915
(2006). https://doi.org/10.1103/PhysRevE.74.011915 Google Scholar
S. Gabay, I. Kremer, I. Ben-Sira, and
G. Erez,
“Retinal thermal response to copper-vapor laser exposure,”
Lasers Surg. Med., 8
(4), 418
–427
(1988). https://doi.org/10.1002/lsm.1900080414 Google Scholar
P. K. Kennedy, J. A. Zuclich, D. J. Lund, P. R. Edsall, S. Till, B. E. Stuck, and
R. C. Hollins,
“Laser-induced retinal damage thresholds for annular retinal beam profiles,”
Proc. SPIE, 5319 258
–266
(2004). https://doi.org/10.1117/12.529400 Google Scholar
K. Schulmeister, R. Gilber, B. Seiser, F. Edthofer, J. Husinsky, B. Fekete, and
L. Farmer,
“Retinal thermal laser damage thresholds for different beam profiles and scanned exposure,”
Proc. SPIE, 6844 68441L
(2008). https://doi.org/10.1117/12.768671 Google Scholar
T. R. Friberg and
S. Venkatesh,
“Alteration of pulse configuration affects the pain response during diode laser photocoagulation,”
Lasers Surg. Med., 16
(4), 380
–383
(1995). https://doi.org/10.1002/lsm.1900160409 Google Scholar
V. P. Gabel, R. Birngruber, and
F. V. P. Hillenkamp,
“Visible and near infrared light absorption in pigment epithelium and choroid,”
Congress Series: XXIII Concilium Ophthalmologicum, 658
–662 1978). Google Scholar
C. Sramek, Y. Paulus, H. Nomoto, P. Huie, J. Brown, and
D. Palanker,
“Dynamics of retinal photocoagulation and rupture,”
J. Biomed. Opt., 14 34007
(2009). https://doi.org/10.1117/1.3130282 Google Scholar
R. Birngruber, F. Hillenkamp, and
V. P. Gabel,
“Theoretical investigations of laser thermal retinal injury,”
Health Phys., 48 781
–796
(1985). https://doi.org/10.1097/00004032-198506000-00006 Google Scholar
R. Birngruber,
“Choroidal circulation and heat convection at the fundus of the eye: implications for laser coagulation and the stabilization of retinal temperature,”
Laser Appl. Med. Biol., 5 277
–361
(1991). Google Scholar
D. Finney, Probit Analysis, University Press, London
(1971). Google Scholar
D. Hinkley,
“On the ratio of two correlated normal random variables,”
Biometrica, 56 635
–639
(1969). https://doi.org/10.1093/biomet/56.3.635 Google Scholar
P. Good, Permutation Tests: A Practical Guide to Resampling Methods for Testing Hypotheses, Springer-Verlag, New York
(1994). Google Scholar
E. Lehmann, Testing Statistical Hypotheses, Springer, New York
(2005). Google Scholar
L. A. Priebe, C. P. Cain, and
A. J. Welch,
“Temperature rise required for production of minimal lesions in Macaca-Mulatta retina,”
Am. J. Ophthalmol., 79 405
–413
(1975). Google Scholar
K. Schulmeister, J. Husinsky, B. Seiser, F. Edthofer, B. Fekete, L. Farmer, and
D. J. Lund,
“Ex vivo and computer model study on retinal thermal laser-induced damage in the visible wavelength range,”
J. Biomed. Opt., 13
(5), 054038
(2008). https://doi.org/10.1117/1.2982526 Google Scholar
M. Bolz, K. Kriechbaum, C. Simader, G. Deak, J. Lammer, C. Treu, C. Scholda, C. Prünte, and
U. Schmidt-Erfurth,
“In vivo retinal morphology after grid laser treatment in diabetic macular edema,”
Ophthalmology, 117 538
–544
(2010). https://doi.org/10.1016/j.ophtha.2009.07.035 Google Scholar
D. H. Sliney, J. Mellerio, V.-P. Gabel, and
K. Schulmeister,
“What is the meaning of threshold in laser injury experiments? Implications for human exposure limits,”
Health Phys., 82 335
–347
(2002). https://doi.org/10.1097/00004032-200203000-00006 Google Scholar
T. J. White, M. A. Mainster, P. W. Wilson, and
J. H. Tips,
“Chorioretinal temperature increases from solar observation,”
Bull. Math. Biophys., 33
(1), 1
–17
(1971). https://doi.org/10.1007/BF02476660 Google Scholar
F. Fankhauser, U. Dürr, H. Giger, P. Rol, and
S. Kwasniewska,
“Lasers, optical systems and safety in ophthalmology: a review,”
Graefe's Arch. Clin. Exp. Ophthalmol. (Albrecht von Graefes Arch. klin. exp. Ophthalmol.), 234 473
–487
(1996). Google Scholar
R. K. Banerjee, L. Zhu, P. Gopalakrishnan, and
M. J. Kazmierczak,
“Influence of laser parameters on selective retinal treatment using single-phase heat transfer analyses,”
Med. Phys., 34 1828
–1841
(2007). https://doi.org/10.1118/1.2718731 Google Scholar
M. Hammer, A. Roggan, D. Schweitzer, and
G. Muller,
“Optical properties of ocular fundus tissues—an in vitro study using the double-integrating-sphere technique and inverse Monte Carlo simulation,”
Phys. Med. Biol., 40 963
–978
(1995). https://doi.org/10.1088/0031-9155/40/6/001 Google Scholar
|

