
|
|
1.IntroductionSpecific binding between carbohydrate and lectin proteins is well known to be associated with serious infections such as those brought about by human immunodeficiency virus, influenza, and herpes virus.1 Therefore, investigations concerning carbohydrate–lectin binding affinities can lead to the elucidation of infection mechanisms and hence accelerate the development of novel treatment and prevention strategies. The dissociation constant between carbohydrates and lectins is generally ca. 10−3–10−4 M, which is weaker than that observed for antibody–antigen interactions. Because the weak binding makes affinity evaluations ambiguous, the development of a suitable carbohydrate probe would be desirable. A variety of useful carbohydrate probes have been reported, including dendrimers modified with carbohydrates at their branches (referred to as sugar balls) and organic polymers possessing carbohydrate branches at each monomer unit. A group of glycoclusters containing a metal center is referred to as a metalloglycocluster.2, 3, 4, 5 The use of metalloglycoclusters as a probe molecule is an attractive proposition because the metal center furnishes photochemical and electrochemical properties that can be employed as useful analytical indicators in kinetic studies. Gottschaldt 6 reported on metalloglycoclusters that contain a rhenium or technetium metal center, and Kobayashi 2 and Kikkeri 3 reported on ruthenium metalloglycoclusters. Because the clusters can possess a variety of coordination numbers, in addition to providing useful photochemical and electrochemical properties, unique geometrical features can be imparted to the carbohydrate probe. The aim of the present research is to develop a novel ruthenium metalloglycocluster possessing enhanced binding affinity and specificity to lectin, and we propose the metalloglycocluster as a promising molecular probe for a novel technique that could analyze biomolecular interactions leading serious disease. 2.Experimental2.1.MaterialsAll chemical reagents were purchased from the indicated chemical companies and used without further purification. Ruthenium(III) chloride, iron(II) chloride, 2,2’-bipyridine-4, 4’-dicarboxylic acid (bpy-2COOH), lactose, and cellobiose were purchased from Sigma-Aldrich (Japan). Lectins [peanut agglutinin (PNA), Ricinus communis agglutinin 120 (RCA), Concanavalin A (ConA) and wheat germ agglutinin (WGA)] and tetanus toxin c-fragment (TCF) were obtained from Funakoshi (Japan). Reversed-phase (RP) column chromatography (RP-HPLC) was performed on a LC-8A and SPD-M10A (Shimadzu). All synthesized compounds were identified by electrospray ionization (ESI) time-of-flight (TOF) mass spectrometry (JMS-T100LC, JEOL) or matrix-assisted laser desorption ionization (MALDI) TOF mass spectrometry (Ultraflex III, Bruker). 1H and 13C NMR spectra were recorded using a Fourier-transform nuclear magnetic resonance (FT-NMR) spectrometer (Bruker). Fluorescence emission intensity and polarization were recorded using a fluorescence spectrophotometer (F-7000, Hitachi) equipped with an autopolarization measurement system. 2.2.Syntheses of MetalloglycoclustersMetalloglycoclusters [Ru(bpy-2Gal)3], [Ru(bpy-2Glc)3], [Ru(bpy)2(bpy-2Gal)], and [Ru(bpy)2(bpy-2Glc)] were prepared by following the general synthetic procedure as shown in Fig. 1. 2.2.1.bpy-2GalBpy-2COOH (100 mg, 4.1 × 10⁻⁴ mol) was added to 10 mL of thionyl chloride, and the mixture was refluxed for 6 h. After the mixture had turned yellow, the solution was evaporated. The yellow solid that remained was dissolved in a mixture of tetrahydrofuran (THF) (10 mL) and CH2Cl2 (10 mL). Fmoc-NH-(CH2)2-NH2 (325 mg, 10.2 × 10⁻⁴ mol) dissolved in THF (5 mL), CH2Cl2 (5 mL), and DIEA (N, N-diisopropylethylamine) (2 mL) was added dropwise to the yellow solution and then kept overnight. After quenching, the reaction by the addition of methanol, piperidine (9 mL) was added to the crude product dissolved in methanol and the mixture was then stirred at RT for 12 h. The crude product was purified by silica-gel column chromatography to afford bpy-2NH2 (67% yield).1H NMR (400 MHz, CD3OD) δ 8.90 [d, J = 5.1 Hz, 2H; CH(bpy)], 8.69 [s, 2H; CH(bpy)], 7.93 [d, J = 5.0 Hz, 2H; CH(bpy)] 3.70 [t, J = 6.1 Hz, 4H; CH 2 (linker moiety)], 3.14 (t, J = 6.8 Hz, 4H; CH 2); 13C NMR (100 MHz, CD3OD) δ 167.6, 156.5, 155.8, 150.3, 149.6, 143.0, 122.1, 121.2, 119.5, 44.5, 39.7, and 39.5; ESI-MS m/z (M = C16H20N6O2) 329.1 [M + H]+ (calcd: 329.2), 351.1 [M + Na]+ (calcd: 351.2). The obtained bpy-2NH2 (80 mg, 2.4 × 10⁻⁴ mol) was dissolved in H2O (10 mL), and then β-lactose (1.66 g, 4.9 × 10⁻⁵ mol) and dimethylacetamide (DMAC) (10 mL) were added to the solution. The solution was stirred in a water bath at 315 K, and acetic acid (2 mL) was added to maintain the acidity of the solution. Sodium cyanoborohydrate (0.772 g, 0.123 mol) was added to the solution, and the mixture was stirred until the MS signal for bpy-2NH2 disappeared. The crude product was purified by RP-HPLC using a Capcell Pak C18 MGII column (4.6 × 250 mm) (Shiseido) to afford the final compound as a colorless solid (11% yield). 1H NMR (400 MHz, D2O) δ 8.84 [br, 2H; CH(bpy)], 8.45 [br, 2H; CH(bpy)], 7.85 [br, 2H; CH(bpy)], 4.20–3.50 (m, 38H; CH2 and CH of carbohydrate and linker moieties); 13C NMR (100 MHz, D2O) δ 169.1 169.0 158.6 150.4 142.7 122.1 119.9 102.9 102.8 79.0 78.8 78.3 75.4 75.3 72.4 71.0 70.9 70.8 70.6 70.1 68.7 68.6 67.7 66.4 66.3 66.1 61.9 61.8 61.3 61.2 61.1 49.8 47.3; ESI-MS m/z (M = C40H64N6O22) 981.3 [M + H]+ (calcd: 981.4), 491.1 [M + 2H]2+ (calcd: 491.2). 2.2.2.bpy-2GlcBpy-2Glc was synthesized by the same procedure as for bpy-2Gal using bpy-NH2 (41 mg, 1.3 × 10⁻⁴ mol), β-cellobiose (171 mg, 4.9 × 10⁻⁴ mol), and sodium cyanoborohydrate (316 mg, 5.0 × 10⁻³ mol) (13% yield). 1H NMR (400 MHz, CD3OD) δ 8.76 [br, 1H; CH(bpy)], 8.38 [br, 1H; CH(bpy)], 7.78 [br, 1H; CH(bpy)] 3.90 – 3.20 (m, 19H; CH 2 and CH of carbohydrate and linker moieties); 13C NMR (100 MHz, CD3OD) δ 168.9, 155.5, 150.3, 142.6, 122.1, 119.9, 102.3, 78.7, 76.0, 75.4, 73.2, 70.9, 70.6, 69.5, 67.7, 61.9, 60.6, 49.9, 47.3, 36.7; ESI-MS m/z (M = C40H64N6O22) 981.3 [M + H]+ (calcd: 981.4), 491.1 [M + 2H]2+ (calcd: 491.2). 2.2.3.[Ru(bpy-2Gal)3]Ruthenium(III) chloride (500 mg) was refluxed in 2.5 mL of dimethylsulfoxide (dmso) for 5 min to give a dark red solution. Acetone (10 mL) and chloroform (10 mL) were then added to the solution to give yellow crystals. The crystals were washed with diethyl ether and dried in vacuo to afford [Ru(dmso)4Cl2] (320 mg, 28% yield). [Ru(dmso)4Cl2] (0.8 mg, 1.7 × 10⁻⁶ mol) and 3 equiv of bpy-2Gal (5.0 mg, 5.0 × 10⁻⁶ mol) were then dissolved in H2O (0.4 mL), and the reaction mixture was refluxed for 13 h to give a dark red solution. Following removal of the solvent, the crude product was purified by RP-HPLC using a Capcell Pak C18 MGII column (4.6 × 250 mm) (Shiseido) with acetonitrile/H2O (0.1% HCl) to afford the final compound as a dark orange solid (quantitative). The compound was used for the binding analysis without isolation of the Λ and Δ diastereomeric forms. 1H NMR (400 MHz, D2O) δ 8.97 [br, 6H; CH(bpy)], 7.92 [br, 6H; CH(bpy)], 7.74 [br, 6H; CH(bpy)], 4.00 – 3.16 (m, 114H; CH 2 and CH of carbohydrate and linker moieties). MALDI-MS m/z (M = C120H192N18O66Ru) 3042.1 [M – H]+ (calcd: 3042.1). 2.2.4.[Ru(bpy-2Glc)3]Using [Ru(dmso)4Cl2] (0.8 mg, 1.7 × 10⁻⁶ mol) and 3 equiv of bpy-2Glc (5.0 mg, 5.0 × 10⁻⁶ mol), Ru(bpy-2Glc)3 was synthesized by the same procedure as for [Ru(bpy-2Gal)3] (80% yield). The compound was used for the binding analysis without isolation of the Λ and Δ diastereomeric forms. 1H NMR (400 MHz, D2O) δ 9.02 [br, 6H; CH(bpy)], 7.93 [br, 6H; CH(bpy)], 7.73 [br, 6H; CH(bpy)], 4.10 – 3.10 (m, 114H; CH 2 and CH of carbohydrate and linker moieties). MALDI-MS m/z (M = C120H192N18O66Ru) 3042.5 [M – H]+ (calcd: 3042.1). 2.2.5.[Ru(bpy)2(bpy-2Gal)]Bipyridine (165 mg, 9.6 × 10⁻⁴ mol, 2 equiv) and RuCl3 (100 mg, 4.8 × 10⁻⁴ mol) were mixed in 5 mL of 1M HCl. The mixture was kept for one week, and the precipitate formed was collected by suction filtration. The collected dark green solid [Ru(bpy)2Cl2] (5 mg, 1.0 × 10⁻⁵ mol) was suspended in 5 mL of H2O. After adding bpy-2Gal (10 mg, 1.0 × 10⁻⁵ mol) and LiCl (3 mg, 7.3 × 10⁻⁵ mol), the reaction mixture was refluxed for 20 h. The solvent was removed by evaporation to give a crude product. The residue was subjected to RP-HPLC using a Capcell Pak C18 MGII column (4.6 × 250 mm) (Shiseido) with acetonitrile/H2O (0.1% HCl) as eluent to afford the final compound. 1H NMR (400 MHz, D2O) δ 8.91 [br, 1H; CH(bpy)], 8.50 [d, J = 8.0 Hz, 2H; CH(bpy)], 8.05 – 7.97 [m, 3H; CH(bpy)], 7.72 – 7.68 [m, 2H; CH(bpy)], 7.64 [br, 1H; CH(bpy)], 7.35 [br, 2H; CH(bpy)], 4.10 – 3.37 (m, 38H; CH 2 and CH of carbohydrate and linker moieties); ESI-MS m/z (M = C60H80N10O22Ru) 697.2 [M]2+ (calcd: 697.2). 2.2.6.[Ru(bpy)2(bpy-2Glc)]To a suspension of [Ru(bpy)2Cl2] (5 mg, 1.0 × 10⁻⁵ mol) in H2O (5 mL) were added bpy-2Gal (10 mg, 1.0 × 10⁻⁵ mol) and LiCl (3 mg, 7.3 × 10⁻⁵ mol), and the reaction mixture was refluxed for 20 h. The solvent was removed by evaporation to give a crude product. The residue was subjected to RP-HPLC using a Capcell Pak C18 MGII column (4.6 × 250 mm) (Shiseido) with acetonitrile/H2O (0.1% HCl) as eluent to afford the final compound. 1H NMR (400 MHz, D2O) δ 8.91 [br, 1H; CH(bpy)], 8.51 [d, J = 8.3 Hz, 2H; CH(bpy)], 8.05 – 8.00 [m, 3H; CH(bpy)], 7.75 – 7.71 [m, 2H; CH(bpy)], 7.65 (br, 1H; CH(bpy)], 7.37 [br, 2H; CH(bpy)], 3.83 – 2.96 (m, 38H; CH 2 and CH of carbohydrate and linker moieties); ESI-MS m/z (M = C60H80N10O22Ru) 697.2 [M]2+ (calcd: 697.2). 2.3.Fluorescence Emission and Polarization MeasurementsEmission intensity and fluorescence polarization were recorded using a fluorescence spectrophotometer (Hitachi, F-7000) equipped with an autopolarization measurement system. All spectra of the metalloglycoclusters were measured using 100 μM of the metalloglycocluster [Ru(bpy-2Gal or Glc)3], 300 μM of the [Ru(bpy)2(bpy-2Gal or Glc)], and 100 μM of the [Ru(bpy)3] in the absence or presence of 20 μM of lectin in phosphate buffered saline (PBS) buffer at 298 K. For the analysis of binding properties including the dissociation constant, the concentration of the metalloglycocluster was 20 μM for [Ru(bpy-2Gal or Glc)3], 60 μM for [Ru(bpy)2(bpy-2Gal or Glc)], and 20 μM for [Ru(bpy)3], and that of PNA or ConA varied from 0 to 20 μM. The excitation wavelength was 468 nm for [Ru(bpy-2Gal)3] and [Ru(bpy-2Glc)3], 470 nm for [Ru(bpy)2(bpy-2Gal)] and [Ru(bpy)2(bpy-2Glc)], and 450 nm for [Ru(bpy)3]. Fluorescence polarization (FP), P, was calculated using the equation P = (I ∥ – I ⊥ × G)/(I ∥ + I ⊥ × G), where I is the fluorescence intensity using the polarizer at 0 deg for excitation (I ∥ and I ⊥ were observed using the emission polarization filter at 0 and 90 deg, respectively). The correction factor G was determined using the following equation G = i ∥/i ⊥, where i is the fluorescence intensity at 90 deg for excitation (i ∥ and i ⊥ were observed using the emission polarization filter at 0 and 90 deg, respectively). For each sample, G factors were defined by measuring i ∥ and i ⊥ at individual wavelengths. 2.4.Calculation of Dissociation ConstantsThe dissociation constant (K d) of PNA and [Ru(bpy-2Gal)3] or [Ru(bpy)2(bpy-2Gal)], and that of ConA and [Ru(bpy-2Glc)3] or [Ru(bpy)2(bpy-2Glc)] were determined using nonlinear least-squares fitting. Using the fluorescence polarization value, the data were fitted to the equation P/P max = [(K d + [probe]total + [lectin]total) – {(K d + [probe]total + [lectin]total)2 – 4[probe]total[lectin]total}]/2[probe]total, where P is the polarization value, P max is the maximum polarization value, [probe]total is the total concentration of the metalloglycocluster, and [lectin]total is the total concentration of lectin (PNA or ConA). 2.5.Affinity Evaluation of Tetanus Toxin C-FragmentFluorescence polarization values were recorded using a fluorescence spectrophotometer (Hitachi, F-7000) equipped with an autopolarization measurement system. The metalloglycoclusters [Ru(bpy-2Gal)3] and [Ru(bpy-2Glc)3] were measured using a 2-μM concentration of the PBS solution. Polarization values of the metalloglycocluster in the absence or presence of 0.05 μM tetanus toxin c-fragment were collected in PBS buffer at 298 K. The excitation wavelength was 468 nm for [Ru(bpy-2Gal)3] and [Ru(bpy-2Glc)3]. 3.Results and Discussions3.1.Preparation and Characterization of MetalloglycoclustersWe designed novel metalloglycoclusters possessing a ruthenium metal center surrounded by six ([Ru(bpy-2Gal)3] and [Ru(bpy-2Glc)3]) or two ([Ru(bpy)2(bpy-2Gal)] and [Ru(bpy)2(bpy-2Glc)]) carbohydrate moieties (Fig. 2). A metal complex without carbohydrate moiety, [Ru(bpy)3], was used as a reference probe. All the designed metalloglycoclusters were synthesized by chemical synthetic procedures. In brief, carbohydrate (lactose or cellobiose) was introduced to the bipyridyl moiety by a reductive amination reaction to afford the carbohydrate ligands (bpy-2Gal or bpy-2Glc), as shown in Fig. 1. To these ligands was then added the ruthenium(II) complex, and the mixture was refluxed to afford the corresponding metalloglycoclusters ([Ru(bpy-2Gal)3] or [Ru(bpy-2Glc)3]). Metalloglycoclusters possessing different ligands ([Ru(bpy)2(bpy-2Gal)] or [Ru(bpy)2(bpy-2Glc)]) were obtained by a two-step complexation reaction. All metalloglycoclusters were used without isolation of the Δ and Λ diastereomeric forms. 3.2.Specific Binding of Metalloglycoclusters to Lectins Evaluated by Fluorescence EmissionIn an effort to examine the binding properties of the metalloglycoclusters, fluorescence emission (FE) spectra were measured for each probe prior to and following the addition of each lectin (PNA, RCA, ConA, or WGA). Repeatability was confirmed by continuous measurement under the same condition. Figure 3a shows the emission spectra of [Ru(bpy-2Gal)3] in the absence or presence of each lectin. Addition of PNA to [Ru(bpy-2Gal)3] resulted in the most drastic change to the emission spectrum compared to the other lectins. In particular, a new emission peak appeared at ca. 580 nm. Because this peak disappeared following the addition of galactose to the solution, the emission at 580 nm is derived from the interaction between PNA and galactose moieties of [Ru(bpy-2Gal)3]. Similarly, a new emission peak appeared when ethanol was added to the PBS solution of [Ru(bpy-2Gal)3] [Fig. 3d]. Therefore, the new emission peak is evidence that [Ru(bpy-2Gal)3] binds to a hydrophobic binding pocket of PNA. Excitation spectra of [Ru(bpy-2Gal)3] with PNA at 580 and 650 nm confirmed that the new emission peak was not derived from Raman scatter or impurities. As in the case of [Ru(bpy-2Gal)3], the addition of PNA to [Ru(bpy)2(bpy-2Gal)] also resulted in the appearance of a new emission peak at ca. 580 nm, which confirms that the metalloglycocluster [Ru(bpy)2(bpy-2Gal)] is bound to the hydrophobic binding pocket of PNA [Fig. 3b]. Addition of ConA also resulted in the appearance of a new emission peak, indicating that [Ru(bpy)2(bpy-2Gal)] also binds to ConA under the conditions examined, although the intensity is weaker than that observed for PNA. These results suggest that [Ru(bpy-2Gal)3] has higher binding specificity to PNA compared to [Ru(bpy)2(bpy-2Gal)]. The enhanced specificity of [Ru(bpy-2Gal)3] may result from the clustering of galactose. Similar emission spectral changes were observed for [Ru(bpy-2Glc)3] and [Ru(bpy)2(bpy-2Glc)] with ConA, with the local environment of [Ru(bpy-2Glc)3] and [Ru(bpy)2(bpy-2Glc)] becoming more hydrophobic compared to that when present alone in PBS buffer. These results are consistent with previous reports, demonstrating that galactose and glucose show high affinity for PNA and ConA, respectively. Fig. 3Fluorescence emission spectra of the metalloglycoclusters. (a) [Ru(bpy-2Gal)3] (100 μM in PBS), (b) [Ru(bpy)2(bpy-2Gal)] (300 μM in PBS), (c) [Ru(bpy)3] (100 μM in PBS) with lectin (20 μM) [PNA (pink), RCA (orange), ConA (green) or WGA (blue)] or without lectin (gray). (d) [Ru(bpy-2Gal)3] (20 μM) in PBS with 50% ethanol (black) and in PBS (gray). (Color online only.)  3.3.Specific Binding of Metalloglycoclusters to Lectins Evaluated by Fluorescence PolarizationFP analyses were performed to confirm the specific binding of [Ru(bpy-2Gal)3] or [Ru(bpy)2(bpy-2Gal)] to PNA. Polarization analysis allows for the direct investigation of molecular motion (namely, molecular size) in the absence of contributions derived from the environmental conditions that the metalloglycoclusters experience.7 Because emission intensities relate to chemical environments such as hydrophobicity and acidity, the simultaneous analyses of fluorescence intensity and polarization offer advantages when investigating the binding properties of biomolecules. Figure 4 shows the increased fluorescence polarization values when PNA, RCA, ConA, or WGA was added to each metalloglycocluster, and their repeatability was confirmed by continuous measurement under the same condition. Polarization values increased for both [Ru(bpy-2Gal)3] and [Ru(bpy)2(bpy-2Gal)] following the addition of PNA, unlike the case with [Ru(bpy)3], which showed little change in the polarization values. The small changes observed for [Ru(bpy)3] indicate that the electrostatic interaction between lectin and metalloglycocluster, which possess divalent positive charges, is negligible. Therefore, the marked increase in FP values confirms the high affinity of both [Ru(bpy-2Gal)3] and [Ru(bpy)2(bpy-2Gal)] for PNA. The ΔFP values of [Ru(bpy-2Gal)3] and [Ru(bpy)2(bpy-2Gal)] were negligible following the addition of RCA, although some previous reports show that RCA also has high affinity for galactose. These results suggest two possibilities: (i) the metalloglycocluster is not bound to RCA under the conditions examined due to steric hindrance or a linker length-related factor, which precludes binding to RCA, or (ii) the metalloglycocluster is bound to RCA, while the change is less marked than that observed with PNA. Molecular dynamics calculations are now underway in an effort to investigate these possibilities. Fig. 4Changes in fluorescence polarization of the metalloglycoclusters. (a) [Ru(bpy-2Gal)3] (100 μM), (b) [Ru(bpy)2(bpy-2Gal)] (300 μM), and (c) [Ru(bpy)3] (100 μM) with lectin (20 μM) [PNA (pink), RCA (orange), ConA (green) or WGA (blue)] or without lectin (gray). (Color online only.)  In the case with [Ru(bpy-2Glc)3] and [Ru(bpy)2(bpy-2Glc)], FP values increased following the addition of ConA, unlike the case with PNA, RCA, and WGA. The distinctive increment of the FP value with ConA suggests specific high affinity of glucose to ConA. 3.4.Calculation of Dissociation Constants for Binding of Metalloglycoclusters to Lectins Using FE and FPEmission spectra were collected using varied PNA concentration to examine, in detail, the binding properties associated with the binding of metalloglycoclusters to PNA. Figure 5a shows the emission intensity (at 580 nm) of [Ru(bpy-2Gal)3], [Ru(bpy)2(bpy-2Gal)], and [Ru(bpy)3] plotted against the concentration of the galactose-binding site on PNA. For [Ru(bpy-2Gal)3], emission intensities increased with increasing PNA concentration and plateaued at 60–80 μM. Multivalent binding is possible between [Ru(bpy-2Gal)3] and PNA because both [Ru(bpy-2Gal)3] and PNA have multiple binding sites, respectively. In this report, the dissociation constant (K d) was estimated under the assumption that the binding event occurs with a 1:1 mode in the examined concentration range and each galactose binding site on PNA works independently. The assumption was supported by the following two reasons. First, distance between two galactose parts of [Ru(bpy-2Gal)3] is too short to reach two different binding sites on a tetrameric PNA. Second, concentration of [Ru(bpy-2Gal)3] used in the evaluation study is low enough to produce aggregates formed by cross-linking [Ru(bpy-2Gal)3] between different PNA. From nonlinear least-squares fitting, the K d associated with the binding of [Ru(bpy-2Gal)3] to PNA was estimated to be 4.5 × 10⁻⁶ M. Although [Ru(bpy)2(bpy-2Gal)] exhibited similar intensity changes with increasing PNA concentration, no plateau was observed within the PNA concentration range of 0–80 μM. Because a higher concentration was necessary to reach the plateau, the affinity of [Ru(bpy)2(bpy-2Gal)] for PNA (K d ≈ 10−4 M) is lower than that of [Ru(bpy-2Gal)3]. This suggests that the metalloglycocluster with highly clustered galactose possesses enhanced affinity for PNA. Figure 5b shows the polarization value of [Ru(bpy-2Gal)3], [Ru(bpy)2(bpy-2Gal)], and [Ru(bpy)3] plotted against the concentration of the PNA binding site. Following the same method with the emission intensity (FE), the K d was estimated from the concentration-dependent FP values. The K d for the binding of [Ru(bpy-2Gal)3] to PNA was 2.9 × 10⁻⁵ M, while the affinity of [Ru(bpy)2(bpy-2Gal)] for PNA (K d ≈ 10−4 M) was lower than that of [Ru(bpy-2Gal)3]. In a same manner, the K d for the metalloglycocluster having glucose was estimated. The K d for the binding of [Ru(bpy-2Glc)3] to ConA was 1.8 × 10⁻⁵ M, and [Ru(bpy)2(bpy-2Glc)] to ConA was ≈10−4 M. These results of the affinity evaluation from both FE and FP measurements confirmed that the metalloglycocluster with highly clustered carbohydrates have increased affinity for the lectins compared to the metalloglycocluster with less clustered carbohydrates. Fig. 5Changes in fluorescence (a) emission intensity and (b) polarization of the metalloglycoclusters [Ru(bpy-2Gal)3] (20 μM, circle), [Ru(bpy)2(bpy-2Gal)] (60 μM, triangle), and [Ru(bpy)3] (20 μM, diamond) following addition of PNA (concentration of the binding site: 0, 10, 20, 30, 40, 60, 80 μM). The gray line represents a fitted curve obtained from nonlinear least-squares fitting. 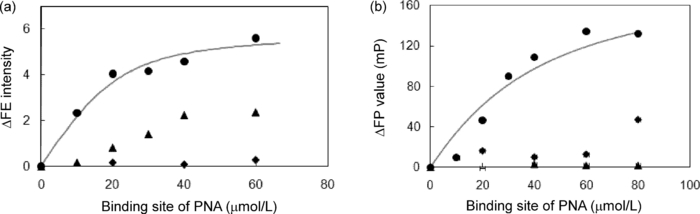 3.5.Specific Binding of Metalloglycoclusters to Tetanus Toxin c-FragmentAffinity of the metalloglycoclusters [Ru(bpy-2Gal)3] and [Ru(bpy-2Glc)3] (2 μM) for the TCF (0.05 μM) was examined by the FP measurement (Fig. 6). TCF reportedly possesses affinity for galactose.8, 9 On addition of TCF to [Ru(bpy-2Gal)3], the polarization value increased by ca. 8 mP; however, an increase of only ca. 0.5 mP was observed on addition of TCF to [Ru(bpy-2Glc)3]. This distinctive increase in FP value associated with [Ru(bpy-2Gal)3] confirms specific binding of galactose to TCF. 4.ConclusionsThe fluorescence emission and polarization analyses demonstrated the high affinity of the synthesized novel metalloglycoclusters [Ru(bpy-2Gal)3] and [Ru(bpy-2Glc)3] for PNA and ConA, respectively. The results of both FE and FP analyses in this report confirmed that the fluorescent metalloglycoclusters are applicable to evaluate affinity properties associated with the binding of carbohydrates to lectins. [Ru(bpy-2Gal)3] and [Ru(bpy-2Glc)3], possessing highly clustered galactose and glucose, respectively, were shown to possess increased affinity for the lectins when compared to the less clustered metalloglycoclusters, [Ru(bpy)2(bpy-2Gal)] and [Ru(bpy)2(bpy-2Glc)]. Moreover, specific binding of [Ru(bpy-2Gal)3] to TCF was confirmed by the FP analysis as demonstrating the potential of the metalloglycocluster for evaluating weak biomolecular interactions leading serious disease. ReferencesC. Bertozzi and
L. Kiessling,
“Chemical glycobiology,”
Science, 291 2357
–2364
(2001). https://doi.org/10.1126/science.1059820 Google Scholar
T. Hasegawa, T. Yonemura, K. Matsuura, and
K. Kobayashi,
“Artificial metalloglycoclusters: compact saccharide shell to induce high lectin affinity as well as strong luminescence,”
Bioconjugate Chem., 14 728
–737
(2003). https://doi.org/10.1021/bc020026a Google Scholar
R. Kikkeri, I. García-Rubio, and
P.-H. Seeberger,
“Ru(II)–carbohydrate dendrimers as photo-induced electron transfer lectin biosensors,”
Chem. Commun., 125 235
–237
(2009). https://doi.org/10.1039/b814146k Google Scholar
M. Gottschaldt and
U. Schubert,
“Prospects of metal complexes peripherally substituted with sugars in biomedicinal applications,”
Chem. Eur. J., 15 1548
–1557
(2009). https://doi.org/10.1002/chem.200802013 Google Scholar
S. Sakai, Y. Shigemasa, and
T. Sasaki,
“Iron(II)-assisted assembly of trivalent GalNAc clusters and their interactions with GalNAc-specific lectins,”
Bull. Chem. Soc. Jpn., 72 1313
–1319
(1999). https://doi.org/10.1246/bcsj.72.1313 Google Scholar
M. Gottschaldt, D. Koth, D. Müller, I. Klette, S. Rau, H. Görls, B. Schäfer, R. P. Baum, and
S. Yano,
“Synthesis and structure of novel sugar-substituted bipyridine complexes of rhenium and 99m-technetium,”
Chem. Eur. J., 13 10273
–10280
(2007). Google Scholar
R. Jelinek and
S. Kolusheva,
“Carbohydrate biosensors,”
Chem. Rev., 104 5987
–6015
(2004). https://doi.org/10.1021/cr0300284 Google Scholar
P. Emsley, C. Fotinou, I. Black, N. Fairweather, I. Charles, C. Watts, E. Hewitt, and
N. Isaacs,
“The structures of the tetanus toxin c-fragment with carbohydrate subunit complexes provide insight into ganglioside binding,”
J. Biol. Chem., 275 8889
–8894
(2000). https://doi.org/10.1074/jbc.275.12.8889 Google Scholar
A. Singh, S. Harrison, and
J. Schoeniger,
“Gangliosides as receptors for biological toxins: Development of sensitive fluoroimmunoassays using ganglioside-bearing liposomes,”
Anal. Chem., 72 6019
–6024
(2000). https://doi.org/10.1021/ac000846l Google Scholar
|


