|
|
1.IntroductionPhotodynamic therapy (PDT) is a well-established method for the treatment of age-related macular degeneration (AMD) and various kinds of light-accessible tumors.1, 2 It relies on the use of light, a light-sensitive dye molecule, and molecular, oxygen present in the tissue. 3, 4, 5, 6, 7, 8, 9, 10, 11, 12, 13, 14 The mechanisms responsible for tissue destruction by PDT involve highly reactive singlet oxygen [1O2(1Δg)], or oxygen radical species generated by the photoexcited dye molecule also called the photosensitizer (PS). These oxygen species oxidize the biological substrate, thus inducing photodamage which can lead to direct cell death and/or blood vessel occlusion.7, 15, 16 The efficiency of this process depends, among others, on the concentration of tissular oxygen. Excitation of the PS to the lowest excited singlet state, which can, in some molecules, undergo intersystem crossing to the PS's triplet state, may be followed by phosphorescence of this triplet state. This phosphorescence may, in turn, be quenched by the tissue oxygen, allowing for an indirect measurement of the dissolved molecular oxygen concentration using the Stern–Volmer equation 1. The latter relates this tissular oxygen concentration [O2] to the photosensitizer's triplet state phosphorescence intensity I and its lifetime τ as follows: Eq. 1[TeX:] \documentclass[12pt]{minimal}\begin{document} \begin{equation} I_{0}/I=\tau _{0}/\tau =1+k_{q}\tau _{0}[\mbox{O}_{2}] \end{equation} \end{document}Measuring the oxygen concentration [O2] — usually expressed as its partial pressure pO2 — at the actual location where the PS is applied for PDT, can help to determine and optimize the therapeutic light dose, if knowledge is available on several other PDT parameters.9 Indeed, differences in the oxygen consumption rate, as well as differences between the initial oxygen concentration in normal and neoplastic tissues, are likely to be responsible for over- or under-treatment of the targeted tissues. In any case, the oxygen concentration in the tissue and its diffusion toward the PDT-treated zone will influence the therapeutic efficacy. Furthermore, it is known that certain regions of larger tumors can become hypoxic, which may negatively affect the efficacy of PDT or radiotherapy.17, 18, 19, 20, 21, 22 More generally, measurement of the pO2 can, in principle, provide valuable information for the early diagnosis of various diseases. Among others, this may be the case for exsudative AMD, as well as vascular occlusive diseases, diabetic retinopathy, and possibly even glaucoma.23, 24, 25 Such diseases are very likely associated with changes of the microvasculature due to decreased cellular oxygen concentrations.26, 27, 28 Various kinds of oxygen-sensitive phosphorescent molecules have been proposed to monitor pO2.29, 30, 31 However only a few among them can be exploited as PSs and none of these oxygen sensing molecules have been approved for use in humans. Unfortunately, most PSs — including PpIX, which is commonly used for PDT treatment of oncologic conditions — do not present a phophorescence that is easily detectable in vivo, because either the phosphorescence quantum yield is too low and/or because this luminescence takes place at wavelengths too long to be easily detected.29, 30, 31, 32 PpIX's triplet state de-excitation has been measured at low temperature (77° K) in a solid octane matrix,33 showing a phosphorescence peak at around 792 nm, a quantum yield of 6 × 10⁻³, and a lifetime of 11 ms, with a nonradiative T1-S0 decay probability about twice as large as the radiative one. More recently, phosphorescence lifetimes of HpD and PpIX were measured at room temperature at 894 nm — but in lipophilic milieux.34 In a biological milieu at about 37° C, the nonradiative decay pathways are even more favored than at low temperature in nonpolar matrixes. Thus, measuring PpIX's phosphorescence under experimental conditions compatible with a clinical environment would be very difficult indeed.35, 36 This difficulty can be overcome by measuring the delayed fluorescence lifetime instead of the PS's phosphorescence lifetime.12, 37, 38 This idea underlies the work described in the present paper. The “delayed fluorescence” (DF) phenomenon is schematically represented in the Jablonski diagram of Fig. 1. The electronic ground state of the PS is a singlet state (S 0). Upon light absorption, (1) the PS is excited to a short-lived, vibrationally excited, first excited singlet state which rapidly vibrationally relaxes to its ground state S 1. The overall lifetime of S 1 in cuvette conditions is about 15 ns for PpIX in aqueous solution,39 and ≈7 ns in vivo 40, 41. The PS can return to the S 0 state by fluorescing (2) or by internal conversion (3). Alternatively, S 1 can undergo “spin-forbidden” intersystem crossing (ISC) to the triplet state T 1, (4). This fairly long-lived T 1 state, whose lifetime is in the μs-to-ms range for PpIX, may return directly to the ground state by phosphorescence (5) or through a nonradiative path (6). Some molecules in the T 1 state may, however, have sufficient thermal energy to undergo reverse ISC, from a vibrational excited level of T 1 to the S 1 singlet state (7), after which they may return to the ground state, through what is now delayed fluorescence (2′): i.e., the PS returns to the ground state by emitting photons of essentially the same spectral distribution as normal “prompt” fluorescence. However, this DF generally has a much weaker intensity than the prompt fluorescence and its lifetime is similar to that of phosphorescence. This is why delayed fluorescence might sometimes be taken for phosphorescence.42 In the presence of molecular oxygen, near-resonant collisional energy transfer (8) between the T 1 state of PpIX and the T 0 ground state (3Σ) of molecular O2 takes place, leading to (9) the excitation of O2 (3Σ) to its S 1 singlet excited state O2(1Δ1)43, 44 and simultaneously the return of PpIX to its ground S 0 state. One advantage of using this approach for the in vivo measurement of tissular pO2 is that no exogenous molecular probe needs to be administered in addition to the photosensitizer that is administered to treat a lesion. In the case of PpIX, an additional benefit arises from the fact that it becomes possible, through the PS's quenched triplet state, to measure pO2 at the very locations where the PS is acting (see Sec. 3.2). In this paper, we report on the design, characterization (in terms of excitation source, spectral and temporal resolution, and sensitivity), and calibration, of a sensitive, time-resolved, optical-fiber-based spectrofluorometer, which can be used for both in vitro and in vivo detection of delayed fluorescence. The setup must be able to detect the very weak DF signals emitted by most PS's, and allow (in the case of in vivo PDT), for using an optical fiber to probe tissues which would be difficult to access otherwise, for instance in the hollow organs. 2.Materials and MethodsOne specific problem of this oxygen measurement approach is that prompt (normal) fluorescence (PF) and DF have essentially the same spectroscopies. In addition, the system must be usable for in vivo measurements. An optimal and practical design of the measurement setup must therefore address three main problems:
The first and third concerns are dealt with and discussed under Sec. 2.1 hereunder while Sec. 2.2 deals with the second problem. We also discuss the mathematical processing of the acquired data in Sec. 2.3. Validation of the sensitivity of the measurements, and their calibration, including the setup's spectral and temporal resolution, are dealt with in Secs. 2.4, 2.5, respectively. 2.1.General Design and OpticsA schematic representation of the apparatus is shown in Fig. 2. The excitation light pulses at 405 nm are provided by a dye laser (1) (LTB model UDL-200), pumped by a pulsed N2 laser (LTB model MSG 803-TD). The laser beam enters the main, light-tight, blackened experimental enclosure (2) through a small hole and then passes through an iris diaphragm (3′) which blocks most of the spontaneous emission of the dye cell. The beam passes through a small channel drilled in the parabolic mirror (4) (Edmund Optics NT47-103, 90° off-axis, aluminium coated, effective focal length (EFL) = 50.8 mm), while being focused with a low luminescence plano-convex lens (3) (Edmund Optics NT47-276, [TeX:] \documentclass[12pt]{minimal}\begin{document}$\varnothing$\end{document} 20 mm, EFL = 150 mm) onto the tip (5) of a multimode optical fiber (6) (Laser Components HCG-M0550T, core diameter = 550 μm, NA = 0.22). For in vitro experiments, a quartz cuvette (Hellma, 174-QS) is held inside the apparatus at the irradiation location (5), using a thermostable cuvette holder (6′), see Fig. 3. The plano-convex lens (3) is mounted on a 5-degrees-of-freedom holder, allowing for easy focusing of the laser beam on a pre-defined point, (5). The luminescence emitted from the irradiated sample is collected by the far-end of the optical fiber (6) and returned to the enclosure, where a large fraction (probably more than 80%) of this light falls on the parabolic metal mirror (4) and is reflected and focused by it on a gatable photomultiplier (PMT) (7) (Hamamatsu R955). The reflected laser light and unwanted optical background noise are filtered out by a bandpass filter (Chroma HQ645/75) in the filter wheel (8). The PpIX DF signal is recorded with a digital storage oscilloscope (DSO) (Lecroy LT342), connected to a PC (9). Note that a signal delay generator (10) (Stanford Research Systems, DG535) is used to synchronize the gating of the PMT with the laser pulses and to trigger the DSO with the DF signals. Fig. 2Optical design and overall geometry of the spectrofluorometer. (1) dye laser; (2) metal-and-wood experimental enclosure, x = 430 mm, y = 230 mm, height = 250 mm; (3′) diaphragm; (3) lens, F = 150 mm; (4) parabolic mirror with cylindrical hole; (5) irradiation location; (6) optical fiber; (6′) thermostable cell holder; (7) gatable photomultiplier; (8) rotatable optical filters holder; (9) digital storage oscilloscope and PC; (10) signal delay generator.  Fig. 3Thermostatable quartz cell holder with dual, water-heated side-blocks. Cast aluminum, x = 55 mm, y = 32 mm, z = 45 mm.  The present optical design, based on the use of a parabolic mirror, presents some advantages as compared to standard configurations for optical-fiber-based spectrometers. These include: i. the absence of spectral distortions due to the fact that no refraction — but only reflections — take place in this part of the optical setup; ii. no autoluminescence is induced in this optical element which, due to its metallic nature, does not interact with the excitation pulse; iii. the solid angle of acceptance of the parabolic mirror (≈0.6 sr) is larger than the entrance solid angle of the optical fiber (≈0.15 sr), which leads to a high light recovery fraction; iv. the mirror's parabolic shape eliminates the need of an additional lens to focus the luminescence emitted by the fiber tip (or the quartz cuvette) on the detector. This is because the detector's window is conveniently located at the imaging point of this mirror. Note: the setup is designed for a 1:1 magnification. The fiber-based measurement mode is well suited for in vivo studies, where the light must be delivered to tissue, outside of the setup's light-tight enclosure. When measuring a sample in the thermostable quartz cell (6′), placed at the focal point of the laser beam (5), again a sizable fraction of the luminescence from the liquid sample falls on the parabolic mirror. The measurements in that case are thus completed inside the light-tight enclosure (2). This leads to higher sensitivity and less background noise. In addition, it is possible, if desired, to control the temperature, the humidity, and gas composition in the enclosure. 2.2.Delayed and Prompt Fluorescence Discrimination: Detectors and ElectronicsAs the whole setup is constructed in a light-tight enclosure, undesired light is eliminated. The time-resolved detection of the weak DF signal nevertheless requires gating to avoid saturation of the detector by the much stronger PF signal. To achieve this, the photomultiplier tube can be electrically switched on, about 3 μs after the laser pulse. During this time, the intensity of any PF decreases to the noise level. Because the intensity of the PF is at least 2 orders of magnitude stronger than that of the DF, and because the photons of the PF hit the inactive photocathode during the ≈3 μs offset-time, fast recovery of the high gain as well as proper correction for PMT artifacts are required. For these reasons, we used an R955 Hamamatsu PMT with a broad wavelength response (185 to 900 nm), low noise, and high gain. A gated D-type socket assembly (Hamamatsu C1392 series) was used together with this PMT. The PMT is “gated” by holding the photocathode at a potential of about +10 V with respect to the first dynode. The gate function is driven by an external user-triggered TTL pulse. In this way, the PMT is blinded during the laser excitation and prompt fluorescence emission. The signal delay generator (10, Fig. 2) thus turns the PMT off, about 5 μs before triggering the laser pulse, for about 8 μs. The rise time for the gating is typically 400 ns (see Fig. 4). 2.3.Data Acquisition and AnalysisThe DF signal is transformed by the PMT into an analog electrical signal which is supplied to the DSO for averaging. The analog signal from about 30 transients is digitized in 24-bits floating point values and transferred to the PC for further analysis. The parameters describing the luminescence decay are obtained by fitting the time-dependent digitized signal f(t) with a sum of exponential functions: Eq. 2[TeX:] \documentclass[12pt]{minimal}\begin{document} \begin{equation} f(t) = \sum _{i=1}^{n} A_{i} \, exp^{(t / \tau _{i})} \end{equation} \end{document}The set of exponential lifetimes (τi) characterizes the PS molecule and its physical environment. Each pre-exponential factor A i is proportional to the intensity of the i'th component to the total luminescence intensity. The Levenberg–Marquardt (L–M) method is used for non-linear least-squares fit of the measured data.45, 46, 47, 48, 49 We wrote and used an Octave [GNU GPL] L–M algorithm implementation. The calculated mathematical fits were graphically checked by plotting the residuals of each fit and the autocorrelation of the residuals,50, 51 as shown, e.g., in Fig. 5. 2.4.Setup Calibration and System SensitivityWe have validated and calibrated the setup through luminescence measurements on well-characterized molecules. The luminescence lifetime of reference samples depends on the fluorochrome's environment, on small changes in the molecular structure, on the presence of quenchers, and on temperature. For these reasons, we have chosen two different crystalline lanthanide(III) complexes whose properties and behaviors were known to be stable in the chosen environments. The first reference compound was a powdered samarium complex: [SmIII -(hfa)3(4-cypNO)]2 (hfa− = hexafluoroacetylacetonate; 4-cpyNO = 4-cyanopyridine N-oxide).52 This sample was used to verify the validity of our measurements close to the temporal resolution limit of our system (≈0.7μs, see Sec. 2.5). When the luminescence of this powder was measured with our setup, we observed a signal with a mono-exponential lifetime of 1.27 ± 0.09 μs. This compares well with the literature value of 1.13 ± 0.05 μs.53 The second reference compound was a 2:3 stoichiometric solution of an europium complex [EuIII-:H2LC2] in water/glycerol (9/1, v/v) (H2LC2: homoditopic ligand 6.6′ — for very long luminescence lifetimes) whose lifetime is expected to be in the milliseconds range. With a fiber-to-quartz-cell distance of 100 μm, we measured a mono exponential decay with a lifetime of 2275 ± 127 μs, as compared to the published value of 2200 ± 100 μs.53 The small differences of <10% resp. <5% observed between our measurements and those made by Chauvin et al are compatible with the stated error limits. They might be explained by small differences in i. the sample excitation wavelengths: 355 nm versus 405 nm, and ii. the actual physical environments of the lanthanide complexes. The sensitivity of the system was determined by measuring the time-resolved luminescence decay of solutions of PpIX in dimethyl sulfoxide (DMSO) and of Pd-meso-tetra(4-carboxyphenyl)-porphyrin (PdTCPP) in phosphate buffered saline (PBS). PpIX is a frequently used photosensitizer and presents a delayed fluorescence,54, 55, 56 while PdTCPP is a commonly used oxygen sensor for in vivo measurements.29, 31, 32, 49, 57 Luminescence decays were thus measured at decreasing concentrations ranging between 10−4 and 10−7 M, within 1 h of sample preparation. The sensitivity limit was then determined for the lowest photosensitizer concentration, still yielding measurements with a signal-to-noise ratio (SNR) allowing for the retrieval of accurate lifetimes. The latter is defined here as the standard deviation on the measured lifetime being <10%. The SNR was expressed as the ratio of the signal to the rms noise level. Table 1 shows the calculated SNR at the different concentrations. The sensitivity of the system is therefore sufficient to measure the weak delayed fluorescence of PpIX in typical in vivo conditions where its concentration might be on the order of 1 × 10⁻⁵ M. Table 1Setup sensitivity assessment with λex = 405 nm, and λem = 645 ± 75 nm FWHM.
After these preliminary validating results, we compared the radiant DF energy of PpIX, which is proportional to the area under the recorded signal — and therefore to the totality of detected DF photons — to its total luminescence. The ratio of these energies yields an estimate of the DF's detectability. The DF signal was recorded and measured as already described. The signal of the total luminescence (proportional to the sum of all molecule's emissive de-excitation) was measured by i. adding neutral density (OD 3.9) filters between the parabolic mirror and the PMT, and ii. recording the luminescence emitted by the PpIX sample from the beginning of the laser excitation pulse. The ratio of the total PpIX's luminescence to its DF was found to be 145:1 for in vitro measurements performed on a DMSO solution at pH = 7.2, and 300:1 for in vivo measurements performed on a chorio-allantoic membrance (CAM) membrane topically treated with 5-aminolevulinic acid (ALA), a precursor of PpIX. The values obtained are in reasonable agreement with the estimates given in the literature. Indeed, Mauzerall and Feitelson determined that this ratio is equal to about 40 for a similar porphyrin measured in an oxygen-free environment.58 2.5.Setup Temporal ResolutionThe two devices that limit the temporal resolution of the setup are the PMT and the current-to-voltage converter circuit connected in series between the PMT and the DSO. The loss of temporal resolution due to the PMT can be approximated by the sum of the anode pulse rise time and the electron transit time spread ≈2.2 ns + 1.2 ns, for a total of ≈3.5 ns, which is negligible with respect to the contribution made by the current-to-voltage circuit. The latter is characterized by an RC response time. A load resistance value of R load = 500 Ω was chosen in order to have a comfortable signal intensity during in vivo measurements. With the help of a very short light pulse (the nearly delta excitation laser pulse: ≈300 to 400 ps) and with two different load resistances, the parasite capacitance of the circuit was measured to be 145 pF. The characteristic temporal response of the setup is therefore set to be R load × C = 72 ns, which is the setup's temporal resolution. This response time of ≈72 ns is negligible if the measured signals have typical lifetimes larger than 10 μs, as is the case for the delayed-fluorescence lifetime of PpIX. 2.6.Background Optical NoiseTo generate a well-defined maximum optical background noise, we placed a nonfluorescing white reflecting coated plate (SphereOptics, White Reflecting Coating, reflection >98% of incident light) perpendicular to and in contact with the end of the optical fiber, and recorded the signal generated by this diffusely reflected light. The aim was to evaluate if this maximum optical background noise could still be considered as negligible when compared to the weak DF signal expected from an in vivo measurement of the PpIX's DF. The backscattered signal was recorded after a delay of 3 μs from the excitation and averaged over 30 sweeps. An appreciable optical background signal, probably due to both the parasitic luminescence of the optical fiber itself and the SphereOptics plate, plus the luminescence of the bandpass filter located in front of the PMT, was observed. The intensity of this background noise was in the worst case 1 order of magnitude smaller than the expected experimental signal. The background noise created by the reflection of the laser excitation on the sample can therefore be neglected. 3.Results and Discussion3.1.Examples of in vitro Lifetime MeasurementsThe luminescence lifetime of two porphyrins, PdTCPP and PpIX, in aqueous (PBS) and DMSO solutions, respectively, were carefully characterized in vitro to confirm that the sensitivity of the setup would allow to observe luminescence lifetime changes due to variations in O2 quencher concentration. By bubbling during 30 min different, well-defined, oxygen–nitrogen gas mixtures, the O2 dissolved in the porphyrin solutions was changed. All measurements were carried out at room temperature (22°) and the solutions were freshly prepared (within 1 h from the measurement) and stored in quartz cuvettes. As a validation measurement, the lifetimes of a PdTCPP solution in PBS (83 μM, pH = 7.4) were measured, by the analysis of the averaged luminescence decay signal over 30 sweeps at five different pO2 (See Fig. 6). An excellent linear Stern–Volmer relationship was verified and good agreement was found between our measurement at pO2 = 0 and the values reported in the literature for oxygen-free PdTCPP solutions. No attempt was made to compare published lifetimes at other O2 concentrations as the strong dependency of Henry's coefficients on temperature and exact solvent nature cannot be easily corrected for (see Table 2).59, 60, 61 Fig. 6Verification of the Stern–Volmer equation (τ0 = 0.358 ms, [TeX:] \documentclass[12pt]{minimal}\begin{document}$k_{q} = 2.04 \, (\rm mm\,Hg \; ms)^{-1}$\end{document} ) for a solution of PdtCPP in PBS (83 μM, pH = 7.4) 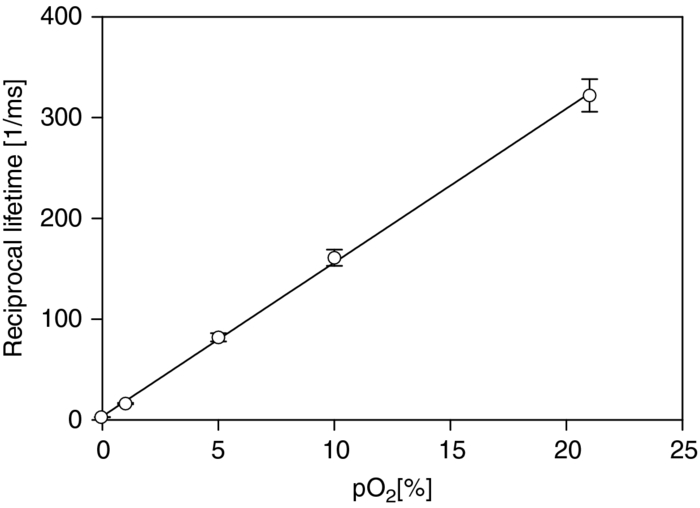 Table 2PdTCPP phosphorescence quenching by oxygen: Lifetime measurements of an 83 μM solution of PdTCCP in PBS at room temperature, pH 7.4, at different pO2 values. Standard atmospheric pressure is 760 mm Hg but in our lab, the standard is 740 mm Hg due to elevation.
There are few in vitro PpIX's delayed fluorescence lifetime measurements in the literature and they are not directly comparable, due to the sensitivity of PpIX's DF lifetime to pH, temperature, concentration of the solution, and quencher concentration.54, 62, 63, 64, 65 Therefore, a direct comparative study could not be performed for this molecule. A PpIX solution in DMSO (1.6 μM, pH=7.2) was prepared and stored in a quartz cuvette as described before. The measurements reported in Table 3 allow us to confirm the possibility (in vitro) of measuring changesin PpIX's lifetime ascribable to changes in the O2 concentration. Our measurement at pO2 = 0 is compared here with the one published by Mik 56 and found to be in reasonable agreement with it. Table 3Influence of variations in pO2 on PpIX's DF lifetime: Luminescence lifetime measurements of a 1.6 μM solution of PpIX in DMSO at room temperature, pH = 7.2, at different pO2 values.
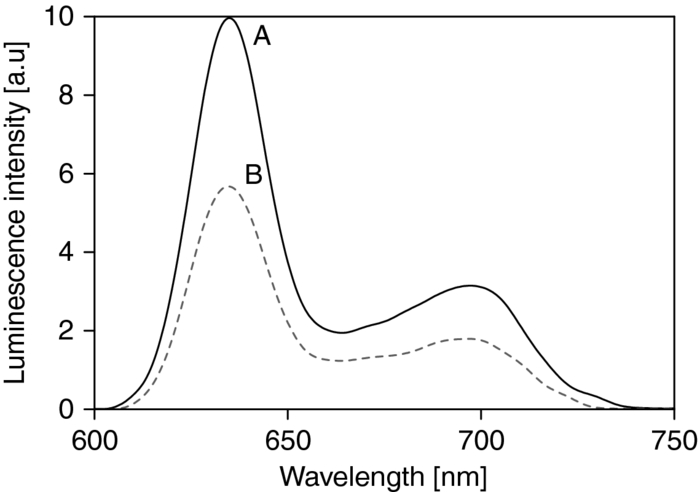
The same PpIX solution was measured (after 3 h of pure N2 bubbling) with a commercial (Perkin Elmer LS 50B) time-resolved spectrofluorometer to compare the spectrum of the measured luminescence with that of the prompt fluorescence. This allowed us to confirm that the luminescence measured was really the delayed fluorescence, as it exhibited the same spectroscopy as that of the prompt fluorescence, but displayed lifetimes characteristic of the triplet state (see Fig. 7). 3.2.Examples of in vivo MeasurementsWhen using PpIX as a PS, the usual approach consists in administering to the patient a precursor of the drug. The most commonly used precursor molecules are ALA or certain of its esterified derivatives.66, 67, 68 The biosynthetic pathway involves the combination of two ALA molecules to form a pyrrole unit, and four of these are finally combined to form one PpIX moiety, which itself is a part of haemoglobin.69, 70 Because of the enzymatic activity in diseased or cancerous tissues, the production of PpIX is locally and selectively strongly enhanced, as compared to the surrounding normal tissue.71, 72, 73 Our setup must allow, in this case, to measure through the PpIX's delayed fluorescence, the pO2 at any location where the PS is being formed. We report three examples of in vivo delayed fluorescence measurements, performed on the chick CAM model. Fifteen fertilized eggs underwent routine handling in order to obtain healthy developing CAMs until day 10.74, 75, 76 Four hours before the measurements and after removal of the upper part of the shell, as described by Lange,76 the chick embryos where topically administered a droplet of ALA solution (20 μl, 152 mM ALA–H2O solution, adjusted to pH 6.0, corresponding to 40 mg/kg). As described in Sec. 1, the DF lifetime is related to the concentration of molecular O2 which acts as a quencher in this case. It should be noted that the oxygen concentration in the CAM is also influenced by molecular O2 diffusing from the atmosphere. In order to significantly reduce this O2 in-flow and make the CAM's tissular [O2] decrease measurable, just before start of irradiation, we placed an impermeable barrier on the CAM: the region to be measured was covered by a round microscope cover glass ( [TeX:] \documentclass[12pt]{minimal}\begin{document}$\varnothing$\end{document} 20 mm, [TeX:] \documentclass[12pt]{minimal}\begin{document}$0.15\,\,\textrm{\rm to}\,\,0.19\,{\rm mm}$\end{document} thick, Schott D263M). The optical fiber probe was made to point toward the middle of the cover glass (≈100 μm from the surface, probed surface diameter [TeX:] \documentclass[12pt]{minimal}\begin{document}$\approx\! \varnothing$\end{document} 500 μm). The probing laser (405 nm) excites the PpIX molecules produced during the 4 h of incubation and the resulting luminescence was collected by the fiber tip and analyzed as described earlier. It was demonstrated that the probing laser pulses did not photodynamically or otherwise damage the CAM and did not significantly affect the tissular oxygen concentration if the total number of consecutive pulses was limited to 30. Therefore, for the following in vivo measurements, only 20 shots were averaged. The first in vivo experiment presented demonstrates the phenomenon of tissular oxygen consumption during laser irradiation, as monitored by measuring the PpIX's DF lifetime. Measurement of oxygen consumption was performed using the following experimental protocol: four series of 400 probing laser shots (at a pulse frequency of 10 Hz) were fired at the CAM sample, with a break of 1 min of darkness between each series. The DF measurements of the first 20 and the last 20 probing shots of each series were averaged, recorded, and compared. Using this experimental protocol, we observed an appreciable shift (toward longer values) in the PS's DF lifetime, between the first and the last group of 20 laser shots of any given series (400 shots in 40 s). The 60 s break between two consecutive series allows for (predominantly vascular) oxygen to rediffuse to the region of the probed spot, thereby restoring — at least partially — the tissular oxygen concentration, as confirmed by a shortening of the observed DF lifetime (see Fig. 8). Fig. 8PpIX's delayed fluorescence reciprocal lifetime change, as measured in CAM, showing PDT-induced tissular oxygen consumption and its regeneration during the treatment breaks. Results from 4 sequential series of 400 laser shots each (3.4 mJ/cm2 per pulse, spot diameter [TeX:] \documentclass[12pt]{minimal}\begin{document}$\varnothing 500\,{\rm \mu m}$\end{document} ), separated by 1 min breaks. To demonstrate oxygen consumption, the initial and final oxygen levels are deduced from the DF recovered from the first 20 and the last 20 laser shots of each series. Their respective, averaged, reciprocal DF lifetimes are shown. The four different symbols in the graph corresponds to the four consecutive laser shots series.  The second in vivo example illustrates the relation between the PS's DF lifetime and the concentration of oxygen in the atmosphere surrounding the CAM sample: A small gas chamber (see Fig. 9) was built for easily regulating the oxygen content in the atmosphere surrounding the sample. A small hole (A) in the top part of the chamber allowed for positioning the fiber tip at the CAM's surface, while two lateral inlets–outlets (B and C) allowed to flush it continuously with known N2/O2 gas mixtures. We used it to measure the DF lifetime of PpIX (endogenously produced by the CAM, following the ALA administration protocol described above) under different O2 atmosphere conditions. The CAM was introduced in the chamber and left for 3 min, in view of an approximate equilibration of O2 in the CAM itself, immersed in a homogeneous atmosphere of known, stable composition. The linear relation obtained with 12 different samples (see Fig. 9) satisfies the Stern–Volmer equation [see Eq. 1], confirming and validating these in vivo measurements. These results show noticeable dispersion, increasing with the applied oxygen concentration, leading to the increasing error bars at 5, 10, 15, and 21% O2 content, linked to intrasample and/or intersample variations, such as the actual vascular and micro-vascular density in the probed area. Fig. 9(a) Gas chamber to control the O2 concentration on the atmosphere surrounding the egg. (b) Relation between PpIX's DF reciprocal lifetime, measured on the CAM's surface, as a function of oxygen concentration in the controlled atmosphere gas chamber. 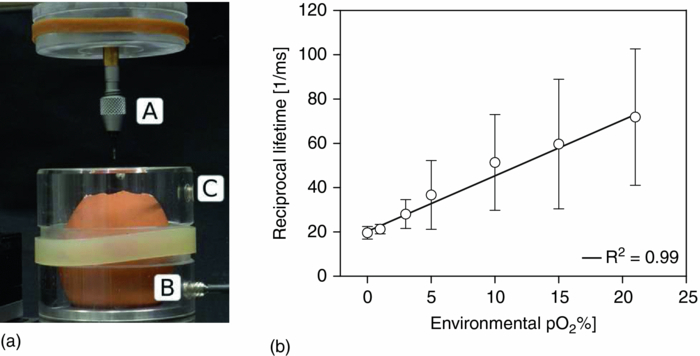 The third in vivo experiment was designed to evaluate the scale/importance of any intra-sample dispersion, when locally measuring the pO2. This experiment was conducted in the same way as the previous one, but the oxygen concentration was measured in eight different points of the same egg's CAM [see Fig. 10b]. The results showed sizable differences, increasing with the applied oxygen concentration, to be ascribed directly to local, intrasample, fluctuations (i.e., location-specific attributes which influence the measured pO2 value, such as the actual vascular density in the probed area), as shown by the large error bars at 15% and 21% O2 content [Fig. 10b]. As in the previous experiment, this dispersion increases in parallel to that of the pO2. It may originate in i. the increasing measurement errors when the lifetimes become shorter (at high pO2) and ii. in the fact that the amplitude of any pO2 variation, linked to the density of the vasculature, is directly proportional to the pO2 itself. Fig. 10Intra-sample fluctuations, measured by exciting the CAM of the same egg in eight different locations with different environmental oxygen concentration. (a) Measurement spots on the CAM. (b) The DF lifetime in the function of the amount of oxygen in the chamber's atmosphere in eight different locations of the same egg.  4.ConclusionsWe have designed, developed, and characterized a time-resolved optical fiber-based spectrofluorometer for the in vivo detection of the delayed fluorescence of photosensitizers with simultaneous spectral and temporal resolution. Our setup is designed in such a way that:
More generally, the technique presented in this report will help to understand the impact of oxygen on tissue sensitization. This is why, following this study, several well-accepted photosensitizers used in the clinic, exhibiting delayed fluorescence, are currently being investigated with our CAM model. Oxygen concentration measurements performed before, during, and after PDT are conducted on this model to demonstrate the feasibility of this approach and to optimize the treatment conditions. AcknowledgmentsThis work was supported by the Swiss National Science Foundation (Grant No. 205320-116556) and funded in part by the J. Jacobi Trust. ReferencesY. Monnier, P. Pasche, P. Monnier, and
S. Andrejevic-Blant,
“Second primary squamous cell carcinoma arising in cutaneous flap reconstructions of two head and neck cancer patients,”
Eur Arch Otorhinolaryngol, 265
(7), 831
–835
(2008). Google Scholar
P. Grosjean, G. Wagnieres, C. Fontolliet, H. van den Bergh, and
P. Monnier,
“Clinical photodynamic therapy for superficial cancer in the oesophagus and the bronchi: 514 nm compared with 630 nm light irradiation after sensitization with Photofrin II,”
Br. J. Cancer, 77
(11), 1989
–1995
(1998). Google Scholar
M. Triesscheijn, P. Baas, J. H. M. Schellens, and
F. A. Stewart,
“Photodynamic therapy in oncology,”
Oncologist, 11
(9), 1034
–1044
(2006). Google Scholar
A. P. Castano, T. N. Demidova, and
M. R. Hamblin,
“Mechanisms in photodynamic therapy: Part one photosensitizers, photochemistry and cellular localization,”
Photodiagnosis and Photodynamic Therapy, 1
(4), 279
–293
(2004). https://doi.org/10.1016/S1572-1000(05)00007-4 Google Scholar
R. Bonnett,
“Photodynamic therapy in historical perspective,”
Reviews in Contemporary Pharmacotherapy, 10 1
–18 1999). Google Scholar
Q. Peng, T. Warloe, K. Berg, J. Moan, M. Kongshaug, K. E. Giercksky, and
J. M. Nesland,
“5-Aminolevulinic acid-based photodynamic therapy. clinical research and future challenges,”
Cancer, 79
(12), 2282
–2308
(1997). Google Scholar
S. Pervaiz and
M. Olivo,
“Art and science of photodynamic therapy,”
Clini. Exp. Pharmacol. Physiol., 33 551
–556
(2006). Google Scholar
K. Plaetzer, B. Krammer, J. Berlanda, F. Berr, and
T. Kiesslich,
“Photophysics and photochemistry of photodynamic therapy: fundamental aspects,”
Lasers Med. Sci., 24
(2), 259
–268
(2009). Google Scholar
B. C. Wilson, M. S. Patterson, and
L. Lilge,
“Implicit and explicit dosimetry in photodynamic therapy: a new paradigm,”
Lasers Med. Sci., 12
(3), 182
–199
(1997). Google Scholar
P. K. Kaiser,
“Combination therapy with verteporfin and anti-VEGF agents in neovascular age-related macular degeneration: where do we stand,”
Br. J. Ophthalmol., 94
(2), 143
–145
(2010). Google Scholar
G. R. Kürzinger, B. Stender, G. K. Lang, and
G. E. Lang,
“Photodynamic therapy witverteporfin in occult choroidal neovascularization in age-related macular degeneration,”
Klin Monbl Augenheilkd, 131
(5), 541
–560
(2010). https://doi.org/10.1055/s-0028-1110015 Google Scholar
E. G. Mik, T. Johannes, C. J. Zuurbier, A. Heinen, J. H. P. M. Houben-Weerts, G. M. Balestra, J. Stap, J. F. Beek, and
C. Ince,
“In vivo mitochondrial oxygen tension measured by a delayed fluorescence lifetime technique,”
Biophys. J., 95
(8), 3977
–3990
(2008). Google Scholar
M. Geissbuehler, T. Spielmann, A. Formey, I. Märki, M. Leutenegger, B. Hinz, K. Johnsson, D. Van De Ville, and
T. Lasser,
“Triplet imaging of oxygen consumption during the contraction of a single smooth muscle cell (A7r5),”
Biophys. J., 98
(2), 339
–349
(2010). Google Scholar
H. Van den Bergh and
J.-P. Ballini,
“Photodynamic therapy: basic principles and mechanisms,”
Lasers in Ophthalmology Surgical and Diagnostic Aspects, 1
–23 Kugler, The Hague, The Netherlands
(2002). Google Scholar
L. Zhao, K. P. Nielsen, A. Juzeniene, P. Juzenas, V. Lani, L.-W. Ma, K. Stamnes, J. J. Stamnes, and
J. Moan,
“Spectroscopic measurements of photoinduced processes in human skin after topical application of the hexyl ester of 5-Aminolevulinic acid,”
J. Environ. Pathol. Toxicol. Oncol., 25
(2), 307
–320
(2006). Google Scholar
J. Moan and
P. Juzenas,
“Singlet oxygen in photosensitization,”
J. Environ. Pathol. Toxicol. Oncol., 25
(1–2), 29
–50
(2006). Google Scholar
F. Borle, A. Radu, P. Monnier, H. van den Bergh, and
G. Wagnières,
“Evaluation of the photosensitizer Tookad for photodynamic therapy on the Syrian golden hamster cheek pouch model: light dose, drug dose and drug-light interval effects,”
Photochem. Photobiol., 78
(4), 377
–383
(2003). Google Scholar
S. Piermarocchi, M. Sartore, G. Lo Giudice, G. Monterosso, E. Pilotto, and
T. Segato,
“Is there any relationship between photodynamic therapy for exudative age-related macular degeneration and choroidal neovascolarization recurrence? A rationale for combined treatments,”
Eur. J. Ophthalmol., 16
(5), 686
–694
(2006). Google Scholar
S. Szabo, M. Potter, and
T. Ho,
“Incidence of recurrence of choroidal neovascular membranes at 18 months after photodynamic therapy in patients with age-related macular degeneration,”
Invest. Ophthalmol. Vis. Sci., 46
(5), 300
(2005). Google Scholar
K. Cengel, E. Glatstein, and
S. Hahn, Intraperitoneal Photodynamic Therapy, Springer, New York
(2007). Google Scholar
B. C. Wilson and
M. S. Patterson,
“The physics, biophysics and technology of photodynamic therapy,”
Phys. Med. Biol., 53
(9), R61
–R109
(2008). Google Scholar
F. Krummenauer, M. Braun, and
H. B. Dick,
“Clinical outcome and subjective quality of life after photodynamic therapy in patients with age-related macular degeneration,”
Eur. J. Ophthalmol., 15
(1), 74
–80
(2005). Google Scholar
E. Stefánsson, R. Machemer, E. de Juan, B. W. McCuen, and
J. Peterson,
“Retinal oxygenation and laser treatment in patients with diabetic retinopathy,”
Am. J. Ophthalmol., 113
(1), 36
–38
(1992). Google Scholar
S. R. Chamot, S. D. Cranstoun, B. L. Petrig, C. J. Pournaras, and
C. E. Riva,
“Blood pO2 and blood flow at the optic disc,”
J. Biomed. Opt., 8
(1), 63
–69
(2003). Google Scholar
C. E. Riva,
“Noninvasive measurement of oxygen tension in the optic nerve head,”
Curr. Opin. Ophthalmol., 9
(2), 56
–60
(1998). Google Scholar
N. D. Wangsa-Wirawan and
R. A. Linsenmeier,
“Retinal oxygen: fundamental and clinical aspects,”
Arch. Ophthalmol., 121
(4), 547
–557
(2003). Google Scholar
M. Ito, K. Murayama, T. Deguchi, M. Takasu, T. Gil, M. Araie, G. Peyman, and
S. Yoneya,
“Oxygen saturation levels in the juxta-papillary retina in eyes with glaucoma,”
Exp. Eye. Res., 86
(3), 512
–518
(2008). Google Scholar
O. Arjamaa and
M. Nikinmaa,
“Oxygen-dependent diseases in the retina: role of hypoxia-inducible factors,”
Exp. Eye. Res., 83
(3), 473
–483
(2006). Google Scholar
R. D. Shonat, D. F. Wilson, C. E. Riva, and
M. Pawlowski,
“Oxygen distribution in the retinal and choroidal vessels of the cat as measured by a new phosphorescence imaging method,”
Appl. Opt., 31
(19), 3711
–3718
(1992). Google Scholar
S. A. Vinogradov, L. W. Lo, W. T. Jenkins, S. M. Evans, C. Koch, and
D. F. Wilson,
“Noninvasive imaging of the distribution in oxygen in tissue in vivo using near-infrared phosphors,”
Biophys. J., 70
(4), 1609
–1617
(1996). Google Scholar
W. L. Rumsey, J. M. Vanderkooi, and
D. F. Wilson,
“Imaging of phosphorescence: a novel method for measuring oxygen distribution in perfused tissue,”
Science, 241
(4873), 1649
–1651
(1988). Google Scholar
S. Blumenröder, A. J. Augustin, and
F. H. Koch,
“The influence of intraocular pressure and systemic oxygen tension on the intravascular pO2 of the pig retina as measured with phosphorescence imaging,”
Surv. Ophthalmol., 42 S118
–S126
(1997). Google Scholar
M. P. Tsvirko, K. N. Solovev, A. T. Gradyzshko, and
S. S. Dvornikov,
“Phosphorescence of porphyrin free base and their complexes with light metals,”
Opt. Spektrosk., 38 705
–713
(1975). Google Scholar
A. Molnàr, R. Dedic, A. Svoboda, and
J. Hála,
“Singlet oxygen production by lipophilic photosensitizers in liposomes studied by time and spectral resolved phosphorescence,”
J. Mol. Struct., 834–836 488
–491
(2007). Google Scholar
H. Sterenborg, J. de Wolf, M. Koning, B. Kruijt, A. Van Den Heuvel, and
D. J. Robinson,
“Phosphorescence-fluorescence ratio imaging for monitoring the oxygen status during photodynamic therapy,”
Opt. Express, 12
(9), 1873
–1878
(2004). Google Scholar
A. Molnar, R. Dedic, A. Svoboda, and
J. Hala,
“Singlet oxygen production by lipophilic photosensitizers in liposomes studied by time and spectral resolved phosphorescence,”
J. Mol. Struct., 834–836 488
–491
(2007). Google Scholar
W. Melhuish,
“Nomenclature, symbols, units and their usage in spectrochemical analysis — VI molecular luminescence spectroscopy,”
Spectrochim. Acta, 37
(3), 259
–272
(1982). Google Scholar
C. Ince and
E. G. Mik,
“Device and Method for Determining the Concentration of a Substance,”
(2007). Google Scholar
S. Kuszaj, P. Kaszycki, and
Z. Wasylewski,
“A fluorescence quenching study on protoporphyrin IX in a model membrane system,”
Chem. Phys. Lipids, 83
(2), 153
–160
(1996). Google Scholar
M. Kress, T. Meier, R. Steiner, F. Dolp, R. Erdmann, U. Ortmann, and
A. Rück,
“Time-resolved microspectrofluorometry and fluorescence lifetime imaging of photosensitizers using picosecond pulsed diode lasers in laser scanning microscopes,”
J. Biomed. Opt., 8
(1), 26
–32
(2003). Google Scholar
J. Russell, K. Diamond, T. Collins, H. Tiedje, J. Hayward, and
T. Farrell,
“Characterization of fluorescence lifetime of photofrin and delta-aminolevulinic acid induced protoporphyrin IX in living cells using single- and two-photon excitation,”
IEEE J. Sel. Top. in Quantum Electron., 14
(1), 158
–166
(2008). Google Scholar
C. A. Parker, Photoluminescence of Solutions, Elsevier, Amsterdam
(1968). Google Scholar
A. A. Krasnovsky,
“Primary mechanisms of photoactivation of molecular oxygen. History of development and the modern status of research,”
Biochemistry (Mosc.), 72
(10), 1065
–1080
(2007). Google Scholar
R. Schmidt,
“Photosensitized generation of singlet oxygen,”
Photochem. and Photobiol., 82
(5), 1161
–1177
(2007). Google Scholar
D. W. Marquardt,
“An algorithm for least-squares estimation of nonlinear parameters,”
J. Soc. Ind. Appl. Math., 11
(2), 431
–441
(1963). https://doi.org/10.1137/0111030 Google Scholar
J. Moré,
“The Levenberg-Marquardt algorithm: Implementation and theory,”
Numerical Analysis, 630 105
–116
(1978). https://doi.org/10.1007/BFb0067700 Google Scholar
E. G. Mik, C. Donkersloot, N. J. H. Raat, and
C. Ince,
“Excitation pulse deconvolution in luminescence lifetime analysis for oxygen measurements in vivo,”
Photochem. Photobiol., 76
(1), 12
–21
(2002). Google Scholar
T. Roth,
“Ruthenium(II) diimine complexes for luminescence-based oxygen sensors and Impedance spectroscopy of nitrogen dioxide- sensitive polymeric membranes,”
Swiss Federal Institute of Technology,
(1972). Google Scholar
T. K. Stepinac, S. R. Chamot, E. Rungger-Brändle, P. Ferrez, J.-L. Munoz, H. van den Bergh, C. E. Riva, C. J. Pournaras, and
G. A. Wagnières,
“Light-induced retinal vascular damage by Pd-porphyrin luminescent oxygen probes,”
Invest. Ophthalmol. Visual Sci., 46
(3), 956
–966
(2005). Google Scholar
G. E. P. Box, G. M. Jenkins, and
G. C. Reinsel, Time Series Analysis. Forecasting and Control, 746 John Wiley and Sons, Hoboken, NJ(2008). Google Scholar
A. Fassò,
“Residual autocorrelation distribution in the validation data set,”
J. Time Ser. Anal., 21
(2), 143
–153
(2000). Google Scholar
S. V. Eliseeva, M. Ryazanov, F. Gumy, S. I. Troyanov, L. S. Lepnev, J.-C. G. Bünzli, and
N. P. Kuzmina,
“Dimeric complexes of Lanthanide(III) hexafluoroacetylacetonates with 4-Cyanopyridine N-oxide: synthesis, crystal structure, magnetic and photoluminescent properties,”
Eur. J. Inorg. Chem., 2006
(23), 4809
–4820
(2006). Google Scholar
A.-S. Chauvin, S. Comby, B. Song, C. D. B. Vandevyver, and
J.-C. G. Bünzli,
“A versatile ditopic ligand system for sensitizing the luminescence of bimetallic lanthanide bio-imaging probes,”
Chemistry, 14
(6), 1726
–1739
(2008). Google Scholar
S. J. Chantrell, C. McAuliffe, A. R. Munn, and
A. W. C. Pratt,
“Luminescence from protoporphyrin IX dimethyl ester,”
J. Chem. Soc. Commun., 470
–471
(1975). https://doi.org/10.1039/C39750000470 Google Scholar
S. J. Chantrell,
“Excited states of protoporphyrin IX dimethyl ester reaction of the triplet with carotenoids,”
J. Chem. Soc., 76 417
–425
(1980). Google Scholar
E. G. Mik, J. Stap, M. Sinaasappel, J. F. Beek, J. A. Aten, T. G. van Leeuwen, and
C. Ince,
“Mitochondrial PO2 measured by delayed fluorescence of endogenous protoporphyrin IX,”
Nat. Methods, 3
(11), 939
–945
(2006). Google Scholar
J. M. Vanderkooi, G. Maniara, T. J. Green, and
D. F. Wilson,
“An optical method for measurement of dioxygen concentration based upon quenching of phosphorescence,”
J. Biol. Chem., 262
(12), 5476
–5482
(1987). Google Scholar
D. Mauzerall and
J. Feitelson,
“Reactions of triplet states of a porphyrin measured by delayed fluorescence,”
J. Phys. Chem., 86
(9), 1623
–1628
(1982). Google Scholar
S. A. Vinogradov and
D. F. Wilson,
“Metallotetrabenzoporphyrins. New phosphorescent probes for oxygen measurements,”
J. Chem. Soc., Perkin Trans., 2 103
–111
(1995). Google Scholar
S. A. Vinogradov and
D. F. Wilson,
“Phosphorescence lifetime analysis with a quadratic programming algorithm for determining quencher distributions in heterogeneous systems,”
Biophys. J., 67
(5), 2048
–2059
(1994). Google Scholar
K. Tsukada, S. Sakai, K. Hase, and
H. Minamitani,
“Development of catheter-type optical oxygen sensor and applications to bioinstrumentation,”
Biosens. Bioelectron., 18
(12), 1439
–1445
(2003). Google Scholar
J. Moan,
“The photochemical yield of singlet oxygen from porphyrins in different states of aggregation,”
Photochem. Photobiol., 4 445
–449
(1984). Google Scholar
L. M. Scolaro, M. Castriciano, A. Romeo, S. Patane, E. Cefal, and
M. Allegrini,
“Aggregation Behavior of Protoporphyrin IX in aqueous solutions: clear evidence of vesicle formation,”
J. Phys. Chem. B, 106
(10), 2453
–2459
(2002). Google Scholar
M. R. Calvo, J. U. Andersen, P. Hvelplund, S. B. Nielsen, U. V. Pedersen, J. Rangama, S. Tomita, and
J. S. Forster,
“Photophysics of protoporphyrin ions in vacuo: Triplet-state lifetimes and quantum yields,”
J. Chem. Phys., 120
(11), 5067
–5072
(2004). Google Scholar
J. Lafferty and
T. G. Truscott,
“Triplet state of protoporphyrin IX,”
J. Chem. Soc., 1978 51
–52
(1978). Google Scholar
C. Perotti, H. Fukuda, G. DiVenosa, A. J. MacRobert, A. Batlle, and
A. Casas,
“Porphyrin synthesis from ALA derivatives for photodynamic therapy. In vitro and in vivo studies,”
Br. J. Cancer, 90
(8), 1660
–1665
(2004). Google Scholar
A. Casas, H. Fukuda, G. Di Venosa, and
A. Batlle,
“Photosensitization and mechanism of cytotoxicity induced by the use of ALA derivatives in photodynamic therapy,”
Br. J. Cancer, 85
(2), 279
–284
(2001). Google Scholar
R. F. Donnelly, P. A. McCarron, and
A. D. Woolfson,
“Derivatives of 5-aminolevulinic acid for photodynamic therapy,”
Perspect Medicin Chem., 1 49
–63
(2008). Google Scholar
N. Fotinos, M. A. Campo, F. Popowycz, R. Gurny, and
N. Lange,
“5-Aminolevulinic acid derivatives in photomedicine: Characteristics, application and perspectives,”
Photochem. Photobiol., 82
(4), 994
–1015
(2006). Google Scholar
J. C. Kennedy and
R. H. Pottier,
“Endogenous protoporphyrin IX, a clinically useful photosensitizer for photodynamic therapy,”
J. Photochem. Photobiol. B, 14
(4), 275
–292
(1992). Google Scholar
H. Fukuda, A. Casas, and
A. Batlle,
“Aminolevulinic acid: from its unique biological function to its star role in photodynamic therapy,”
Int. J. Biochem. Cell Biol., 37
(2), 272
–276
(2005). Google Scholar
A. M. Batlle,
“Porphyrins, porphyrias, cancer and photodynamic therapy a model for carcinogenesis,”
J. Photochem. Photobiol. B, 20
(1), 5
–22
(1993). Google Scholar
S. Collaud, A. Juzeniene, J. Moan, and
N. Lange,
“On the selectivity of 5-aminolevulinic acid-induced protoporphyrin IX formation,”
Curr. Med. Chem. Anticancer Agents, 4
(3), 301
–316
(2004). https://doi.org/10.2174/1568011043352984 Google Scholar
R. Hornung, M. J. Hammer-Wilson, S. Kimel, L. H. Liaw, Y. Tadir, and
M. W. Berns,
“Systemic application of photosensitizers in the chick chorioallantoic membrane (CAM) model: Photodynamic response of CAM vessels and 5-Aminolevulinic acid uptake kinetics by transplantable tumors,”
J. Photochem. Photobiol. B, 49
(1), 41
–49
(1999). Google Scholar
D. M. Strick, R. L. Waycaster, J. P. Montani, W. J. Gay, and
T. H. Adair,
“Morphometric measurements of chorioallantoic membrane vascularity: effects of hypoxia and hyperoxia,”
Am. J. Physiol., 260 H1385
–H1389
(1991). Google Scholar
N. Lange, J.-P. Ballini, G. Wagnieres, and
H. van den Bergh,
“A new drug-screening procedure for photosensitizing agents used in photodynamic therapy for CNV,”
Invest. Ophthalmol. Vis. Sci., 42
(1), 38
–46
(2001). Google Scholar
|
||||||||||||||||||||||||||||||||||||||||||||||||||||||||||||||||||||||||||||||||