
|
|
1.IntroductionFunctional near-infrared spectroscopy (fNIRS) and imaging have been used to measure functional brain activities.1, 2, 3, 4, 5 The sensitivity of the measured signal to brain activation and the brain volume sampled are crucial for clinical application; however, these factors are not feasible to be measured by experiment.6, 7 Comparatively, simulations can give us reliable information of light propagation in the head6, 7 by which we can obtain quantitative information of those factors in terms of a partial path-length factor (PPF) in brain tissue and the spatial sensitivity distribution of the fNIRS signal.6, 7, 8, 9 Recently, simulation studies based on head models containing a cerebrospinal fluid (CSF) layer have demonstrated that light propagation is highly affected by the presence of CSF.7, 10, 11 Because the cerebral surface is folded as gyri and sulci filling with CSF, it is probable that the cerebral cortex folding geometry is also important for light propagation in the head. Possibly, the gyri and sulci might change the shape of spatial sensitivity profiles. Two investigations have been concerned with the effect of cerebral cortex folding geometry on light propagation. Okada et al. used a layered slab, with slots to imitate the sulci, and found little effect of the sulci on the spatial sensitivity profile for 3- or 4-cm source-detector separation (L SD).10 In the other study, using a two-dimensional (2-D) head model based on a single magnetic resonance imaging (MRI) scan, Fukui et al. showed that the spatial sensitivity profile formed like a banana, but distorted around the structure of cerebral surface, with L SD of 2–5 cm.6 Accordingly, the influence of cerebral cortex folding geometry on light propagation in a real human head is still unknown. A 3-D head model, most realistically representing the reliable and detailed anatomic structure of human head, is essential to examining or exploring the effect of cerebral cortex folding geometry on light propagation. The visible Chinese human (VCH) data set was newly developed according to high-resolution cryosectional color photographs of a reference adult male.12, 13, 14 Following a fine segmentation supervised by anatomists, a voxelized model (voxel size: 0.01×0.01 ×0.02 cm3) that most faithfully represented the human anatomical structures was established.12, 13, 14, 15 The VCH head is thus regarded as a most realistic head model containing the precise cerebral cortex folding geometry. To simulate light propagation in the VCH head, the simulation method applicable for 3-D voxelized media is needed, because the VCH head is a voxelized model. Actually, a software program targeted for Monte Carlo simulation of light propagation in voxelized media (MCVM), which is applicable for the VCH, has been developed.16 By using MCVM, our interest here is to evaluate the light propagation in the VCH with concern on the effect of cerebral cortex folding geometry. In this study, near-infrared light propagation in the forehead of VCH was simulated. The values of the differential optical path-length factor (DPF) in cases of different L SD agreed well with published experimental data on real adult males. The spatial sensitivity profile was shown to have a fat tropical fish shape, with a larger sampled brain region covering the surface of the white matter, showing strong effect of cerebral cortex folding geometry. Lastly, the spatial sensitivity profile and PPF were presented under different L SD. The optimal L SD for fNIRS was suggested to be limited to 3–3.5 cm, while the sensitivity of the detected signal to brain activation reached the peak of 8%. 2.Materials and Methods2.1.Anatomical Head Model of Visible Chinese HumanDetails on developing the VCH phantom, including the image acquisition and segmentation, have been described in Refs. 12, 13, 14. Briefly, the VCH specimen, a male adult, was frozen in the standing posture and horizontally sectioned at 0.02-cm intervals. Digital color photographs of the top surface after each sectioning were obtained with the resolution of 0.01 cm/pixel, which is higher than computed tomography (CT) or magnatic resonance imaging (MRI) data (such as Zubal model17, 18). The segmentation of VCH, unlike CT or MRI data, was performed based on these color photographs, with little dependence on pixel gray values. Under the direction of experienced anatomists, distinct tissues in each slice were visibly distinguished, manually segmented, and labeled with a specified identification number. The advantages, including high resolution and precise segmentation, make the VCH most realistically representative human anatomical structures. Particularly, the upstanding posture of VCH, instead of lying down in MRI or CT, was able to present a more realistic geometry of brain surface for light propagation prediction. The color photographs and the segmented data sets of the VCH forehead were extracted for use. The head model has been segmented into eight types of tissue (see Fig. 1 for one slice), including scalp, skull, CSF, muscle, visible blood vessels, and gray and white matter. The optical properties of these tissues for near-infrared light at 800 nm are listed in Table 1.19, 20, 21 In particular, these optical properties were equal to or close to the related previous studies, such as Ref. 6. For the segmented data set, every four consecutive pixels along both anterior-posterior and left-right directions in every two consecutive slices were chosen to form voxels each of 0.04×0.04×0.04 cm3. This was just the voxel size in our simulation on a common personal computer to balance the computation time and precision. We finally obtained a 3-D matrix of 450×400× 150 voxels containing the indices for different head tissue types. The indices were used to assign tissue-specific optical properties (Table 1) for each voxel. Fig. 1Visible Chinese human (VCH) head model: (a) Digital color photograph of one head slice in the VCH data set and (b) segmentation of the slice in (a). 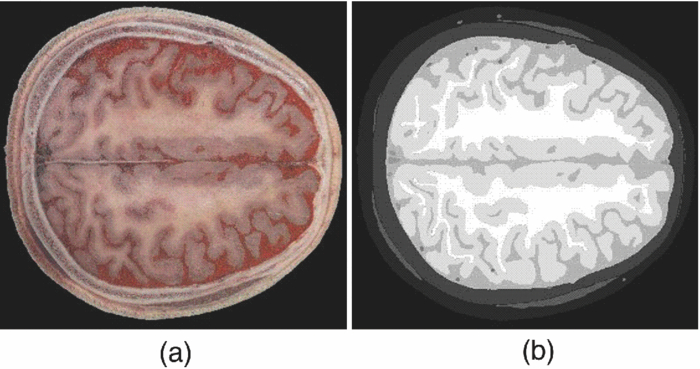 Table 1Optical properties of head tissues for 800-nm light.
2.2.Monte Carlo SimulationMonte Carlo simulation was used to predict light propagation in the VCH forehead. The Monte Carlo software used here was targeted for 3-D voxelized media (MCVM), the algorithm of which has been described in Ref. 16. Photon propagation in the head was determined by scattering coefficient, tiny absorption coefficient, phase function, etc. Notably, the scattering length was segmented into a series of substeps, each of which should be smaller than the voxel side length. Once the photon traveled a substep, it was checked whether the photon had crossed a boundary between different tissues to track each reaction rigorously and precisely. Particularly, when a photon crossed a refractive index mismatch boundary, reflection and transmission would be considered, including the surface of the head and interfaces between different tissue types. Additionally, the scattering length would be corrected when a photon crossed the boundary of voxels with different scattering coefficients. The light sources and detectors were placed on the frontal head with L SD ranging from 1.5 to 5.1 cm. They were located in the slice (Fig. 1), ∼1 cm above the eyebrows. Each simulation was performed with 2×10⁷ photons. The path lengths of detected photons in the head were weighted by the detected photon intensity and accumulated to calculate the DPF in the head and PPF only in brain tissues (the gray matter and white matter). Accordingly, the trajectories of the detected photons weighted were accumulated to obtain the spatial sensitivity distribution.10 Among these variables, DPF is the only one feasible to be measured6, 10 and, thus, the predicted DPFs would be compared to the published experimental data on real adult males for validation of the simulation. Considering that all the calculations of these variables are based on photon trajectories-statistics, we believe that the accuracy of DPF would support the validation of the other variables predicted. The volume sampled by fNIRS was calculated as the spatial sensitivity distribution.6, 7, 8 The brain region sampled by fNIRS at varied L SD was analyzed in terms of spatial sensitivity profile only in brain tissues. 3.Results3.1.Differential Optical Path Length FactorAs mentioned above, calculated DPFs by Monte Carlo simulation with the VCH head model were compared to the experimental data measured on a real adult male forehead, for validation of the simulation. In the simulation, the light source was located on the middle forehead in the slice shown in Fig. 1, while the detectors were placed on the right forehead in the same slice with varied L SD. The experimental data were collected from results reported by Van der Zee et al.,22 and other groups.9, 23, 24 In addition, the DPFs on the layered head model in Refs. 11 and 21 were calculated to analyze the effect of cerebral cortex folding geometry in human head. As shown in Fig. 2, in cases of different L SD, the DPFs calculated from the VCH head model (open circles with a solid line) agreed well with the mean DPFs measured by experiment from real male heads (filled circles). By contrast, the DPFs calculated from the layered head model (dotted line) were higher than all measured DPFs when L SD > 1.5 cm. Accordingly, the cerebral cortex folding geometry was important in improving simulation precision of DPFs. 3.2.Spatial Sensitivity ProfileVideo 1 was presented to show a full view of 3-D spatial sensitivity distribution in the VCH head slices from top to bottom. Particularly, the spatial sensitivity profile in the slice where the source and detector located was shown in Figs. 3(a1) and 3(a2). Here, the source (S) and detector (D) was placed on the left and right frontal head, respectively, with L SD of 3.9 cm. For comparison, simplified head models employed by Okada10 were also tested by our Monte Carlo simulation [Figs. 3(b1) and 3(b2)]. The gray lines in Fig. 3(b1) denoted the interface between different tissues in the layered head model including the outer layer, CSF, white matter, and gray matter. The models related to Figs. 3(b2) and 3(b3) added slots to the above layered model, the white region represented the scalp and skull, and the light gray represented CSF, while the dark gray and black represented the gray matter and white matter, respectively. The contours in all figures in this paper were drawn for 10%, 1% (semi-intense), and 0.1% of the maximum sensitivity. Fig. 3Spatial sensitivity profiles in the (a1, a2) VCH head model and (b1, b2, b3) simplified head models. The simplified head models in (b1, b2) were derived from Ref. 10. The width of slots in (b3) is triple of that in (b2).  Video 1Spatial sensitivity distribution in the VCH forehead. It was shown within VCH slices from top to bottom. The distance interval between each displayed slice is 0.04 cm. The preventative image was shown as Fig. 3a. The locations of light source and detector were shown as S and D. (MPEG, 2 MB).1 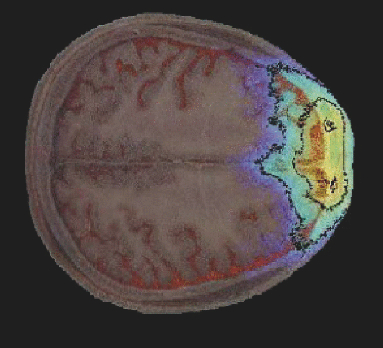 The results showed that the spatial sensitivity profile in the VCH head [Figs. 3(a1) and 3(a2)] formed unlike the well-known “banana” shape [Fig. 3(b1)], which covered uniformly between the source and the detector. Instead, it looked like a fat tropical fish, and covered the gray matter and even the surface of the white matter. Significant distortions were observed around the cerebral cortex folding [Figs. 3(a1) and 3(a2)]. The spatial sensitivity profile penetrated deeper to the brain in the case of thicker CSF, no matter the light source and detector located in the opposite hemispheres [Fig. 3(a2)] or not [Fig. 3(a1)]. Particularly, it extended deeper by 30% under the central sulcus than regions nearby in Fig. 3(a2). The penetration depth and extra penetration depth under the sulcus over the nearby region were a little lower in Fig. 3(a1) than those in Fig. 3(a2). Accordingly, the cerebral cortex folding geometry was suggested to significantly affect the spatial sensitivity profile in human head. This was inconsistent with the previous finding based on the simplified head model [Fig. 3(b2)].10 In order to further examine the effect of cerebral cortex folding geometry, we modified the simplified head model in Fig. 3(b2). Note that the size of sulcus in the VCH head model was quite larger than 1 mm, which was used in the simplified model.10 Then we increased this size to 3 mm, and performed the simulation. As shown in Fig. 3(b3), the semi-intense (1%) sensitivity profile remarkably extended into the sulcus, whereas in the original model [Fig. 3(b2)], it did not. In addition, we simulated on Zubal MRI head model, of which voxel size equaled 1.1×1.1×1.4 mm, and observed the distortion of spatial sensitivity profile by cerebral cortex folding geometry (Fig. 4). However, the distortion on the VCH model was significantly stronger than that on the Zubal model. Therefore, the underestimation of sulcus size might be a crucial reason for the unobserved effect of cerebral cortex folding geometry in the previous study.10 3.3.Effect of Source-Detector SeparationBecause L SD is a widely concerned factor, which affects both spatial sensitivity profile and PPF, we next explored the light propagation in the VCH frontal head in cases of different L SD (Figs. 5, 6). The light source (S) was placed on the middle forehead, while the detector (D) was on the right forehead with varied L SD (Fig. 5). Fig. 6PPF as a function of L SD. (a) PPFs for gray matter and white matter. (b) Percentage of PPFs for brain tissue in DPFs.  The spatial sensitivity profile can penetrate to the surface white matter, although the semisensitive brain region is distributed along the cerebral surface and is still confined to the gray matter. When L SD increased from 1.5 to 5.1 cm, the brain volume interrogated keeps nearly constant; however, the brain region with semi-intense sensitivity gets broader and the penetration depth of the semi-intense spatial sensitivity profile decreases. Given that the broadening of the sampling region would reduce the spatial resolution of fNIRS signal, smaller L SDs for adult head would be preferred. Then, PPF for brain tissues (the gray matter and white matter, PPFbrain), indicating the sensitivity of detected light intensity signal to brain activation, and the ratio of PPFbrain to DPF, indicating the contribution of brain tissue to the detected signal were calculated. As shown in Fig. 6, photons that penetrated into the brain tissues could barely be detected in the case of L SD <1 cm. PPF for the gray matter increased sharply as L SD was >1 cm, kept nearly constant as long as L SD reached 2.5 cm, and decreased slightly as L SD was >3.5 cm [Fig. 6a]. In contrast, the PPF for the white matter maintained small, even in the case of larger L SD. However, the positive PPF value indicated the existence of brain activation signals from the white matter in the detected signals. On the other hand, the PPFbrain/DPF ratio increases as L SD ranged 1–3 cm, and was sustained at 8% in the case of larger L SD. Hence, to obtain a larger PPFbrain component in the detected signal, L SD should be not <3 cm. As above, considering both the spatial sensitivity profile and PPFs in brain tissues, we suggested L SD be within 3–3.5 cm for adult heads. 4.Discussion and ConclusionOn the basis of the VCH head model, the spatial sensitivity distribution and PPF in brain tissues for the adult male heads are predicted by Monte Carlo simulation. The coincidence of calculated DPFs of the VCH head with the experimentally measured DPFs of a real adult head proved our simulation, and our results showed that the cerebral cortex folding geometry indeed dramatically affected light propagation in the head: (i) The spatial sensitivity profile formed like a fat tropical fish. The sensitive brain region was distributed along the folding cerebral surface. (ii) The DPFs were closer to the mean values of experimentally measured DPFs and (iii) larger penetration depth. The sensitive brain region extended inward the cerebral cortex, covering the gray matter and even the surface of the white matter. (4) Larger PPFbrain proportion. First, the previous study, showing little effect of cerebral cortex folding on light propagation, was performed on a simplified head model with slots mimicking the sulcus.10 Our simulation on that model also resulted in the common banana shape of the spatial sensitivity profile. However, increasing the sulcus width, the effect of the sulcus on the spatial sensitivity profile was obvious. The semi-intense (1%) sensitivity profile extended into the sulcus [Figs. 3(b2) and 3(b3)]. Therefore, in those studies using the 2-D or 3-D head models based on MRI slices of the adult head,6, 25, 26, 27, 28 the sulcus width in the models was suggested to be not large enough to affect the spatial sensitivity profile (Fig. 4). And in this study based on the VCH head model, the sulcus width was apparently larger, leading to the transformation of the spatial sensitivity profile from the banana shape to the tropical fish shape. Take the central sulcus in the VCH forehead as an example, the width of which was particularly large. The spatial sensitivity profile in this region penetrated deeper than the nearby region by 30% in the case of L SD ≤ 4.2 cm. Notably, because of the high spatial resolution, tissue contrast, and segmentation precision of the VCH data set, the VCH head model is considered to most realistically represent the cerebral cortex folding geometry of the real adult head. Hence, the tropical fish shape of spatial sensitivity profile is believed to be more realistic. Second, the DPFs in the VCH head model agreed well with the mean values of the experimentally measured DPFs on real human heads when L SD increase from 1 to 5.5 cm, whereas the DPFs in the layered head model11, 21 almost exceeded the higher ends of experimentally measured DPFs as L SD ranged from 1.5 to 5.5 cm (Fig. 2). The published DPFs in a 2-D head model base on a single MRI slice6 were a little lower than those in the layered head model, but were still clearly higher than the mean values of the experimentally measured DPFs. Thus, the folding geometry of the cerebral cortex played an important role in improving the prediction precision of DPFs in adult heads. Third, the penetration depth in the VCH head model exceeded previous expectation. The sampled brain volume has been commonly supposed to be confined to the shallow region of the gray matter, and the white matter is nearly impossible to be detected by the fNIRS signal.6 The penetration depth measured right beneath the source and detector in the case of commonly used L SD in fNIRS (2.5–4.5 cm) was previously predicted to be ∼2 cm.29 In contrast, this value was >3 cm in our VCH head model [Figs. 3(a1) and 3(a2)]. And, our results showed that the sensitive brain region covered the gray matter and penetrated into the superficial white matter (Figs. 3, 5). The small but positive PPFs for the white matter also proved the existence of signal from white matter in the total detected signal [Fig. 6a]. We consider this to be strong evidence to support that brain activation signals can be detected by fNIRS. Lastly, while L SD > 3 cm, the PPFbrain proportion in the total DPF was demonstrated to be maximally 8%, which was higher than those (≤5%) in reports using simplified head models or MRI-based head models.6, 10, 25, 29 Because this parameter denotes the contribution of brain tissue to the measurement of absolute absorption, the higher ratio value might be good news for detecting absolute concentration of oxy- and deoxy-hemoglobin, to interpret brain activities based on the neurovascular coupling hypothesis. Additionally, regarding the relative measurement in practical use, there would be nearly no changes in the signals from the skull and CSF (∼61% in our prediction), and a large portion (>15%) of blood in the scalp would be squeezed out by the probe pressure. Accordingly, <24% of the detected signals were involved in the relative measurement, and the proportion of that for brain activation was, therefore, >35%. Additionally, there was another interesting result to support the effect of cerebral cortex folding geometry. We discovered that PPFs for gray matter were substantially deviated from its trend line as L SD ≤ 4.0 cm. If the cerebral surface were parallel to the skull, without cerebral cortex folding, then the PPFs for the gray matter should be right on the trend line, as in another published paper based on layered head models.11 However, in head models with cerebral cortex folding geometry, the geometry was heterogeneous along the light path, resulting in the deviation of PPFs from the trend line in cases of different L SD. Actually, a slight deviation was also observed in the report using the single-MRI slice–based 2-D head model.6 Furthermore, in this study, the optimization of L SD, which is an important concern for fNIRS detection, was explored. Previously, there was limited information on the optimal L SD in fNIRS measurement on adult heads.30 Commonly, the range of 2.5–4.5 cm was acceptable.6, 28 One recent research suggested that 2.25–3.25 cm was the optimal range of L SD in detecting fast optical signal of brain activity.31 Comparatively, our results indicated a narrower optimal range of L SD. We discovered that with regard to the spatial sensitivity profile, larger L SD was actually not effective in increasing the sampled brain volume or penetration depth. Nevertheless, it produced broadening of the sampled brain region, which would reduce the spatial resolution of fNIRS detection. On the other hand, PPFs in brain tissues and its ratio to DPF both reached the peak at 3–3.5 cm of L SD (Fig. 6). Thus, the range of 3–3.5 cm was suggested to be optimal. Notably, this range actually agreed with the L SD (3 cm) in typical use, which was empirically determined in fNIRS multichannel detection of brain activation in adults.9, 10, 29 In summary, this study visualized the light propagation in the VCH head model based on Monte Carlo simulation. Cerebral cortex folding geometry was demonstrated to have strong effects on light propagation in the head. The spatial sensitivity profile formed like a fat tropical fish, showing strong effect of cerebral cortex folding geometry. The sensitive brain region penetrated into the surface layer of the white matter, leading to a much larger penetration depth compared to previous studies. The optimal L SD was proposed to be in the range of 3–3.5 cm, while the proportion of brain activation signal was maximally 8%. AcknowledgmentsThis work was supported by the Program for Changjiang Scholars and Innovative Research Team in University, the 111 projects, and the Ph.D. Programs Foundation of Ministry of Education of China (Grant No. 20070487058). ReferencesK. Izzetoglu, S. Bunce, B. Onaral, K. Pourrezaei, and
B. Chance,
“Functional optical brain imaging using near-infrared during cognitive tasks,”
Int. J. Hum.-Comput. Int., 17 211
–227
(2004). https://doi.org/10.1207/s15327590ijhc1702_6 Google Scholar
A. Villringer, and
B. Chance,
“Non-invasive optical spectroscopy and imaging of human brain function,”
Trends. Neurosci., 20 435
–442
(1997). https://doi.org/10.1016/S0166-2236(97)01132-6 Google Scholar
T. Li, Q. Luo, and
H. Gong,
“Gender-specific hemodynamics in prefrontal cortex during a visual-verbal working memory task by near-infrared spectroscopy,”
Behav. Brain. Res., 209 148
–153
(2010). https://doi.org/10.1016/j.bbr.2010.01.033 Google Scholar
T. Li, L. Li, Q. Luo, and
H. Gong,
“Assessing working memory in real-life situations with functional near-infrared spectroscopy,”
J. Innovat. Opt. Health. Sci., 2 423
–430
(2009). https://doi.org/10.1142/S1793545809000668 Google Scholar
F. Irani, S. M. Platek, S. Bunce, A. C. Ruocco, and
D. Chute,
“Functional near infrared spectroscopy (fNIRS): An emerging neuroimaging technology with important applications for the study of brain disorders,”
Clin. Neuropsychol., 21 9
–37
(2007). https://doi.org/10.1080/13854040600910018 Google Scholar
Y. Fukui, Y. Ajichi, and
E. Okada,
“Monte Carlo prediction of near-infrared light propagation in realistic adult and neonatal head models,”
Appl. optics, 42 2881
–2887
(2003). https://doi.org/10.1364/AO.42.002881 Google Scholar
Y. Hoshi,
“Functional near-infrared spectroscopy: current status and future prospects,”
J. Biomed. Opt., 12 062106
(2007). https://doi.org/10.1117/1.2804911 Google Scholar
E. Okada, M. Firbank, and
D. T. Delpy,
“The effect of overlying tissue on the spatial sensitivity profile of near-infrared spectroscopy,”
Phys. Med. Boil., 40 2093
–2108
(1995). https://doi.org/10.1088/0031-9155/40/12/007 Google Scholar
Y. Hoshi, M. Shimada, C. Sato, and
Y. Iguchi,
“Reevaluation of near-infrared light propagation in the adult human head: implications for functional near-infrared spectroscopy,”
J. Biomed. Opt., 10 064032
(2005). https://doi.org/10.1117/1.2142325 Google Scholar
E. Okada, M. Firbank, M. Schweiger, S. R. Arridge, M. Cope, and
D. T. Delpy,
“Theoretical and experimental investigation of near-infrared light propagation in a model of the adult head,”
Appl. Opt., 36 21
–31
(1997). https://doi.org/10.1364/AO.36.000021 Google Scholar
E. Okada, and
D. T. Delpy,
“Near-infrared light propagation in an adult head model. I. modeling of low-level scattering in the cerebrospinal fluid layer,”
Appl. Opt., 42 2906
–2914
(2003). https://doi.org/10.1364/AO.42.002906 Google Scholar
S. X. Zhang, P. A. Heng, Z. J. Liu, L. W. Tan, M. G. Qiu, Q. Y. Li, R. X. Liao, K. Li, G. Y. Cui, Y. L. Guo, X. P. Yang, G. J. Liu, J. L. Shan, J. J. Liu, W. G. Zhang, X. H. Chen, J. H. Chen, J. Wang, W. Chen, M. Lu, J. You, X. L. Pang, H. Xiao, Y. M. Xie, and
J. C. Cheng,
“The Chinese visible human (CVH) datasets incorporate technical and imaging advances on earlier digital humans,”
J. Anat., 204 165
–173
(2004). https://doi.org/10.1111/j.0021-8782.2004.00274.x Google Scholar
A. Li, Q. Liu, S. Zeng, L. Tang, S. Zhong, and
Q. Luo,
“Construction and visualization of high-resolution three-dimensional anatomical structure datasets for Chinese digital human,”
Chin. Sci. Bull., 53 1848
–1854
(2008). https://doi.org/10.1007/s11434-008-0244-2 Google Scholar
G. Zhang, Q. Luo, S. Zeng, and
Q. Liu,
“The development and application of the visible Chinese human model for Monte Carlo dose calculations,”
Health Phys., 94 118
–125
(2008). https://doi.org/10.1097/01.HP.0000285256.48498.b4 Google Scholar
G. Z. Zhang, Q. Liu, and
Q. M. Luo,
“Monte Carlo simulations for external neutron dosimetry based on the visible Chinese human phantom,”
Phys. Med. Boil., 52 7367
–7383
(2007). https://doi.org/10.1088/0031-9155/52/24/011 Google Scholar
T. Li, Q. Luo, and
H. Gong,
“MCVM: Monte Carlo modeling of photon migration in voxelized media,”
J. Innovat. Opt. Health Sci., 3 91
–102
(2010). https://doi.org/10.1142/S1793545810000927 Google Scholar
I. G. Zubal, C. R. Harrell, E. O. Smith, Z. Rattner, G. Gindi, and
P. B. Hoffer,
“Computerized three-dimensional segmented human anatomy,”
Med. Phys., 21 299
–302
(1994). https://doi.org/10.1118/1.597290 Google Scholar
V. Toronov, E. D’Amico, D. Hueber, E. Gratton, B. Barbieri, and
A. Webb,
“Optimization of the signal-to-noise ratio of frequency-domain instrumentation for near-infrared spectro-imaging of the human brain,”
Opt. Express., 11 2717
–2729
(2003). https://doi.org/10.1364/OE.11.002717 Google Scholar
W. F. Cheong, S. A. Prahl, and
A. J. Welch,
“A review of the optical properties of biological tissues,”
IEEE J. Quantum Electron., 26 2166
–2185
(1990). https://doi.org/10.1109/3.64354 Google Scholar
A. N. Yaroslavsky, P. C. Schulze, and
I. V. Yaroslavsky,
“Optical properties of selected native and coagulated human brain tissues in vitro in the visible and near infrared spectral range,”
Phys. Med. Biol, 47 2059
–2073
(2002). https://doi.org/10.1088/0031-9155/47/12/305 Google Scholar
E. Okada and
D. T. Delpy,
“Near-infrared light propagation in an adult head model. II. Effect of superficial tissue thickness on the sensitivity of the near-infrared spectroscopy signal,”
Appl. Opt., 42 2915
–2922
(2003). https://doi.org/10.1364/AO.42.002915 Google Scholar
P. van der Zee, M. Cope, S. R. Arridge, M. Essenpreis, L. A. Potter, A. D. Edwards, J. S. Wyatt, D. C. McCormick, S. C. Roth, E. O. R. Reynolds, and
D. T. Deply,
“Experimentally measured optical pathlengths for the adult head, calf and forearm and the head of the newborn infant as a function of inter optode spacing,”
Adv. Exp. Med. Biol., 316 143
–153
(1992). Google Scholar
A. Duncan, J. H. Meek, M. Clemence, C. E. Elwell, L. Tyszczuk, M. Cope, and
D. T. Delpy,
“Optical pathlength measurements on adult head, calf and forearm and the head of the newborn infant using phase resolved optical spectroscopy,”
Phys. Med. Biol, 40 295
–304
(1995). https://doi.org/10.1088/0031-9155/40/2/007 Google Scholar
H. J. Zhao, Y. Tanikawa, F. Gao, Y. Onodera, A. Sassaroli, K. Tanaka, and
Y. Yamada,
“Maps of optical differential pathlength factor of human adult forehead, somatosensory motor and occipital regions at multi-wavelengths in NIR,”
Phys. Med. Biol, 47 2075
–2093
(2002). https://doi.org/10.1088/0031-9155/47/12/306 Google Scholar
G. Strangman, M. A. Franceschini, and
D. A. Boas,
“Factors affecting the accuracy of near-infrared spectroscopy concentration calculations for focal changes in oxygenation parameters,”
NeuroImage, 18 865
–879
(2003). https://doi.org/10.1016/S1053-8119(03)00021-1 Google Scholar
M. A. Franceschini and
D. A. Boas,
“Noninvasive measurement of neuronal activity with near-infrared optical imaging,”
NeuroImage, 21 372
–386
(2004). https://doi.org/10.1016/j.neuroimage.2003.09.040 Google Scholar
D. A. Boas and
A. M. Dale,
“Simulation study of magnetic resonance imaging-guided cortically constrained diffuse optical tomography of human brain function,”
Appl. Opt., 44 1957
–1968
(2005). https://doi.org/10.1364/AO.44.001957 Google Scholar
R. Mudra, A. Nadler, E. Keller, and
P. Niederer,
“Analysis of near-infrared spectroscopy and indocyanine green dye dilution with Monte Carlo simulation of light propagation in the adult brain,”
J. Biomed. Opt., 11 044009
(2006). https://doi.org/10.1117/1.2341652 Google Scholar
M. Firbank, E. Okada, and
D. T. Delpy,
“A theoretical study of the signal contribution of regions of the adult head to near-infrared spectroscopy studies of visual evoked responses,”
NeuroImage, 8 69
–78
(1998). https://doi.org/10.1006/nimg.1998.0348 Google Scholar
G. Taga, F. Homae, and
H. Watanabe,
“Effects of source-detector distance of near infrared spectroscopy on the measurement of the cortical hemodynamic response in infants,”
NeuroImage, 38 452
–460
(2007). https://doi.org/10.1016/j.neuroimage.2007.07.050 Google Scholar
G. Gratton, C. R. Brumback, B. A. Gordon, M. A. Pearson, K. A. Low, and
M. Fabiani,
“Effects of measurement method, wavelength, and source-detector distance on the fast optical signal,”
NeuroImage, 32 1576
–1590
(2006). https://doi.org/10.1016/j.neuroimage.2006.05.030 Google Scholar
|


