|
|
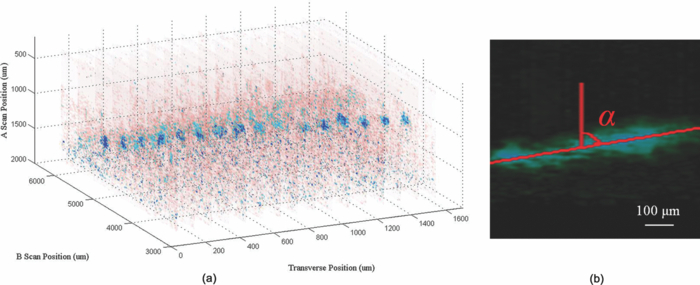
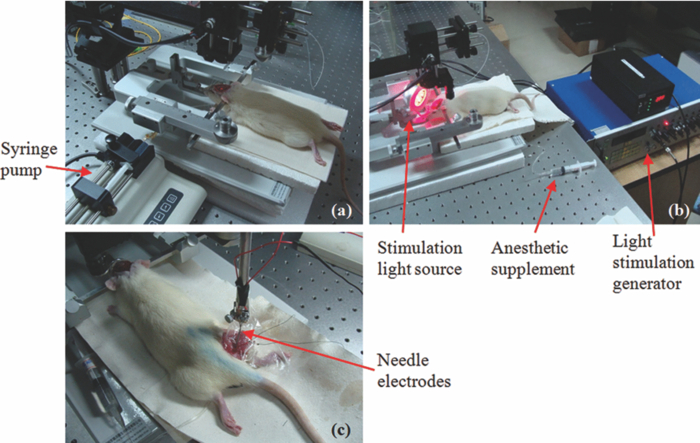
1.IntroductionThe study on regulation of the cerebral microcirculation is currently a highlighted topic in the area of neurology and biomedical imaging.1 Alterations in the brain's blood flow are known to be coupled to local neuronal activity,2 which is the physiological basis of cerebral functional imaging such as positron emission tomography (PET) and functional magnetic resonance imaging (fMRI).3, 4 The study on regulation of the cerebral circulation is crucial to the theory of functional imaging, and medically it promotes the understanding of pathogenesis of cerebrovascular diseases such as cerebral ischemia, hypertension, and even advances the development of therapeutic drugs.5, 6 However, the dynamics of neurovascular coupling and the underlying mechanism of vascular regulation are not yet fully understood. A number of techniques have been used to study the coupling of blood flow within localized regions of brain activity, such as PET, fMRI, scanning laser Doppler flowmetry (SLDF), diffuse reflectance spectroscopy, near-infrared spectroscopy, laser speckle imaging, and two-photon microscopy.7, 8, 9, 10 High spatial resolution, on the order of micrometers, is necessary to distinguish micrometer-scale vessels (arterioles, venules, capillaries) and individual columns. The resolutions of PET and fMRI are too low to distinguish these components. As an improved laser Doppler flowmetry technique, SLDF has a high spatial resolution of 5 μm and is able to investigate the blood flow changes in small vessels. But, the 2-s temporal resolution limits its application for observing the initial phase of neurovascular coupling.7 Optical spectral reflectance techniques, such as diffuse reflectance spectroscopy, near-infrared spectroscopy, and laser speckle imaging, have high spatial and temporal resolution, but they do not provide depth resolution and can only map en face cortex hemodynamics.8, 9 Two-photon microscopy has been used for mapping cortex activity. However, this technique requires injection of fluorescent dyes and has limited penetration depth.10 During neurovascular coupling, the initial blood flow response occurs at arterioles that are at micrometer in space and in time at millisecond.2 Therefore, it requires the imaging technique with spatial resolution at micrometer scale and in real time. The noninvasive nature, high spatial resolution, and tomographic capability of Doppler optical coherence tomography (DOCT)11 make it an ideal technique for mapping depth-resolved blood flow in the cortex. DOCT combines Doppler velocimetry with optical coherence tomography11 to obtain real-time tomographic images of static and moving constituents simultaneously in highly scattering biological tissues. Vessels positioned at depths to 1 mm beneath the tissue surface with diameters as small as 10 μm can be imaged using the DOCT technique.12, 13 DOCT has a number of applications in biomedical research and clinical medicine. In dermatology, for example, DOCT can help to get the detailed knowledge of in vivo blood flow under the skin surface, which is essential for burn-depth determination, laser treatment of skin disease, and photodynamic therapy.14, 15 In a recent study based on an animal model, DOCT is applied to analyze blood flow velocities and vascular dynamics in different rat models. The saphenous artery of the rat's leg is chosen for the investigation of vascular function and its impact on the blood flow response.16 DOCT has also been used to image brain hemodynamics in the cerebral cortex. The cerebral blood perfusion in a mouse is imaged in vivo and the blood flow velocities with almost all vessels in the scanned area are determined at the same time.17 However, the stimulation-induced changes in cerebral blood flow by the DOCT technique have not been studied yet. The preliminary investigation of cerebral microcirculation by time domain DOCT has been demonstrated in our group.18 The imaging speed and velocity dynamic range is limited by the speed of the axial scans (A-scans) in the time domain system. In this paper, the spectral domain DOCT system19 is established and applied to detect the changes in blood flow velocity of a rats’ pial artery in sensory cortex under administration of drug and stimulations of light and electricity. The DOCT technique for the investigation on the regulations of blood flow in the vessels at different scales such as pial artery is presented. 2.Method and Materials2.1.System SetupA schematic of the established spectral domain DOCT system is illustrated in Fig. 1. The light source is a broadband superluminescent diode (SLD 371-HP, Superlum Diodes Ltd.) with a FWHM bandwidth of 45 nm centered at 835 nm, corresponding to a coherence length of 6.8 μm. Maximum output power of the source is 12 mW. The light is coupled into the fiber-based Michelson interferometer via a broadband optical circulator (Thorlabs). In the reference arm, the light is delivered onto a stationary mirror. In the sample arm, the light is focused into the sample by an objective lens (f = 75 mm) with a focused spot of 15 μm. An X-Y galvanometer scanner (6215H, Cambridge Technology) is used to scan the probe beam transversely over the sample. Light returning from the sample and reference arms are recombined in the fiber coupler and the output interference signal is routed into a custom-built spectrometer via the optical circulator. The spectrometer consists of a 60 mm focal length achromatic collimating lens (OZ Optics), a 1200 lines/mm transmission grating (Wasatch Photonics), and a 150-mm focal length achromatic focusing lens (Edmund Optics) that images the spectral interference onto a line-scan CCD camera (ATMEL AVIIVA SM2), with a maximum line scan rate of 29 kHz. The camera has 2048 pixels, with each pixel at 14 μm × 14 μm in size and 12-bit in digital depth. The spectral data are transferred to a computer via a high-speed frame grabber board (PCIe-1430, National Instruments) for data processing. Fig. 1Schematic of the spectral domain DOCT system used to monitor rat's cerebral blood flow velocity. SLD represents the superluminescent diode, and PC is the polarization controller. 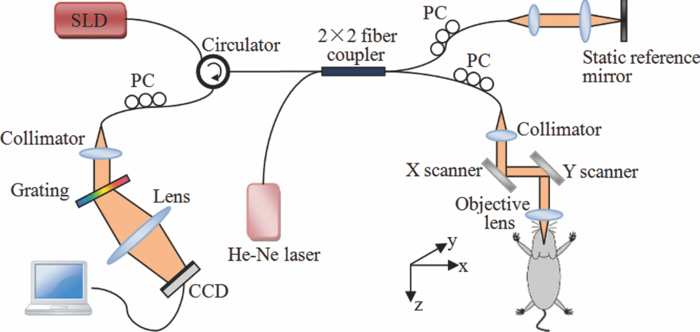 The polarization controllers (PCs) are used to optimize the spectral interference fringe contrast at the detector. Also, a 632.8 nm He–Ne light is coupled into the interferometer for ease of targeting during imaging. The spectrometer has a designed spectral resolution of 0.067 nm, yielding an axial imaging range of 2.56 mm in air on each side of zero delay. The signal sensitivity measured near zero optical path difference is 108 dB with a 16 dB falloff over a 2-mm depth range. 2.2.DOCT Method to Obtain Velocity InformationPhase-resolved DOCT is a method by comparing the phase change of the same pixel between sequential A-scans. Velocity information can be obtained with high resolution while maintaining high spatial resolution. In spectral domain DOCT, a depth profile is obtained by calculating the Fourier transform of the spectral interferogram in the k-space. The depth profile can be recognized as a complex signal, whose amplitude term is used for structural image reconstruction, and the phase term is used for Doppler image reconstruction. The Doppler shift is calculated by the phase difference of successive A-scans. The relationship between flow velocity V and Doppler shift f d is Eq. 1[TeX:] \documentclass[12pt]{minimal}\begin{document}\begin{equation} V = \frac{{\lambda f_d }}{{2\cos \alpha }}, \end{equation}\end{document}In the phase-resolved method, since the phase change is wrapped within 2π, the measured Doppler shift is limited to half of the A-scan frequency. For the current study, the camera integration time is set to be 50 μs, corresponding to an A-scan rate of 20 kHz. Therefore, the maximum speed of blood flow in the direction of the incident beam (V cos α) that can be detected by this system setup is 4.18 mm/s, equivalent to the Doppler shift frequency of ±10 kHz. 2.3.Animal PreparationAn adult Sprague-Dawley rat weighing 250±20 g (from Zhejiang Animal Center) is anesthetized with an intraperitoneal injection of urethane (800 mg/kg). After a rat is anesthetized, a midline scalp incision is made and the parietal bone overlying the sensory cortex is thinned, leaving a thin translucent cranial plate covering an area of 3 mm × 5 mm centered 2-mm caudally and 2-mm laterally to the bregma. After the animal operation, the rat is fixed in a stereotaxic apparatus, and the blood flow velocity of pial arteries in sensory cortex is measured in vivo. 3.Results and Discussion3.1.DOCT Imaging and Velocity MeasurementAs to a B-scan DOCT image consisting of 40 transversal pixels with 40 over-sampling at each transversal pixel, there are 1600 A-scans in a frame of image, corresponding to an acquisition time of 0.08 s with a 20 kHz A-scan rate. However, additional transfer time for the acquired spectra data to the hard disk of a computer is required, thus the total measurement time for a frame of image is approximately 0.4 s. Figures 2a and 2b show the cross-sectional structural and Doppler images with a size of 2.5 mm × 2.0 mm on a rat's pial arteries by DOCT with lateral scanning along the X-direction labeled in Fig. 1. The meninges, pial arteries, and cerebral tissue can be clearly observed in both the structural image and the Doppler image. The Doppler shift of the boxed area of Fig. 2b is shown in Fig. 2c, where the discrete points represent the measured data and the surface is the paraboloid fitting result. We take the maximum of the fitting result as the representative velocity of the blood flow. Fig. 2(a) Structural image and (b) Doppler image of the rat's pial arteries. (c) Paraboloid fitting of the velocity profile.  In order to quantify the absolute flow velocity, it is required to obtain the Doppler angle α. Figure 3a shows the 3-D Doppler image of the target artery, and Fig. 3b shows 2-D Doppler image with lateral scanning along the orientation of the vessel. The Doppler angle α is determined manually and estimated to be 81°. Therefore, the absolute blood flow velocity of the arteriole can be calculated by the estimated Doppler angle and the mean Doppler shift according to Eq. (3). In the following experiments, absolute blood flow velocities of arterioles are all calculated based on this procedure. Finally, a t-test is applied to analyze the velocity data. 3.2.Drug AdministrationAs shown in Fig. 4a, the neck vein of a rat is intubated before being secured in the stereotaxic apparatus. Drug administration is implemented via the neck vein intubatton or abdominal cavity intubatton. The dose and pumping rate of drug injection are controlled by a syringe pump. Shuxuening (SXN) is a drug extracted from gingkgo which has the function of vasodilation. Its main chemical composition is flavonoid. SXN is used as a vasodilator in the treatment of coronary atherosclerotic heart disease and cerebral embolism. In experiments, the changes in blood flow velocity of three rats’ pial arteries in sensory cortex before and after SXN injection are measured by DOCT and commercial laser Doppler system in real time. SXN (supplied as a solution, 3.5 mg/ml in a mixture of GinkgobilobaL and water) is administrated at a dose of 1.7 ml/kg. For a rat weighing around 250 g, the drug injection lasts 1.7 min with the syringe pump set at a rate of 0.250 ml/min. Successive frame data are acquired and recorded automatically. The data measured before SXN administration is considered as the control condition. Figure 5a shows the variations of blood flow velocity before and during the process of SXN administration. It can be seen that the blood flow velocity tends to decrease during the period of 1.7 min for SXN administration, demonstrating that the dilation of vessel occurs instantly by the action of SXN. Therefore, spectral domain DOCT is capable of monitoring blood flow velocity in real time. Fig. 5(a) Blood flow velocity variations before and during the process of SXN administration. (b) Blood flow velocity changes with respect to time, under the action of SXN administration. (c) Doppler image acquired before drug administration. (d) Doppler image acquired 15 min after drug administration.  The mean blood flow velocities of the pial arteries under SXN administration with respect to time are presented in Fig. 5b (P<0.01), in which error bars represent the standard deviation values of velocities in the measured periods. “−1 min” in Fig. 5b denotes the averaged velocity before drug administration and “0 min” denotes the averaged one over 60 s obtained from beginning of the pumping. Data given by the dashed-dotted line are corresponding to the velocities measured by DOCT under pumping via the abdominal cavity intubatton. Data given by the dashed line are corresponding to the velocities measured by a commercial laser Doppler system (Perimed: PeriFlux System 5000) under pumping via the abdominal cavity intubatton. Data given by the solid line are corresponding to the velocity measured by DOCT under pumping via the neck vein intubatton. Figures 5c and 5d are Doppler images before drug administration and 15 min. after drug administration, respectively. As can be seen, there is a decline of blood flow velocity due to SXN administration. The velocity values at 5 and 15 min after SXN administration fall off to 88.6% and 79.7%, respectively, of that before SXN administration. The variations in blood flow velocities measured by DOCT demonstrate a remarkable effect of SXN, which is coincident with SXN pharmacology. A decrease in flow velocity is notable and the effect continues beyond the observation time within our experiment. 3.3.Light StimulationAs shown in Fig. 4b, rat's peritoneum is intubated for anesthetic supplement. An annular-shaped stimulation light source with wavelength of 620 nm is placed in front of the rat's right eye for light stimulation. The intensity and pulse rate of light stimulation are controlled by a stimulation generator. The changes in blood flow velocity of a rats’ contralateral pial arteries in sensory cortex before and under light stimulation are measured by DOCT in real time. Different intensities of stimulation are applied to two groups of rats, with three rats in each group. The first group is stimulated with light at an intensity of 2.94 W, and the second group with light at an intensity of 3.92 W. The light stimulation is applied at pulse rate of 1, 5, 8, 10, and 16 Hz, with pulse duration fixed at 10 ms. The data measured before stimulation is considered as the base line. At each pulse rate, the stimulation spans for 30 s, and there is 10 min interval between successive stimulations. Stimulations at each pulse rate are conducted twice. Frame data are acquired and recorded automatically before and during the stimulation process. Figure 6a shows blood flow velocity variations before and during the process of light stimulation (3.92 W, 1 Hz). Figure 6b presents the measured blood flow velocities versus different pulse rates and intensities for light stimulation (P<0.05), where the measured blood flow velocities are the averaged ones over twice stimulations. The results demonstrate that the blood flow velocity in contralateral pial arteries is accelerated by light stimulation. The increase in blood flow velocity becomes larger for a higher pulse rate in both intensity groups. However, the differences of blood flow velocity between two intensity groups are not evident, probably due to comparable intensities resulting in similar responses. Further investigations with increased difference of light intensity for comparison are scheduled. 3.4.Electrical StimulationAs shown in Fig. 4c, the sciatic nerve in the rat's right hind paw is dissected free, inserted with a pair of stimulating needle electrodes, and bathed in a pool of warm mineral oil. The needle electrodes are connected to a stimulation function generator, which controls the amplitude and frequency of electrical stimulation. The changes in blood flow velocity of the rats’ contralateral pial arteries in sensory cortex before, under, and after electrical stimulation are measured by DOCT in real time. Different voltage amplitudes of stimulation are applied to two groups of rats, with three rats in each group. The first group is stimulated with voltage amplitude of 15 MV, and the second group with voltage amplitude of 30 MV. Electrical stimulation of the sciatic nerve using rectangular pulses with 0.5 ms duration is applied at rate of 1, 5, 10, and 16 Hz for both groups. The data measured before stimulation is considered as the control condition. Electrical stimulation at each frequency lasting for 20 s is conducted twice with a time interval of 10 min. Frame data are recorded automatically before and during the stimulation process, as well as 20 s period just after stimulation. Figure 7a shows the variations of blood flow velocity in contralateral pial arteries before, during and after the process of electrical stimulation at a frequency of 16 Hz with voltage amplitude of 15 MV. It can be seen that the blood flow velocity has an obvious increase during the electrical stimulation period of 20 s, demonstrating that the blood flow velocity is accelerated by electrical stimulation, and the accelerating effect is instant. Fig. 7(a) Blood flow velocity variations before, during and after the process of electrical stimulation (15 MV, 16 Hz). (b) Blood flow velocity versus frequency and amplitude for electrical stimulation (P<0.05).  Figure 7b presents the measured blood flow velocities versus different frequencies and voltage amplitudes for electrical stimulation (P<0.05), in which the measured blood flow velocities are the averaged ones over twice stimulations. The results demonstrate that the blood flow velocity in contralateral pial arteries is accelerated by electrical stimulation of the sciatic nerve, and then immediately slows down after stimulation, tending toward the state before stimulation. The increase in blood flow velocity becomes larger for higher stimulation frequency in both groups of voltage amplitudes. Furthermore, by comparing the results of two groups, it can be seen that the blood flow velocity increases more in the group where the voltage amplitude for electrical stimulation is higher. 3.5.DiscussionIn this study, changes in blood flow velocity of a rats’ pial arteries are measured noninvasively with the established spectral domain DOCT system. By combination of measured Doppler shift and Doppler angle, the absolute flow velocity is obtained and used to monitor cerebral hemodynamics. Significant changes in blood flow velocity due to drug administration are observed. Noninvasive drug screening has great significance in evaluation of drug effects, thus DOCT will help with the rapid development of new drugs as a tool for drug screening. Blood flow velocity is accelerated under both light and electrical stimulations, and the increase of velocity is larger for higher stimulation frequency. Cerebral blood volume increasingly evoked by sciatic nerve stimulation was observed by Li's group using optical reflectance imaging,20 and Malonek's research by laser Doppler flowmetry indicated that increase occurs in both cerebral blood volume and blood flow velocity under visual stimulation.21 Our results are consistent with those results. Therefore, high speed time-sequential images of cerebral blood flow velocity in rat sensory cortex provided by DOCT demonstrate its feasibility for monitoring instant blood flow response to drug or external stimulations. Given its noninvasive nature, high spatial resolution, high velocity sensitivity, and high imaging speed, DOCT shows great promise in brain research, especially in investigation of instant as well as long term cerebral microcirculatory adjustments to drug or external stimulations for spatial localized specific area. This helps us to understand the pathogenesis of cerebral diseases and neurodegenerative diseases. 4.ConclusionChanges in blood flow velocity of the rats’ pial arteries are measured noninvasively with the established spectral domain DOCT system. By combination of measured Doppler shift and Doppler angle, the absolute flow velocity is obtained and used to monitor cerebral hemodynamics. Significant decrease in blood flow velocity due to drug administration is observed. Blood flow velocity is accelerated under both light and electrical stimulations, and the increase of velocity is larger for higher stimulation frequency. Applied voltage amplitude is an influencing factor in response of electrical stimulation, while the response difference with regard to light intensity is not evident at present settings of light stimulation. Compared to light and electrical stimulations, drug administration has greater and longer effects on blood flow. High speed time-sequential images of cerebral blood flow velocity in rat sensory cortex provided by DOCT demonstrates its feasibility for monitoring instant blood flow response to drug or external stimulations. Given its noninvasive nature, high spatial resolution, high velocity sensitivity, and high imaging speed, DOCT shows great promise in brain research, especially in the investigation of instant, as well as long term, cerebral microcirculatory adjustments to drug or external stimulations for a spatially localized specific area. This helps us to understand the pathogenesis of cerebral diseases and neurodegenerative diseases. AcknowledgmentsThis work was supported by the National Natural Sciences Foundation of China (60978037, 60878057, 30770685). ReferencesD. A. Pelligrino,
“Editorial,”
J. Appl. Physiol., 100 3
–4
(2006). https://doi.org/10.1152/japplphysiol.01254.2005 Google Scholar
R. D. Frostig, E. E. Lieke, D. Y. Ts'o, and
A. Grinvald,
“Cortical functional architecture and local coupling between neuronal activity and the microcirculation revealed by in vivo high-resolution optical imaging of intrinsic signals,”
Proc. Natl. Acad. Sci. U.S.A., 87
(16), 6082
–6086
(1990). https://doi.org/10.1073/pnas.87.16.6082 Google Scholar
M. E. Raichle,
“Behind the scenes of functional brain imaging: a historical and physiological perspective,”
Proc. Natl. Acad. Sci. U.S.A., 95
(3), 765
–772
(1998). https://doi.org/10.1073/pnas.95.3.765 Google Scholar
A. Shmuel, E. Yacoub, J. Pfeuffer, P. F. Van de Moortele, G. Adriany, X. Hu, and
K. Ugurbil,
“Sustained negative BOLD, blood flow and oxygen consumption response and its coupling to the positive response in the human brain,”
Neuron, 36
(6), 1195
–1210
(2002). https://doi.org/10.1016/S0896-6273(02)01061-9 Google Scholar
H. Girouard and
C. Iadecola,
“Neurovascular coupling in the normal brain and in hypertension, stroke, and Alzheimer disease,”
J Appl. Physiol., 100 328
–335
(2006). https://doi.org/10.1152/japplphysiol.00966.2005 Google Scholar
C. Iadecola,
“Neurovascular regulation in the normal brain and in Alzheimer's disease,”
Nat. Rev. Neurosci., 5
(5), 347
–360
(2004). https://doi.org/10.1038/nrn1387 Google Scholar
N. Akgoren and
M. Lauritzen,
“Functional recruitment of red blood cells to rat brain microcirculation accompanying increased neuronal activity in cerebellar cortex,”
NeuroReport, 10 3257
–3263
(1999). https://doi.org/10.1097/00001756-199911080-00002 Google Scholar
D. Zhu, W. Lu, Y. Wen, and
Q. Luo,
“Monitoring thermal-induced changes in tumor blood flow and microvessels with laser speckle contrast imaging,”
Appl. Opt., 46
(10), 1911
–1917
(2007). https://doi.org/10.1364/AO.46.001911 Google Scholar
P. B. Jones, H. K. Shin, D. A. Boas, B. T. Hyman, M. A. Moskowitz, C. Ayata, and
A. K. Dunn,
“Simultaneous multispectral reflectance imaging and laser speckle flowmetry of cerebral blood flow and oxygen metabolism in focal cerebral ischemia,”
J. Biomed. Opt., 13
(4), 044007
(2008). https://doi.org/10.1117/1.2950312 Google Scholar
D. Kleinfeld, P. P. Mitra, F. Helmchen, and
W. Denk,
“Fluctuations and stimulus-induced changes in blood flow observed in individual capillaries in layers 2 through 4 of rat neocortex,”
Proc. Natl. Acad. Sci. U.S.A., 95
(26), 15741
–15746
(1998). https://doi.org/10.1073/pnas.95.26.15741 Google Scholar
D. Huang, E. A. Swanson, C. P. Lin,
“Optical coherence tomography,”
Science, 254
(5035), 1178
–1181
(1991). https://doi.org/10.1126/science.1957169 Google Scholar
V. J. Srinivasan, S. Sakadžić, I. Gorczynska, S. Ruvinskaya, W. Wu, J. G. Fujimoto, and
D. A. Boas,
“Depth-resolved microscopy of cortical hemodynamics with optical coherence tomography,”
Opt. Letters., 34
(20), 3086
–3088
(2009). https://doi.org/10.1364/OL.34.003086 Google Scholar
Z. Chen, Y. Zhao, S. M. Srinivas, J. S. Nelson, N. Prakash, and
R. D. Frostig,
“Optical Doppler tomography,”
IEEE J. Sel. Topics Quant. Electron., 5
(4), 1134
–1141
(1999). https://doi.org/10.1109/2944.796340 Google Scholar
J. Nelson, K. Kelly, Y. Zhao, and
Z. Chen,
“Imaging blood flow in human port-wine stain in situ and in real time using optical Doppler tomography,”
Arch. Dermatol., 137
(6), 741
–744
(2001). https://doi.org/10.1364/OL.34.003086 Google Scholar
M. C. G. Aalders, M. Triesscheijn, M. Ruevekamp, M. de Bruin, P. Baas, D. J. Faber, and
F. A. Stewart,
“Doppler optical coherence tomography to monitor the effect of photodynamic therapy on tissue morphology and perfusion,”
J. Biomed. Opt., 11
(4), 044011
(2006). https://doi.org/10.1117/1.2337302 Google Scholar
J. Walther, G. Mueller, S. Meissner, P. Cimalla, H. Homann, H. Mora-wietz, and
E. Koch,
“Time-resolved blood flow measurement in the in vivo mouse model by optical frequency domain imaging,”
Proc. SPIE, 7372 73720J
(2009). https://doi.org/10.1117/12.831828 Google Scholar
R. K. Wang and
L. An,
“Doppler optical micro-angiography for volumetric imaging of vascular perfusion in vivo,”
Opt. Express, 17
(11), 8926
–8940
(2009). https://doi.org/10.1364/OE.17.008926 Google Scholar
J. Meng, Z. Ding, Y. Yang,
“Study on cerebral microcirculation by optical Doppler tomography,”
Sci. China Ser. G, 51
(12), 1883
–1891
(2008). https://doi.org/10.1007/s11433-008-0186-3 Google Scholar
K. Wang, Z. Ding, T. Wu, C. Wang, J. Meng, M. Chen, and
L. Xu,
“Development of a non-uniform discrete Fourier transform based high speed spectral domain optical coherence tomography system,”
Opt. Express, 17
(14), 12121
–12131
(2009). https://doi.org/10.1364/OE.17.012121 Google Scholar
P. Li, Q. Luo, W. Luo, S. Chen, H. Cheng, and
S. Zeng,
“Spatiotemporal characteristics of cerebral blood volume changes in rat somatosensory cortex evoked by sciatic nerve stimulation and obtained by optical imaging,”
J. Biomed. Opt., 8
(4), 629
–635
(2003). https://doi.org/10.1117/1.1609199 Google Scholar
D. Malonek, U. Dirnagl, U. Lindauer, K. Yamada, I. Kanno, and
A. Grinvald,
“Vascular imprints of neuronal activity: relationships between the dynamics of cortical blood flow, oxygenation, and volume changes following sensory stimulation,”
Proc. Natl. Acad. Sci. U.S.A., 94
(26), 14826
–14831
(1997). https://doi.org/10.1073/pnas.94.26.14826 Google Scholar
|