|
|
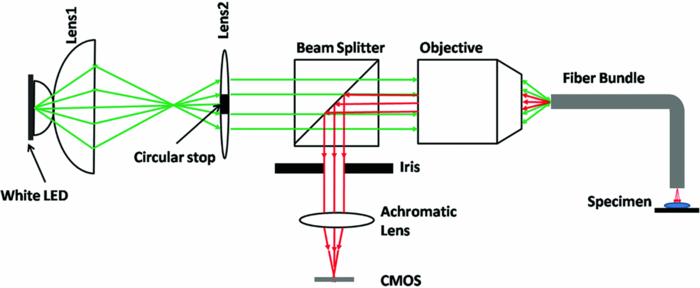
1.IntroductionVarious endoscopic microscopy techniques have been developed for in situ pathology and visual examinations. Flexible optical fiber bundles have been widely used in such endoscopic microscopy applications. 1, 2, 3, 4, 5, 6, 7, 8, 9 The use of a fiber bundle allows visual access to the specimen deep within the body cavity. The fiber bundle imaging also offers a very simple imaging probe configuration, which is why it is widely favored by many endoscopic applications. By using an imaging fiber bundle for light delivery, a scanning mechanism in front of the specimen can be eliminated and images can be formed by scanning a focused light spot at the proximal end of the fiber bundle, pixel by pixel, as in fiber bundle-based laser scanning fluorescence imaging,1 fiber confocal reflectance microscopy,2 two-photon imaging,3 and optical coherence tomography. 4, 5, 6 Such a system can achieve high spatial resolution and large dynamic range. A simpler endoscopic configuration is a scanless fiber bundle endoscopic imager interfaced with a 2D camera for direct imaging of tissue. 7, 10 It is an attractive design to use only one fiber bundle for illumination and image acquisition in a reflectance fiber-bundle microscope (RFM), since such a design can help further miniaturize the endoscopic probe and reduce the system cost. However, dual illumination and image acquisition configuration has an inherent drawback: the specular reflectance from the end facets of the fiber bundle can be orders of magnitude larger than the backscattered light from the sample. 11, 12 The specular reflection takes up a significant part of the limited dynamic range of the detector and thus decreases the image contrast. The resultant large background level also increases the overall noise level, which hinders the efficient detection of the signals of interest. Recently, Sun used a cross polarization detection technique in the reflectance fiber bundle endoscope setup to suppress the specular reflection from the proximal end of the fiber bundle.10 In this study, we propose a dark-field illuminated reflectance mode endoscopic microscope based on a miniature fiber bundle probe for both illumination and signal collection. The proposed dark-field illumination technique can suppress specular reflection similar to techniques such as cross polarization detection and differential interference contrast.13 Although it has been widely used in conventional microscopes, dark-field illumination has only recently been incorporated into other imaging systems. For example, it was used in optical coherence microscopy to reduce specular reflection from cover slides for cell imaging.14 Our experimental results demonstrate that dark-field illumination can effectively suppress the specular reflection from the proximal end of the fiber bundle and provide high contrast imaging. We built a dark-field illuminated reflectance fiber-bundle endoscopic microscope (DRFM) that achieved a 4.4 μm lateral resolution. To show that our DRFM can provide high resolution, high contrast images, we used our DRFM to study the morphologies of cells, including onion skin cells and two types of thyroid cancer cells. Still and video images are presented in this paper. 2.Setup and PrincipleFigure 1 shows the schematic of the DRFM system. We used a white light emitting diode (LED) (Thorlabs, MCWHL2, viewing angle 140 deg) followed by a set of lenses for illumination. The distances between LED, lens1, and lens2 (LB1811, f = 35 mm, Ø1 in.) are adjusted, so that the optical field effectively covers the aperture of lens2 and light is almost collimated after lens2. A polarization-insensitive beam-splitter (CM1-BS013, Thorlabs) is used to direct the illumination light into the imaging bundle and direct the return image to a camera. The probe arm consists of a microscopic objective [Nikon, 10×, numerical aperture (NA) = 0.25] and a fiber bundle (Fujikura, FIGH 500N) with an image circle diameter of 460 μm. The average core size of the fiber bundle is 2.9 μm and the average pitch is 4.5 μm. The incident end of the fiber bundle is on the focal plane of the objective. The flexible fiber bundle delivers light to the imaging site, collects backscattered photons, and delivers them to the camera setup. Since no focusing objective was used at the distal end of the fiber bundle, the images were obtained while the samples were within the beam diffraction length of the fiber bundle mode. Images were sharp when the fiber bundle tip was within the diffraction length to the sample surface; image blurred when the tip was far away from the sample surface, due to the beam diverging. In the camera setup, a doublet achromatic lens (Thorlabs, AC254–150-A-ML) focuses the light on the 2D CMOS imaging sensor interfaced with USB2.0 (DCC1645C, 1280 × 1024, Thorlabs). All images in this paper are in 8-bit gray scale. In the recorded images, each pixel represents a 0.44 μm image width, and scale bars represent 50 μm. To increase the image contrast and remove the pixilation effect due to individual fiber cores of the fiber bundle, we applied histogram equalization together with the Gaussian filtering to the original images [shown in Figs. 6b, 7a, 7b, 7c].6 Fig. 6(a) Unprocessed image of US 1951 Air Force target obtained from DRFM; (b) image obtained by enhancing (a) using histogram equalization and Gaussian filtering. 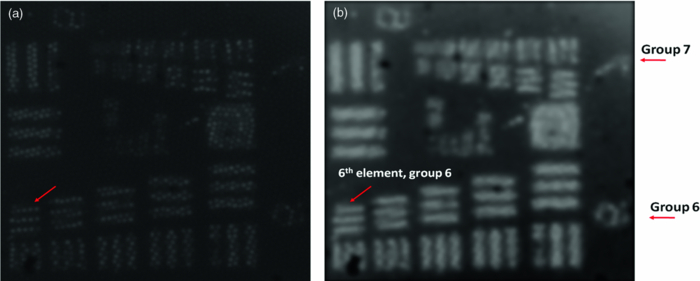 The dark-field illumination is achieved by differentiating illumination and detection light paths. In the illumination path, we block the central light rays along the optical axis using an opaque disk with a diameter of 6 mm, so that only the oblique rays illuminate the proximal end of the fiber bundle. As the result of the annular illumination, the rays reflected from the proximal end of the fiber bundle are also oblique and would carry only high spatial frequency information of the image plane. We use an iris in the detection arm to serve as a low-pass filter and to reject specular rays due to their high spatial frequency. On the other hand, light reflected or scattered by the sample is collected at the distal end of the fiber bundle and guided by the cores of the fiber bundle. Therefore, most of the energy of the signal light is concentrated at the central part of the beam which corresponds to low spatial frequency. Although the iris may also filter out signal light slightly, a significant portion of the signal light is detected by the camera. The principle of DRFM is illustrated more explicitly in Fig. 2 and analyzed based on geometric optics. The illumination light path is shown in Fig. 2a; the specular reflection and signal light paths are shown in Figs. 2b and 2c, respectively. Fig. 2(a) Optical path of illumination light; (b) optical path of light that is specularly reflected from the fiber bundle end; (c) optical path of signal light backscattered by the specimen and guided by the fiber bundle; (d) calculated distribution of optical field exiting from a single fiber core at plane 2  As seen from Fig. 2a, due to the existence of the circular optical stop, the optical field at plane 1 can be expressed as: Eq. 1[TeX:] \documentclass[12pt]{minimal}\begin{document}\begin{equation} E_i \left({x,y} \right) = E_0 \left({x,y} \right)F_1 \left({x,y} \right). \end{equation}\end{document}Eq. 2[TeX:] \documentclass[12pt]{minimal}\begin{document}\begin{equation} F_1 \left({x,y} \right) = \left\{ \begin{array}{ll} 0&\quad {\rm }\left({\sqrt {x^2 + y^2 } \le r_1 } \right) \\[6pt] 1&\quad {\rm }\left({\sqrt {x^2 + y^2 } > r_1 } \right) \\ \end{array} \right.. \end{equation}\end{document}Eq. 3[TeX:] \documentclass[12pt]{minimal}\begin{document}\begin{equation} F_2 \left({x,y} \right) = \left\{ \begin{array}{ll} 0&\quad{\rm }\left({\sqrt {x^2 + y^2 } > r_2 } \right) \\[6pt] 1&\quad{\rm }\left({\sqrt {x^2 + y^2 } \le r_2 } \right) \\[6pt] \end{array} \right.. \end{equation}\end{document}Signal photons backscattered by the sample follow a different path, as shown in Fig. 2c. This is because the geometry of the light beam exiting the fiber bundle is determined by the modes supported by the fiber. Unlike traveling in free space, light incident into the fiber bundle will be coupled into the guided modes determined by the physical properties of the fiber bundle. Therefore, photons traveling in a guided mode in a fiber core will “forget” the illumination configuration. As shown in Fig. 2c, the light backscattered by the specimen will couple into individual cores of the fiber bundle and travel in a guided mode until arriving at the proximal end of the fiber bundle. The output beam will form a cone with a diverging angle determined by the NA of the fiber bundle. Therefore, G 0(x,y), the optical field at plane 2 corresponding to the signal photons, is prominently different from E i(x,y), and is usually maximized at the beam center. We can consider the optical field exiting from an individual core as a Gaussian beam. The waist of the Gaussian beam, the end facet of the fiber bundle, and the front focal plane of the objective coincide in this setup. Let us assume that the waist of the Gaussian beam equals the radius of the cores in the fiber bundle which is 1.45 μm; the focal length of the objective is 15 mm; plane 2 is about 20 cm away from the objective. With these parameters, we can estimate the beam radius w 2 at plane 2 using an ABCD matrix. Based on the value of w 2, we can obtain the optical field at plane 2, which is [TeX:] $g_2 \left({x,y} \right) = g_0 e^{ - {{\left({x^{_2 } + y^{_2 } } \right)} \mathord{\left/ {\vphantom {{\left({x^{_2 } + y^{_2 } } \right)} {w_2^2 }}} \right. \kern-\nulldelimiterspace} {w_2^2 }}}$ .15 The result is shown in Fig. 2d. G 0(x,y), which in fact is the superimposition of the fields from the different cores, should resemble g 2, due to the small diameter of the fiber bundle and spatial incoherence of the LED. As seen from Fig. 2d, the energy of the optical field is concentrated at the center of the beam. As a result, although the iris causes some signal loss, the optical field that passes the iris, E γ,2(x,y) = G 0(x,y)F 2(x,y), still contains a relatively unattenuated light signal from the specimen and is imaged by the CMOS camera. 3.ResultsTo verify that the energy output from the fiber bundle is concentrated in central rays even when an annular illumination shown in Fig. 2a is used, we recorded the distribution of the optical field exiting from the fiber bundle by directly placing the camera in front of the distal end of the fiber bundle without a lens. We adjusted the distance between the camera's sensor array and the fiber bundle end, so that the detector could cover the whole optical field exiting the fiber bundle. The obtained optical field is shown in Fig. 3a, which has its intensity maximized at the beam center. The signal intensity along the 512th row of Fig. 3a is shown in Fig. 3b, which is bell-shaped. Fig. 3(a) transverse profile of beam exiting from the fiber bundle; (b) signal intensity along the 512th row of (a). 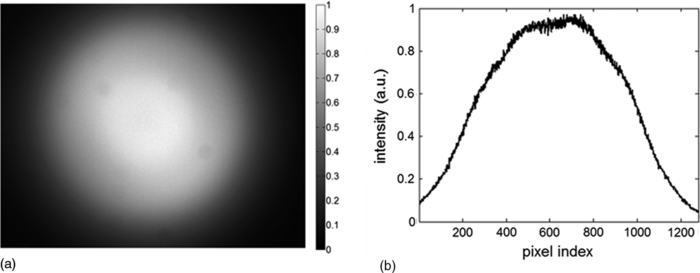 To show that dark-field illumination can effectively suppress the specular reflection at the entrance end of the fiber bundle, we compared images obtained from DRFM and RFM (without dark-field illumination). Without a specimen, we obtained Fig. 4a when the opaque disk was used to block the central rays and the iris aperture was adjusted accordingly. Keeping the same LED power level, the same aperture size of the iris, and the same exposure time of the CMOS camera as when Fig. 4a was taken, we obtained Fig. 4b by simply removing the opaque disk from the optical path. Comparing Figs. 4a and 4b, we can clearly see that dark-field illumination effectively suppressed the end reflection. We also took images, with only an optical stop at plane 1, and without optical stop or iris, under the same imaging condition (camera integration time and LED output power were kept the same). We averaged the signal intensity within the square shown in Fig. 4a for each image, and normalized the resultant intensities using the one obtained without the iris or the stop. The results are summarized in Table 1, which quantitatively shows dark-field illumination can effectively suppress the specular reflection. Fig. 4Reflectance images of the fiber bundle tip obtained at the same experimental conditions (a) with the dark-field illumination and (b) without the dark-field illumination.  Table 1Averaged signal intensity at the central part of the fiber bundle when both iris and stop are inserted into the optical path; when either iris or stop is inserted; and when neither of them are inserted.
To further demonstrate that the reduced specular reflection can improve the image contrast, we imaged NBS 1963A resolution target (Edmund Optics) and show the images of bars (14 cycles/mm) obtained using DRFM and RFM in Figs. 5a and 5b. An optical stop was inserted and the aperture of the iris was adjusted to achieve dark-field illumination. We maintained the same experimental setting when obtaining Figs. 5a and 5b, such as the diameter of the iris, the LED power level, the exposure time of the CMOS camera, as well as the distance between the end of the imaging fiber bundle and the surface of the resolution target. Moreover, the image bundle was nearly touching the resolution target in taking Figs. 5a and 5b; hence there was no remarkable defocusing in both images. To compare the contrast, we normalized both images to their maximum signal intensities within the image circle. Due to the normalization, the bars in Fig. 5a look brighter than in Fig. 5b as the dark-field illumination increased the image contrast. Clearly, the bars in Fig. 5a exhibit a much higher visibility than in Fig. 5b. To remove the signal fluctuation due to the fiber bundle's pixilation, we applied a Gaussian filter with a standard deviation of 4 pixels to Figs. 5a and 5b, and the resultant image intensity along the central (512th) row of the filtered images is shown in Figs. 5c and 5d (normalized to their maximum values). Figure 5c clearly shows higher contrast between the high reflectivity and low reflectivity part of the resolution target. To show the contrast enhancement quantitatively, we calculated the mean signal intensity enclosed in the left rectangle shown in Fig. 5a and denoted the result as I target. We also calculated the mean signal intensity enclosed in the right rectangle and denoted the result as I background. Using I target and I background, we could calculate the local contrast C dark = (I target – I background) / I background of the image shown in Fig. 5a that was obtained using dark-field illumination. Similarly, we could also calculate C bright using the averaged signal intensity within the same areas. The resultant C dark is 1.88 and C bright is 0.88, which indicates we have achieved a more than two-fold improvement on the local contrast by using dark-field illumination. Fig. 5Reflectance images of NBS 1963A resolution target (a) with dark-field illumination; (b) without dark-field illumination; (c) image intensity along the 512th row of the image after Gaussian filtering (a); (d) image intensity along the 512th row of the image after Gaussian filtering (b). 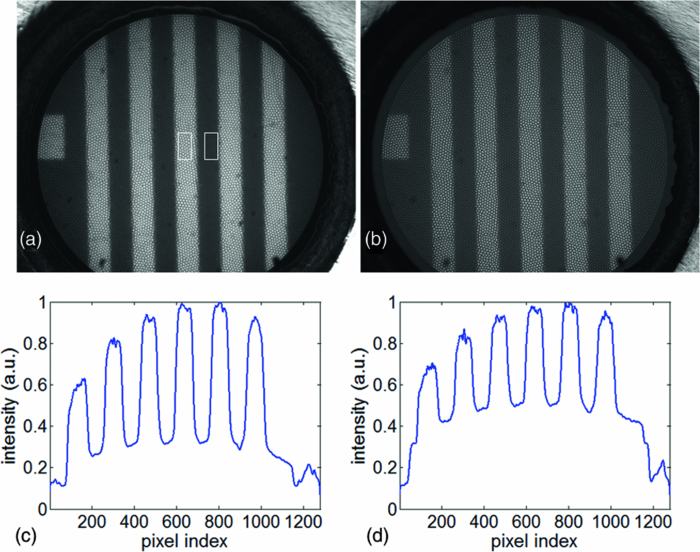 We tested the spatial resolution of DRFM by imaging a U.S. 1951 Air Force target and show the result in Fig. 6a. We enhanced the image contrast and removed the pixilation effect using an algorithm developed by J. Han 6 The result is shown as Fig. 6b in which the 6th element in group 6 is clearly discernable as indicated by the arrow. This implies our DRFM has a resolution on the order of 4.4 μm (114 line pairs/mm), which is limited by the size of the fiber bundle cores. To evaluate our DRFM, we imaged different types of cells. Figure 7a shows a DRFM image of onion skin cells. The hexagon cell walls are clearly resolved. Video 1 shows images of onion cells when the probe is approaching the sample. Since no imaging optics is used at the distal end of the fiber bundle, when the probe is far away from the sample, the image is blurred due to the diverging of the light beam or so called “de-focusing” effect. The cells’ structure becomes sharper in the obtained images when the probe is in close proximity of the sample. Video 1Video obtained when the fiber bundle probe was approaching the sample, which is onion skin cells (MPEG, 376KB).  We also obtained an intrinsic contrast image from label-free cell samples to demonstrate the high sensitivity of our system. It is challenging to image cultured label-free cells using a reflectance mode microscope, due to the low refractive index mismatch between cells and the liquid where cells reside. Therefore, such cell samples are good test subjects for our DRFM. We imaged two thyroid cancer cell lines—KAT-18 and FTC-133—which were seeded in a 24-well plate and imaged after 2 days of culturing. To mimic the endoscopic imaging situation, we took images of the cancer cells by hand-holding the fiber bundle probe and dipping the probe into the nutrient solution. Figures 7b and 7c (also Video 2 and 3) were obtained by imaging a sample containing KAT-18 cells and a sample containing FTC-133 cells. KAT-18 cells are known to have a more elongated shape than FTC-133 cells. As a reference, we took images of KAT-18 and FTC-133 cells using a conventional phase contrast microscope (Nikon Eclipse Ti, magnification: 100) and show the results in Figs. 7d and 7e, which exhibit the same cell morphologies as in Figs. 7b and 7c. Fig. 7(a) Onion skin cells; (b) KAT-18 cells; (c) FTC-133 cells; scale bars represent 50 μm; (d) phase contrast microscopic image of KAT-18 cells; (e) phase contrast microscopic image of FTC-133 cells.  Video 2Video obtained when the fiber bundle probe was dipped into nutrient solution with KAT-18 cells (MPEG, 894KB).  Video 3Video obtained when the fiber bundle probe was dipped into nutrient solution with FTC-133 cells (MPEG, 806KB). 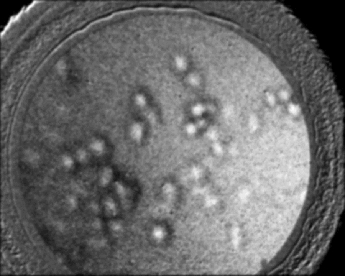 4.DiscussionIn this work, we only considered the suppression of the specular reflection originating from the proximal end of the fiber bundle. Although the distal end of the fiber bundle also results in specular reflection, the reflected light from the distal end usually exhibits significantly less intensity than that from the proximal end. One reason is that the distal end is usually immersed in a water-like medium which has a refractive index similar to the fiber bundle, while the proximal end of the fiber bundle is in the air which has a refractive index significantly different from the fiber bundle's refractive index and leads to a much stronger Fresnel reflection. Another reason is that the coupling loss of the incoherent light source (white LED) to the fiber bundle and the fiber loss results in only a fraction of the source photons arriving at the distal end of the fiber bundle. We used an opaque disk to stop the central rays of the illumination light to achieve dark-field illumination. We chose the diameter of the optical stop based on the systematic experiment that shows the best image contrast. However, an optimal disk size varies if any component of the imaging system is changed. The overall system efficiency depends not only on the size of the optical stop, but also on the NA of the microscope objective and the NA of the fiber bundle. Theoretically, when the NA of the objective equals the NA of the fiber bundle, which is 0.39, the coupling efficiency is optimized.16 However, when we used an objective with a larger magnification and thus higher NA (NA = 0.4), the uniformity of the LED illumination was significantly degraded. As a result, we chose to use an objective with NAobj = 0.25. Moreover, to effectively illuminate the sample, we needed to make sure that the size of the circular stop at plane 1, or size of the iris at plane 2, is smaller than the aperture of the objective. Therefore, the numerical aperture of acceptance cone, NAaccept, has to be smaller than NAobj, which is 0.25. If NAaccept is too small compared to NAobj, most of the signal power will be rejected due to the small diameter of the aperture at plane 2; if NAaccept is close to NAobj, the intensity of illumination light is small due to the large optical stop. As a result, there exists an optimized NAaccept between 0 and 0.25 and we empirically chose the diameter of the stop to be 6 mm and thus NAaccept ≈ 0.2 for optimizing the image contrast. However, as discussed above, the system efficiency does not have a straightforward functional dependency on the NAs. Therefore, numerical simulation is necessary to determine the parameters that optimize the imaging system, which will be a part of our future study. 5.ConclusionIn this work, we proposed and experimentally demonstrated a high-resolution DRFM which is capable of providing high-resolution endoscopic imaging. The proposed DRFM system is cost effective, compact, and uses one fiber bundle for both illumination and imaging. We used dark-field illumination configuration to suppress specular reflection at the proximal end of the fiber bundle. The DRFM used in the experiment achieved a 4.4-μm spatial resolution, which is limited by the pitch and diameter of element fiber cores in the imaging bundle. Video imaging was performed to validate its use for cell morphology. AcknowledgmentsThis work was supported in part by NIH Grant Nos. BRP 1R01 EB 007969–01 and R21 1R21NS063131–01A1. Yong Huang is partially supported by the China Scholarship Council (CSC). ReferencesB. A. Flusberg, E. D. Cocker, W. Piyawattanametha, J. C. Jung, E. L. Cheung, and
M. J. Schnitzer,
“Fiber-optic fluorescence imaging,”
Nat. Methods., 2 941
–950
(2005). https://doi.org/10.1038/nmeth820 Google Scholar
C. Liang, M. Descour, K. B. Sun, and
R. Richards-Kortum,
“Fiber confocal reflectance microscope (FCRM) for in-vivo imaging,”
Opt. Express, 9 821
–830
(2001). https://doi.org/10.1364/OE.9.000821 Google Scholar
W. Göbel, J. N. D. Kerr, A. Nimmerjahn, and
F. Helmchen,
“Miniaturized two-photon microscope based on a flexible coherent fiber bundle and a gradient-index lens objective,”
Opt. Lett., 29 2521
–2523
(2004). https://doi.org/10.1364/OL.29.002521 Google Scholar
T. Xie, D. Mukai, S. Guo, M. Brenner, and
Z. Chen,
“Fiber-optic-bundle-based optical coherence tomography,”
Opt. Lett., 30 1803
–1805
(2005). https://doi.org/10.1364/OL.30.001803 Google Scholar
J. Han, X. Liu, C. G. Song, and
J. U. Kang,
“Common path optical coherence tomography with fibre bundle probe,”
Electron. Lett., 45
(22), 1110
–1112
(2009). https://doi.org/10.1049/el.2009.1627 Google Scholar
J. Han, J. Lee, and
J. U. Kang,
“Pixelation effect removal from fiber bundle probe based optical coherence tomography imaging,”
Opt. Express, 18 7427
–7439
(2010). https://doi.org/10.1364/OE.18.007427 Google Scholar
T. J. Muldoon, M. C. Pierce, D. L. Nida, M. D. Williams, A. Gillenwater, and
R. Richards-Kortum,
“Subcellular-resolution molecular imaging within living tissue by fiber microendoscopy,”
Opt. Express, 15 16413
–16423
(2007). https://doi.org/10.1364/OE.15.016413 Google Scholar
A. F. Gmitro and
D. J. Aziz,
“Confocal microscopy through a fiber-optic imaging bundle,”
Opt. Lett., 18 565
–567
(1993). https://doi.org/10.1364/OL.18.000565 Google Scholar
R. Juškattis, T. Wilson, and
T. F. Watson,
“Real-time white light reflection confocal microscopy using a fibre-optic bundle,”
Scanning, 19 15
–19
(1997). https://doi.org/10.1002/sca.4950190102 Google Scholar
J. Sun, C. Shu, B. Appiah, and
R. Drezek,
“Needle-compatible single fiber bundle image guide reflectance endoscope,”
J. Biomed. Opt., 15 040502
(2010). https://doi.org/10.1117/1.3465558 Google Scholar
P. Lane,
“Terminal reflections in fiber-optic image guides,”
Appl. Opt., 48
(30), 5802
–5810
(2009). https://doi.org/10.1364/AO.48.005802 Google Scholar
P. Lane,
“Reflection-contrast limit of fiber-optic image guides,”
J. Biomed. Opt., 14 064028
(2009). https://doi.org/10.1117/1.3269679 Google Scholar
R. O. Wayne, Light and video microscopy, Academic Press/Elsevier, Boston
(2009). Google Scholar
M. Villiger, C. Pache, and
T. Lasser,
“Dark-field optical coherence microscopy,”
Opt. Lett., 35 3489
–3491
(2010). https://doi.org/10.1364/OL.35.003489 Google Scholar
A. Yariv,
“Optical Electronics in Modern Communications,”
Oxford University, New York
(1991). Google Scholar
X. Chen, K. L. Reichenbach, and
C. Xu,
“Experimental and theoretical analysis of core-to-core coupling on fiber bundle imaging,”
Opt. Express, 16 21598
–21607
(2008). https://doi.org/10.1364/OE.16.021598 Google Scholar
|