
|
|
1.IntroductionThe mouse is a classic mammalian model used to study the anatomical and physiological development of different organ systems. Hundreds of mouse mutants associated with human diseases have been reported, helping to advance our understanding of the genetic basis of development and disease. Moreover, the proven value of genetic approaches to study gene function in the mouse and the efficiency at which individual mutations can be mapped and cloned has lead to several large-scale, international, genome-wide screens for new and advanced models of human disease.1, 2, 3 However, the success of these efforts relies heavily on the ability to analyze phenotypic outcomes, raising an urgent need for better phenotyping tools. Traditionally, the primary analysis of embryonic mutant phenotypes has been based on static analysis of histological sections, requiring many litters at different time points to deduce phenotypic changes. However, methods that allow for directly assessing embryonic phenotypes in utero would obviate the need for sectioning multiple litters, provide dynamic information about development, and enable higher throughput analysis for use in large-scale screens. Toward this goal, noninvasive methods, such as ultrasound, Micro-MRI and microcomputed tomography have been employed.4, 5, 6, 7 Because ultrasound waves can penetrate through many centimeters of tissue without significant attenuation, this method has proven to be a valuable noninvasive embryo phenotyping tool.4, 5 However, the resolution of this technique even for high-frequency systems is limited to about 30–100 μm. Micro-MRI is used for structural 3-D embryo imaging, but its resolution is also limited to about 25–100 μm.8 Additionally, due to the long acquisition times, MRI is sensitive to motion and has limited applicability in live embryo imaging.8, 9, 10 Microcomputed tomography allows for high-resolution (2–50 μm) 3-D imaging but relies on the administration of contrast agents, and the acquisition time required for the method is also too long to be applicable for dynamic imaging.7 Thus, these currently available noninvasive methods either suffer from poor resolution or long acquisition times, which limit their use for live imaging of embryos in utero. Optical techniques, using visible and near-infrared light, can achieve higher spatial resolution with short acquisition times, but scattering and absorption reduce the imaging depth. Because mammalian embryos develop in utero, dense maternal tissue restricts light penetration to the embryos, making optical imaging very challenging. Early stage postimplantation embryos, prior to the dependence on the maternal-placental connection [5.5–10.5 days post coitus (dpc)], can be cultured and imaged directly using optical microscopy methods such as confocal or multiphoton microscopy.11, 12, 13 Although submicron spatial resolution can be achieved with these methods, the imaging depth is limited to hundreds of microns (3–600 um), making this method more applicable to early embryos and superficial structures. To circumvent limits to depth penetration with fluorescence imaging methods while retaining subcellular spatial resolution, we have turned to the use of optical coherence tomography (OCT), which is a 3-D imaging technology based on analysis of interferometry between light backscattered from a sample and a reference signal. This relatively novel modality is increasingly gaining popularity among researchers in ophthalmology, cardiology, dermatology, and oncology. OCT uses nonionizing radiation and is considered to be safe—OCT is FDA approved for use in humans and is currently employed in nearly every ophthalmology clinic.14 The format of data acquired with OCT is similar to that of ultrasound, but the resolution of OCT is about 2–10 μm (which is an order of magnitude higher than with high-frequency ultrasound or Micro-MRI), whereas the imaging depth in tissue is about 1–3 mm. We have recently shown that OCT can be used for live visualization of the entire externalized cultured mouse embryos until 10.5 dpc with a spatial resolution of 8 μm.15, 16 This resolution is sufficient to image individual circulating blood cells and small groups of cells, as well as the movement of the heart wall and blood vessels.17 Jenkins demonstrated that OCT can be used for morphological analysis of abnormal mouse embryonic hearts,18 which demonstrates the potential for this technique to visualize structural and functional consequences of genetic manipulations. However, embryos grown in culture can only be maintained for 24–48 h and embryos beyond 10.5 dpc will not survive due to the need for maternal support. This method therefore excludes the possibility of following long-term processes in the same embryo, and currently, there is no high-resolution technique that allows repetitive live embryonic imaging in the mouse at later stages of gestation. To fill this gap, we developed a new methodology for live imaging of mouse embryos in utero beginning at 12.5 dpc through the remainder of embryogenesis. Prior to 12.5 dpc, each embryo in the uterus is surrounded by a thick, highly scattering layer of decidua, which makes it inaccessible to optical imaging. As the embryos grow and the placenta forms, the decidua thins and degenerates by 12.5 dpc, enabling us to image embryos through the uterine wall with OCT. This paper presents a methodology for chronic in utero imaging of mouse embryos, which involves externalization of the uterine horn through an abdominal incision for imaging. Although semi-invasive, this method allows us to repeatedly image the same living embryos from 12.5 to 18.5 dpc to characterize temporal changes in organ development at previously unprecedented spatial resolution. 2.Materials and Methods2.1.Imaging SetupA swept-source OCT (SS-OCT) system used in this study employs a broadband swept-source laser (Thorlabs, SL1325-P16) with output power P = 12 mW at the central wavelength λ0 = 1325 nm and spectral width Δλ = 100. The scanning rate over the full operating wavelength range is 16 kHz. The light from the swept-source laser source is split between a reference arm and a sample arm as 10 and 90%, respectively. Light that returns from the sample and the reference arm form an interferogram that is detected by a balanced-receiver configuration to reduce source intensity noise as well as autocorrelation noise from the sample (Thorlabs, PDB140C) and is digitized using 14-bit analog-to-digital converter. A periodic optical filter, Mach–Zehnder interferometer–based optical clock, which generates an equally spaced interferogram in frequency domain from a small portion of the source output, is used to remap the signal from the optical time-delay domain into the frequency domain before application of fast Fourier transform (FFT) algorithms. The FFT reconstructs an OCT intensity in-depth profile (called A-scan) from a single scan over the operating wavelength range, resulting in the A-scan acquisition rate of 16 kHz. By scanning across the sample surface in the X and Y directions, 2-D and 3-D data sets are collected. Each 3-D data set was acquired as 512 × 512 A-scan and took ∼20 s. All figures in this paper show direct 2-D and 3-D reconstructions of the originally acquired OCT data sets. The resolution of the current imaging system was measured to be 8 μm in both lateral and in-depth directions. 2.2.Mouse ManipulationsAll animal manipulation procedures described here were approved by the Animal Care and Use Committee of the University of Houston. We performed timed matings between CD-1 mice overnight, and the females were checked for vaginal plugs every morning. A presence of a plug was counted as 0.5 dpc. 2.2.1.Terminal surgeriesFor the imaging, pregnant females were sacrificed at different stages ranging from 12.5 to 18.5 dpc. An incision of about 1–2 cm was made in the lower abdomen, and a uterine horn was externalized through the incision to provide imaging access. The uterine horn was covered with transparent plastic wrap to prevent dehydration. The mouse body temperature was maintained at 37°C by keeping it on a heating pad throughout the procedure. The embryos remained alive during the imaging session, as was evident from their movements and the blood flow (confirmed by the Doppler OCT). 2.2.2.Survival surgeriesFor repetitive imaging of developing embryos, the first imaging session was performed at 13.5 dpc and then repeated at 15.5 and 17.5 dpc. The pregnant females were anesthetized with isoflurane by inhalation. The mouse was placed on a heated platform to maintain the body temperature at 37°C during the whole procedure. Abdominal fur was removed with an electric clipper. To optimize visualization of each embryo and accurately identify individual embryos, the gravid uterine horn was externalized through a 1–2 cm incision made in the lower abdomen. The uterus was covered with transparent plastic wrap, which was wiped with ethanol prior to the procedure. To ensure repetitive imaging of the same embryos, each embryo was assigned a number according to its position in the uterus. After the imaging, the incision was closed using surgical sutures. To minimize postoperative discomfort, Carprofen (5 mg/kg) was administered to the females every 24 h. There were up to three imaging sessions for each pregnant female and each mouse was sacrificed immediately after the third session. 3.Results and DiscussionTo investigate thoroughly what level of structural detail in different organs can be resolved with OCT through the uterine wall, we first performed a series of OCT imaging experiments in which the pregnant dam was sacrificed prior to the imaging session, while the embryos were kept alive by maintaining the temperature of the mother at 37°C. Because embryo viability was not a concern in this case, the imaging sessions were not limited in time as during survival surgeries. This approach allowed for more careful analysis of the embryos and more efficient use of the animals. Furthermore, the female breathing movement did not interfere with the imaging, allowing us to differentiate the limitations of the OCT imaging system from movement artifacts. Figure 1 shows examples of 3-D reconstructions of mouse embryos in the uterus at three different stages: 13.5, 15.5, and 17.5 dpc. Each data set for the reconstructions was acquired as a series of 512×512 A-scans over a 10×10×2.2 mm volume. For visualization purposes, the top layers corresponding to the uterine wall and the yolk sac were removed from the reconstructions with a clipping plane. In Fig. 1, the head and the forelimb are distinguishable on all the reconstructions, and there is a clear morphological and size difference between the shown stages. At 13.5 dpc [Fig. 1a] nearly the whole embryo is within the imaged area, while at 17.5 dpc [Fig. 1c] only parts of the head and the forelimb are visible. Craniofacial details are distinguishable at 15.5 and 17.5 dpc stages. Fig. 13-D reconstructions of mouse embryos in utero at different developmental stages. 1, head; 2, forelimb; 3, hind limb; 4, pinna of ear; 5, eye; 6, yolk sac; 7, uterine wall; 8, follicles of vibrissae. Scale bars correspond to 1 mm.  We next used in utero OCT to image the embryonic limb at different embryonic stages. Figure 2 shows 3-D reconstructions of the embryonic forelimb from 12.5 to 18.5 dpc acquired with SS-OCT through the uterine wall. The insets in the figures show scanning electron micrographs of the forelimb at the corresponding embryonic stages from the Atlas of Mouse Development.19 The morphological differences between the various stages are clearly evident from the reconstructions. The limb has a polygonal shape at 12.5 dpc [Fig. 2a]. At 13.5 dpc [Fig. 2b], the digits become evident as the interdigital zones undergo indentation. At 14.5 dpc [Fig. 2c], the digits are splayed out. By 15.5 and 16.5 dpc [Figs. 2d and 2e], the digits become longer and more parallel to each other, while the webbing between the outgrowing digits undergo programmed cell death. The development of the nails (claws) is evident starting at 15.5 dpc [Figs. 2d, 2e, 2f, 2g]. These reconstructions correlate very well with histological and electron microscopy analysis of mouse embryos at the corresponding embryonic stages.19 Fig. 23-D reconstructions of the embryonic forelimb at different stages of development. Insets show scanning electron micrographs of the embryonic forelimb at the corresponding embryonic stages [adopted from the Atlas of Mouse Development (Ref. 19) with permission]. 1, cartilage primordium of distal phalangeal bone; 2, cartilage primordia of phalangeal bones; 3, cartilage primordia of metacarpal bones; 4, follicles of vibrissae. Scale bars correspond to (a–c) 500 μm, (d–g) 1 mm.  Figure 3 shows cross-sectional views of the developing forelimb at 13.5 and 17.5 dpc, and Figs. 3a, 3b, 3c, 3d, 3e, 3g, 3h, 3i,, 3j and are in-depth OCT scans labeled on the corresponding 3-D reconstructions [Figs. 3f and 3k, respectively] by the dashed lines. At both stages, OCT allows us to image through the entire depth of the digits and about half the depth of the limb. At 13.5 dpc, the digits look uniform in structure on the OCT images, as the cartilage primordium has not yet formed in the digits at this stage. In contrast, at 17.5 dpc, the in-depth OCT scans through the limb [Figs. 3g, 3h, 3i, 3j] demonstrate nonuniform structure of the digits and the palm. The cartilage primordium is clearly distinguishable in the developing digits [Fig. 3h], metacarpal [Fig. 3i], radius and ulna [Fig. 3j]. These observations suggest that our technique provides detailed information (through the uterine wall) for characterization of internal structure and external appearance of the developing limbs. Several mouse models of limb abnormalities associated with human defects have been generated.20, 21 Live OCT imaging can help to further understand these abnormalities. Fig. 3In utero structural imaging of the embryonic forelimb at 13.5 and 17.5 dpc. (a–e) In-depth OCT scans through the embryonic forelimb at 13.5 dpc. (f) Corresponding 3-D reconstruction of the forelimb; dotted lines indicate the positions of the in-depth scans as labeled. (g–j) In-depth OCT scans through the embryonic forelimb at 17.5 dpc. (k) Corresponding 3-D reconstruction of the forelimb; dotted lines indicate the positions of the in-depth scans as labeled. 1, yolk sac; 2, uterine wall; 3, digits; 4, digital interzone; 5, cartilage primordium of radius bone; 6, cartilage primordium of ulna bone; 7, cartilage primordia of phalangeal bones; 8, cartilage primordia of metacarpal bones. Scale bars correspond to 500 μm. 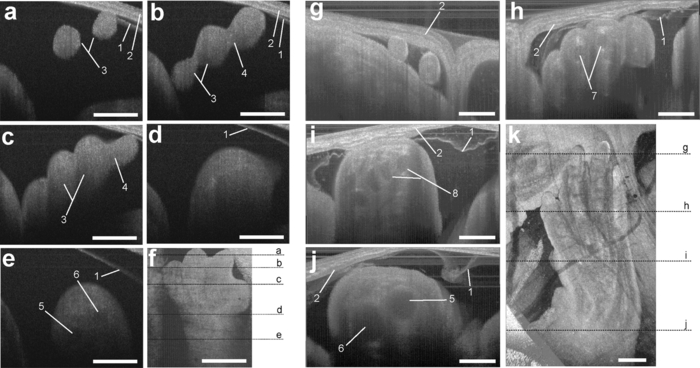 We next assessed the imaging depth through the embryonic brain in utero. Cross-sectional views of the 3-D reconstructions of the embryonic brain at different embryonic stages are shown in Fig. 4. For each stage, corresponding coronal and transverse planes of the reconstructions are presented. The white line represents the location of the corresponding coronal or transverse cross section in each image. The cerebral cortex and the ventricles are clearly outlined and lie within the imaging depth of the system until about 16.5 dpc [Figs. 4a, 4b, 4c]. At later stages, as the skin and skull thicken and the brain grows, the ventricles become inaccessible, while the cortex remains within the imaging depth even at 17.5 dpc [Fig. 4e]. These observations suggest that the proposed technique can be useful to follow the development of the embryonic brain. It can be also used to guide microinjections and in utero electroporation in the embryonic brain, which is a common technique to study gene regulation of brain development that requires embryo viability after the procedure.22 Fig. 4In utero structural imaging of the embryonic brain at different stages of development. Corresponding (left panels) coronal and (right panels) transverse cross sections through the 3-D reconstructions of the embryonic brain are shown for 13.5–17.5 dpc. Lines indicate the location of the corresponding cross section. Scale bars correspond to 500 μm.  These studies demonstrate that OCT imaging allows for in utero visualization of different morphological features of mouse embryonic development. There is a clear advantage of the OCT embryonic imaging in terms of spatial resolution compared to the ultrasound biomicroscopy and Micro-MRI.23, 24 Importantly, all imaged structures are in close agreement with the histological and electron microscopy analyses featured in “The Atlas of Mouse Development.”19 Because the major advantage of in utero imaging is the opportunity it provides to follow the sequence of developmental events in the same embryo, we performed experiments involving multiple imaging sessions in which the same embryos within live pregnant mice were chronically imaged (Fig. 5). In contrast to the previously described experiments, each imaging session was limited to ∼15 min to ensure embryo survival. Only one or two embryos were studied in each litter. The embryos were numbered according to their position in the uterine horn relatively to the oviduct to keep track of the embryos. To reduce the movement of the uterus associated with female breathing, the externalized uterine horn was stabilized with forceps. We found that if the described imaging protocol is followed and care is taken to keep the female and embryos warm, the procedure does not cause any complications for the females or the embryos. Fig. 5Live repetitive in utero imaging of mouse embryos during development with OCT. (a–c) 3-D reconstructions from the same embryo showing a hindlimb and a forelimb at stages 13.5, 15.5, and 17.5 dpc, respectively. (g) (left) A 17.5-dpc embryo after repetitive imaging with OCT and (right) nonimaged embryo of the same litter from the other uterine horn, which was not externalized during imaging sessions. 1, hind limb; 2, forelimb; 3, digits of hind limb; 4, digits of forelimb; 5, yolk sac; 6, uterine wall; 7, tail. Scale bars correspond to 1 mm.  Figures 5a, 5b, 5c shows 3-D reconstructions acquired from the same embryo at three developmental stages at two-day intervals. The imaging depth and the contrast of the SS-OCT imaging provide a comprehensive representation of the structural features of the embryos similarly to the experiments described above. Structural changes of the embryonic limbs during development are clearly visible, suggesting that our method can be used to follow embryonic limb development over the course of several days, as digits, cartilage, and bone are forming. After the third imaging session for each litter, the female was sacrificed and imaged embryos were compared to the nonimaged littermates. To evaluate the adverse effect of the procedure, we assessed embryo survival, growth, and overall morphological structure after the longitudinal study. We found that, if each imaging session is limited to 15 min and the embryos are kept warm during the procedure, the OCT-imaged embryos develop similarly to the nonimaged littermates, though occasionally, they tend to be slightly smaller in size. However, longer imaging sessions (30–40 min) could sometimes cause a noticeable growth delay in the imaged embryos, probably due to the difficulty of maintaining embryo temperature over the course of the experiment. Figure 5d shows a typical image of a 17.5-dpc embryo, which was repetitively imaged with SS-OCT as described above (left) next to its littermate from the other uterine horn, which was not externalized and imaged (right). The embryos are of the same size and look morphologically similar, demonstrating that the described procedure does not cause significant developmental delay. These results demonstrated that OCT imaging could be performed at different stages in the same embryo to follow the course of developmental events in vivo. From 12.5 to 18.5 dpc, mouse embryos undergo significant growth and morphological changes, and the described methodology opens the door for a wide range of live imaging studies to analyze these processes in both wild-type and mutant animals. Even though OCT imaging is limited to outer layers of the embryo, it reveals unique structural features and can be useful for studying defects such as growth abnormalities, craniofacial defects, and limb and brain developmental defects. The developed methodology is ideal for defining the effects of teratogens, many of which affect limb outgrowth, neural tube closure, and facial morphogenesis. Also, similar to ultrasound, OCT can be potentially utilized to guide in utero microinjections in embryos. Live in utero imaging with OCT can be especially beneficial in mutant models with incomplete penetrance. In such models, the phenotypes often differ significantly, making it difficult to understand the sequence of developmental events leading to the resulting phenotype based on the static analysis of tissues extracted at different embryonic stages. Repetitive imaging of the same embryos can address this problem for easier classification and dynamic characterization of such models. OCT imaging is considered to be safe and is FDA approved for clinical use in ophthalmology.14 Therefore, OCT laser light is not expected to be toxic for embryo development. However, the externalization of the uterine horn for imaging should be performed cautiously because it might be associated with exposure of the embryos to lower temperatures and dehydration of the uterine wall if appropriate preventive measures are not taken. Besides, anesthetic agents administered to the pregnant female during the procedure and analgesia administered to minimize postoperative discomfort can affect embryonic cardiodynamics and development; therefore, these agents should be chosen carefully depending on the type of the study. Additional control studies should be always performed to investigate the possible effect of the procedure on the particular embryonic system under analysis. Although the current study demonstrates that OCT is a useful tool to assess mammalian embryonic development, rapid progress in OCT design and development suggests that this methodology will most likely benefit from further developments similarly to the development of ultrasound technology after its first application in embryology. Thus, the spatial resolution of the OCT system used in these experiments was ∼8 μm. Potentially, the imaging resolution can be further improved by implementation of laser sources with a wider waveband. OCT systems with resolution down to 2 μm have been reported, and they are expected to reveal embryonic structure in even greater detail. In summary, in this study we describe a methodology for vital, 3-D imaging of mouse embryos in utero from 12.5 to 18.5 dpc. Although some training is needed to recognize individual tissue layers using lower resolution methods, such as ultrasound or Micro-MRI, high resolution OCT images of embryos and organs at all studied stages are easily recognizable and in close agreement with well-established atlases of mouse development19, 25, 26 and are easily interpreted by any mouse embryologist. This method represents a significant advance in the phenotyping technology needed to screen for mutations and toxins that disrupt normal development. AcknowledgmentsThe project is supported by the National Institutes of Health (Grant No. R01HL095586) and the American Heart Association (Grant No. 10SDG3830006). ReferencesS. D. Brown, W. Wurst, R. Kuhn, and
J. M. Hancock,
“The functional annotation of mammalian genomes: the challenge of phenotyping,”
Annu. Rev. Genet., 43 305
–333
(2009). https://doi.org/10.1146/annurev-genet-102108-134143 Google Scholar
I. Y. Kim, J. H. Shin, and
J. K. Seong,
“Mouse phenogenomics, toolbox for functional annotation of human genome,”
BMB Rep., 43 79
–90
(2010). Google Scholar
H. Morgan, T. Beck, A. Blake, H. Gates, N. Adams, G. Debouzy, S. Leblanc, C. Lengger, H. Maier, D. Melvin, H. Meziane, D. Richardson, S. Wells, J. White, J. Wood, M. H. de Angelis, S. D. Brown, J. M. Hancock, and
A. M. Mallon,
“EuroPhenome: a repository for high-throughput mouse phenotyping data,”
Nucleic Acids Res., 38 D577
–585
(2010). https://doi.org/10.1093/nar/gkp1007 Google Scholar
F. S. Foster, M. Zhang, A. S. Duckett, V. Cucevic, C. J. Pavlin,
“In vivo imaging of embryonic development in the mouse eye by ultrasound biomicroscopy,”
Invest Ophthalmol Vis. Sci., 44 2361
–2366
(2003). https://doi.org/10.1167/iovs.02-0911 Google Scholar
C. K. L. Phoon and
D. H. Turnbull,
“Ultrasound biomicroscopy-Doppler in mouse cardiovascular development,”
Physiol. Genomics., 14 3
–15
(2003). Google Scholar
F. S. Christopher, W. L. Cecilia, and
L. Linda,
“Fetal mouse imaging using echocardiography: a review of current technology,”
Echocardiography, 23 891
–899
(2006). https://doi.org/10.1111/j.1540-8175.2006.00335.x Google Scholar
E. L. Ritman,
“Micro-computed tomography-current status and developments,”
Annu. Rev. Biomed. Eng., 6 185
–208
(2004). https://doi.org/10.1146/annurev.bioeng.6.040803.140130 Google Scholar
B. Hogers, D. Gross, V. Lehmann, K. Zick, H. J. De Groot, A. C. Gittenberger-De Groot, and
R. E. Poelmann,
“Magnetic resonance microscopy of mouse embryos in utero,”
Anat. Rec., 260 373
–377
(2000). https://doi.org/10.1002/1097-0185(20001201)260:4<373::AID-AR60>3.0.CO;2-Q Google Scholar
P. Pallares, M. E. Fernandez-Valle, and
A. Gonzalez-Bulnes,
“In vivo virtual histology of mouse embryogenesis by ultrasound biomicroscopy and magnetic resonance imaging,”
Reprod. Fertil. Dev., 21 283
–292
(2009). https://doi.org/10.1071/RD08124 Google Scholar
B. J. Nieman, N. A. Bock, J. Bishop, X. J. Chen, J. G. Sled, J. Rossant, and
R. M. Henkelman,
“Magnetic resonance imaging for detection and analysis of mouse phenotypes,”
NMR Biomed., 18 447
–468
(2005). https://doi.org/10.1002/nbm.981 Google Scholar
E. A. V. Jones, D. Crotty, P. M. Kulesa, C. W. Waters, M. H. Baron, S. E. Fraser, and
M. E. Dickinson,
“Dynamic in vivo imaging of postimplantation mammalian embryos using whole embryo culture,”
Genesis, 34 228
–235
(2002). https://doi.org/10.1002/gene.10162 Google Scholar
J. L. Lucitti, E. A. V. Jones, C. Huang, J. Chen, S. E. Fraser, and
M. E. Dickinson,
“Vascular remodeling of the mouse yolk sac requires hemodynamic force,”
Development, 134 3317
–3326
(2007). https://doi.org/10.1242/dev.02883 Google Scholar
S. Nowotschin and
A. K. Hadjantonakis,
“Use of KikGR a photoconvertible green-to-red fluorescent protein for cell labeling and lineage analysis in ES cells and mouse embryos,”
BMC Dev. Biol., 9 49
(2009). https://doi.org/10.1186/1471-213X-9-49 Google Scholar
J. Chen and
L. Lee,
“Clinical applications and new developments of optical coherence tomography: an evidence-based review,”
Clin. Exp. Optom., 90 317
–335
(2007). https://doi.org/10.1111/j.1444-0938.2007.00151.x Google Scholar
I. V. Larina, N. Sudheendran, M. Ghosn, J. Jiang, A. Cable, K. V. Larin, and
M. E. Dickinson,
“Live imaging of blood flow in mammalian embryos using Doppler swept source optical coherence tomography,”
J. Biomed. Opt., 13 0605061
(2008). https://doi.org/10.1117/1.3046716 Google Scholar
K. V. Larin, I. V. Larina, M. Liebling, and
M. E. Dickinson,
“Live imaging of early developmental processes in mammalian embryos with optical coherence tomography,”
J. Innovat. Opt. Health Sci., 2 253
–259
(2009). https://doi.org/10.1142/S1793545809000619 Google Scholar
I. V. Larina, S. Ivers, S. Syed, M. E. Dickinson, and
K. V. Larin,
“Hemodynamic measurements from individual blood cells in early mammalian embryos with Doppler swept source OCT,”
Opt. Lett., 34 986
–988
(2009). https://doi.org/10.1364/OL.34.000986 Google Scholar
M. W. Jenkins, P. Patel, H. Y. Deng, M. M. Montano, and
M. Watanabe, and
A. M. Rollins,
“Phenotyping transgenic embryonic murine hearts using optical coherence tomography,”
Appl. Opt., 46 1776
–1781
(2007). https://doi.org/10.1364/AO.46.001776 Google Scholar
M. H. Kaufman, The Atlas of Mouse Development, Academic Press, London
(1992). Google Scholar
A. Liu, A. L. Joyner, and
D. H. Turnbull,
“Alteration of limb and brain patterning in early mouse embryos by ultrasound-guided injection of Shh-expressing cells,”
Mech. Dev., 75 107
–115
(1998). https://doi.org/10.1016/S0925-4773(98)00090-2 Google Scholar
H. H. Chang, Y. Tse, and
M. H. Kaufman,
“Analysis of interdigital spaces during mouse limb development at intervals following amniotic sac puncture,”
J. Anat., 192 59
–72
(1998). https://doi.org/10.1046/j.1469-7580.1998.19210059.x Google Scholar
T. Saito and
N. Nakatsuji,
“Efficient gene transfer into the embryonic mouse brain using in vivo electroporation,”
Dev. Biol., 240 237
–246
(2001). https://doi.org/10.1006/dbio.2001.0439 Google Scholar
S. Kulandavelu, D. Qu, N. Sunn, J. Mu, M. Y. Rennie, K. J. Whiteley, J. R. Walls, N. A. Bock, J. C. Sun, A. Covelli, J. G. Sled, and
S. L. Adamson,
“Embryonic and neonatal phenotyping of genetically engineered mice,”
ILAR J., 47 103
–117
(2006). Google Scholar
K. Tobita, X. Liu, and
C. W. Lo,
“Imaging modalities to assess structural birth defects in mutant mouse models,”
Birth Defects Res. C, 90 176
–184
(2010). https://doi.org/10.1002/bdrc.20187 Google Scholar
R Rugh, The mouse; its reproduction and development, Burgess Pub. Co., Minneapolis
(1968). Google Scholar
K Theiler, The House Mouse: Atlas of Embryonic Development, Springer-Verlag, New York
(1989). Google Scholar
|


