
|
|
1.IntroductionA solid tumor larger than 1 mm in diameter requires an adequate blood supply for growth and metastasis.1, 2 Accordingly, inhibition of angiogenesis is one of the most promising strategies for cancer therapy. More than 50 angiogenesis inhibitors that target aberrant tumor vasculature are currently in clinical trials and several drugs are approved for clinical use.3, 4 During angiogenesis and anti-angiogenic therapeutic regimens, vascular density, perfusion, permeability, and other blood vessel changes in structure and function can occur simultaneously.5 The response to most anti-angiogenesis therapies are dynamic and have time scales ranging from several hours to days. Hence, introduction of a sensitive and efficient imaging tool that can noninvasively measure multiple vascular parameters could facilitate anti-angiogenic drug development.6 To meet this demand, various dynamic vascular imaging techniques have been developed. Dynamic contrast-enhanced magnetic resonance imaging (DCE-MRI) and perfusion computed tomography use the time kinetics of a contrast agent to extract multiple vascular parameters pertaining to blood flow, permeability, and blood volume.7 These techniques were applied successfully in clinical trials of anti-angiogenic drugs, but require a heavy hardware system with sophisticated analysis software.8 Ultrasound techniques, such as Doppler ultrasound and contrast-enhanced ultrasound with microbubbles, have also been clinically used to measure vascular physiology, but are limited to blood flow.7, 9 To map vascular parameters efficiently, optical methods, especially those using time-series analysis of indocyanine green (ICG), have been developed and applied to assess cerebral blood flow10 or vascular permeability in tumors.11, 12 To our knowledge, however, there has been no optical method that simultaneously measures multiple parameters of biological significance, including vascular density, perfusion, and permeability. We have developed a novel noninvasive imaging tool for monitoring multiple vascular parameters in vivo. This method is based on time-series imaging of an intravenously administrated fluorescence probe and a novel mathematical model to extract important biological parameters, including not only permeability, but also vascular density and perfusion. In tumor-bearing mice, we could measure multiple vascular parameters with high spatial resolution. Using this method, we revealed the early effects of an anti-angiogenic drug on tumor vasculature. 2.Materials and Methods2.1.Xenograft Tumor ModelSeven-week-old male nude mice (BalB/cAnNCriBgi-nu; Charles River Japan, Yokohama, Japan) were used in all of the experiments. In experiments with dynamic fluorescence imaging (DyFI), mice received subcutaneous injections of 1 × 10⁷ U251MG cells into the right lower flank under ketamine/xylazine anesthesia. The animal care and experimental procedures were performed with the approval of the Animal Care Committee of KAIST (Daejeon, South Korea). 2.2.Dynamic Fluorescence ImagingThe system for DyFI was built to allow serial acquisition of ICG fluorescence emission with high sensitivity and included a charge-coupled device (CCD) camera (PIXIS1024; Princeton Instruments, Princeton, New Jersey), two 760-nm light-emitting diode (LED) arrays (SMC760; Marubeni America, Santa Clara, California) to excite the ICG dye, a near-infrared (NIR)-sensitive right-angled mirror (W47-308; Edmund Optics, Singapore), two 760 ± 20-nm excitation bandpass filters (Asahi Spectra USA, Torrance, California), and an 830 ± 20-nm emission bandpass filter (Asahi Spectra USA), as shown in Fig. 1a. The LED arrays were adjusted to gain a uniform illumination field, and the mirror was introduced to visualize both dorsal and lateral sides of the animal simultaneously [Fig. 1b]. The optical setup was shielded with a light-tight box to ensure high signal-to-noise ratios. Fig. 1DyFI. (a) Schematic diagram of the optical setup for DyFI. (b) A bright-field image of a tumor xenograft mouse and a temporal sequence of fluorescence images after the intravenous injection of ICG at 0 s. The box with the dashed line indicates the region of interest in the fluorescence images. The three colored dots (red, green, and blue) indicate the region of interest in (d) with the corresponding colors. Scale bar, 1 cm. Five representative time points are shown. (c) Modeling for ICG pharmacokinetics. Three main determinants consisting of elimination, perfusion, and permeability are considered in the model. For elimination, the constant fractional elimination of ICG from plasma by the liver and the kidney is represented by τ (elimination time constant). For perfusion, flow rate (F) is introduced to describe the transport of blood from the arterial compartment to the capillary and venous compartments. For permeability, bidirectional transport of ICG between plasma and the extravascular space is described by two parameters, each representing extravasation (K ext) and intravasation (K int). (d) Regression analysis of time-series ICG fluorescence to the model. Temporal ICG dynamics of the three regions indicated in (b) with colored dots (red, green, and blue), their fitting curves with the corresponding colors, and a table for the extracted parameters are shown [Spearman correlation: r S = 0.999 (P < 0.0001) for red, r S = 0.961 (P < 0.0001) for green, and r S = 0.995 (P < 0.0001) for blue]. r.f.u., relative fluorescence unit; V A, volume fraction of the arterial compartment; V CV, volume fraction of the capillary and venous compartment; V T, volume fraction of the tissue compartment. 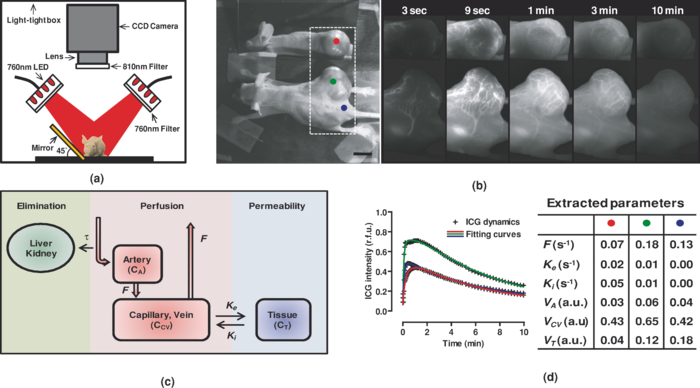 DyFI was performed when the tumor size reached approximately 1 cm3. For time-series ICG imaging, mice were anesthetized with ketamine/xylazine, laid on the imaging system, and held with tape. Under the serial acquisition mode of a CCD camera at 3-s intervals, ICG (0.1 ml of 400 μmol/L ICG; Sigma Chemical, St. Louis, Missouri) was injected intravenously through the tail vein. The time-series image acquisition of the fluorescence emission lasted for 10 min after the ICG injection. Following the serial imaging, a bright-field image of the mouse was taken to aid in the selection of regions of interest. Image processing and regression analyses were performed using matlab software (MathWorks, Natick, Massachusetts) functions, including nonlinear least-squares fitting (lsqnonlin). After loading 200 successive images (0 to 10 min at 3-s intervals), the average background noise was subtracted in each image. Using the lsqnonlin function on the images obtained from 1 to 4 min, the half-life of ICG was determined in the manually selected region where the ICG dynamics were almost completely exponential. Since the ICG dynamics contain dense information at early time points, the images were sampled sparsely at later time points with the experimentally determined variable sampling rate to ensure the best fit; usually, 1 out of 1 image until 1 min, 1 out of 3 to 5 images until 5 min, and 1 out of 5 to 10 images until 10 min were used. For each pixel, excluding the background, the temporal ICG dynamics were regressed to the devised mathematical model [Eq. 4] using the lsqnonlin function. The regression analysis in a pixel generates a set of parameters including volume fractions for each compartment, perfusion, permeability, and vascular density. To obtain each parameter map, the spatial distributions of the corresponding parameters were displayed using the imagesc function. For merged parameter maps, each parameter was normalized, mapped to red, green, or blue, superimposed, and displayed using the imagesc function. 3.Results3.1.Development of Dynamic Fluorescence ImagingTo trace blood dynamics in vivo, we used the nontoxic tricarbonate fluorophore ICG. The action spectrum of ICG is in the near-infrared region and it has greater tissue transmittance and lower scattering compared to visible light. Using ICG, it is possible to visualize relatively deep-lying structures in vivo.13 When administered intravenously, ICG predominantly binds to serum proteins, especially albumin. Accordingly, the probe is suitable for studying macromolecular permeability, as well as the perfusion of tumor vasculature. The ICG–albumin complex is segregated in the liver and excreted by the hepatic or renal pathway. Since this elimination process is an exponential decay with a half-life of 3 to 5 min, the arterial input function, which is indispensable for pharmacokinetic analysis, can easily be determined with high accuracy.12, 14 To perform time-series fluorescence imaging, we developed a reflectance NIR fluorescence imaging system as described in Sec. 2 [Fig. 1a]. After tail vein injection of ICG into an anesthetized tumor-bearing mouse, fluorescence emission was acquired with 3-s intervals for 10 min. The ICG profile in the tumor was distinctive with high but uneven fluorescence due to aberrant vessel formation. No apparent retention of ICG was observed in tumors or normal tissues, which might interfere with repetitive imaging [Fig. 1b]. The spatiotemporal dynamics of ICG were modeled mathematically using differential equations [Fig. 1c]. Three main determinants for ICG pharmacokinetics consisting of elimination, perfusion, and permeability were considered in the model. The arterial input function (C A) was determined by the elimination of ICG in the liver and was expressed as an exponential decay function with the time constant τ. Although some studies assumed a biexponential model to consider the long- and short-term decay of ICG, since the long-term decay is on the order of hours, ICG decay for 10 min can be approximated to a single exponential Eq. 1. The half-life of ICG decay ranged from 3 to 5 min. Therefore, ICG concentrations in an artery (C A) with time can be expressed as Eq. 1 (t is time; C 0 is the initial concentration for ICG). Eq. 1[TeX:] \documentclass[12pt]{minimal}\begin{document}\begin{equation} C_A = C_0 e^{ - t/\tau }. \end{equation}\vspace*{-11pt}\end{document}Transport of ICG through the vascular lumen, specifically between the arterial compartment to the compartments of the capillaries and veins (C CV), is indicative of perfusion and was represented using Fick's law with the flow rate F [Eq. 2]. Permeability, indicating bidirectional transport of ICG between intravascular and extravascular compartments (C T), was modeled with two parameters of extravasation (K e) and intravasation (K i) [Eq. 3]. Eq. 2[TeX:] \documentclass[12pt]{minimal}\begin{document}\begin{equation} C^\prime_{CV} = F(C_A - C_{CV}) - K_e C_{CV} + K_i C_T,\end{equation}\vspace*{-21pt}\end{document}Eq. 3[TeX:] \documentclass[12pt]{minimal}\begin{document}\begin{equation} C^\prime_T = k_e C_{CV} - k_i C_T. \end{equation}\end{document}Eq. 4[TeX:] \documentclass[12pt]{minimal}\begin{document}\begin{equation} I = V_A C_A + V_{CV} C_{CV} + V_T C_T.\end{equation}\end{document}To determine whether the model is relevant, we tested the fitness of the devised model with experimentally obtained time-series ICG fluorescence data. In both tumors and normal tissues, the curve fits matched the experimentally obtained ICG dynamic data, reflecting the relevance of the model [Fig. 1d]. Regression analysis of time-series ICG dynamics at a pixel generates a set of pharmacokinetic parameters comprising vascular density, perfusion, and permeability. By applying regression analysis in a pixel-by-pixel manner, we could map the spatial distribution of multiple pharmacokinetic parameters with high resolution [Figs. 2a, 2b, 2c]. We called this method dynamic fluorescence imaging. Fig. 2Spatial profile of vascular parameters in tumors. (a)–(c) Color-coded maps (left panels) and histogram analysis (right panels) for vascular density, perfusion, and permeability in the tumor. Since the vascular density map is dependent on excitation light intensity, vascular density in the shaded area (arrow) was underestimated. The regions in (a) demarcated by the dashed and solid lines indicate the tumor and normal tissue used for the histogram analysis, respectively. a.u., arbitrary unit. 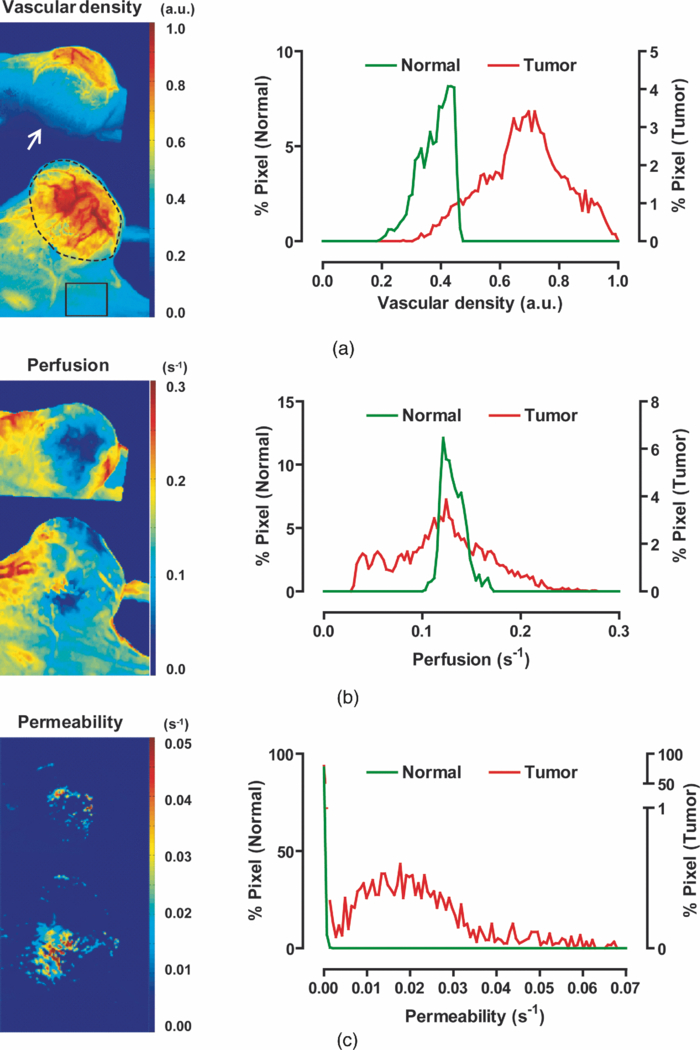 3.2.Measuring Vascular Parameters in Tumors Using DyFIIn multiparametric pharmacokinetic maps, tumors showed distinctive spatial profiles of functional vascular density, perfusion, and permeability compared to the normal counterparts. Vascular density was markedly enhanced but unevenly distributed, suggesting spatial heterogeneity of tumor-induced vessel formation [Fig. 2a]. Unexpectedly, high vascularity did not always couple to better perfusion in the tumors. While perfusion increased in some regions, it decreased in other regions, demonstrative of functionally inefficient angiogenesis [Fig. 2b]. Nevertheless, perfusion was usually enhanced at the periphery of tumors and decreased near the center of the tumors, which contained several poorly perfused foci. These ischemic foci often led to macroscopic necrosis at the surface, reflecting the relevance of measuring perfusion by DyFI and its diagnostic potential. Highly permeable vasculature was observed only in the restricted area of tumors [Fig. 2c]. The permeability values for tumor vasculature were comparable to those measured using other optical methods11, 12 and DCE-MRI using albumin-Gd-diethylenetriamine penta-acetic acid (DTPA).15 While vascular density and permeability were significantly increased in tumors compared to normal tissues, no significant change was observed in the mean perfusion rate. Since a broadly distributed shape was consistently observed in the histograms of tumors, we evaluated whether differences in spatial heterogeneity existed between tumors and normal tissues. Spatial heterogeneity was defined as the standard deviation of a pharmacokinetic parameter in the region of interest. For all of the pharmacokinetic parameters measured, tumors had significantly higher spatial heterogeneity compared to normal tissues (Fig. 3). Fig. 3Comparison of vascular parameters between tumors and normal tissues. (a)–(c) In tumors, vascular density and permeability were significantly elevated compared to normal tissues while perfusion was not significantly different (n = 6, Wilcoxon test). (d)–(f) spatial heterogeneity for each vascular parameter. Spatial heterogeneity is defined as the standard deviation of the parameter in the region of interest. For all pharmacokinetic parameters shown, tumors had significantly higher spatial heterogeneity than normal counterparts (n = 6, Wilcoxon test). 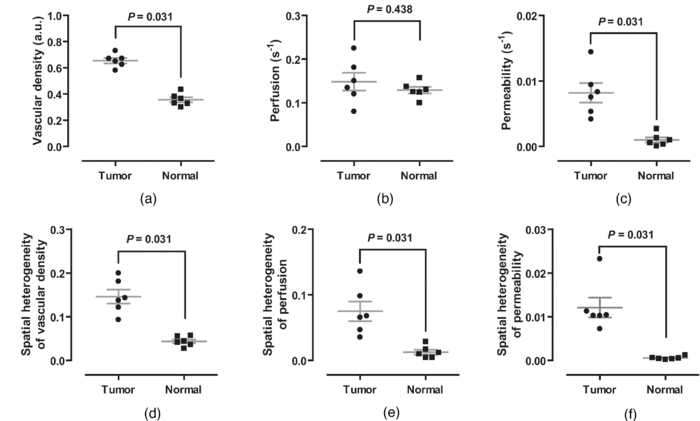 The spatially resolving, multimodal nature of DyFI allowed co-registration of the acquired pharmacokinetic maps without the need for correcting movement artifacts. Therefore, we studied whether spatial correlations exist among different pharmacokinetic parameters in tumors. Although high permeability and regional ischemia have already been reported as tumor characteristics,16 the spatial relationships between perfusion and permeability have not been elucidated. In the merged maps of perfusion and permeability, we found that the highly permeable regions co-registered with the ischemic regions [Fig. 4a]. The negative spatial correlation between perfusion and permeability was clearly demonstrated in tumors using regional analysis. When a tumor was divided into three concentric regions with the ischemic focus at the center, permeability increased significantly nearer the center, while perfusion decreased in this region [Figs. 4b and 4c]. This pattern was observed in five of six ischemic foci in five tumors. Fig. 4Negative spatial correlation between perfusion and permeability. (a) A merged map for perfusion and permeability. Green and blue indicate perfusion and permeability, respectively. Note that highly permeable regions co-registered with regions of low perfusion. (b) and (c) Spatial correlation analysis of perfusion and permeability. The tumor was divided into three concentric regions [indicated in the left picture in (b); red for region I, yellow for region II, and green for region III] and analyzed separately [Kruskal–Wallis ANOVA (compared to region I): *, P < 0.001; #, P < 0.001]. 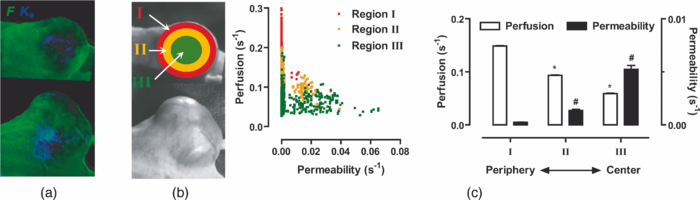 3.3.Application of DyFI for Preclinical Study of Anti-Angiogenic TherapySince DyFI was successful for measuring tumor functional vascular parameters, we addressed whether DyFI might be a useful tool for a preclinical study of anti-angiogenic therapies. We designed a preclinical study to test the short-term effects of vascular endothelial growth factor (VEGF)-Trap, a soluble decoy receptor for VEGF.17 DyFI was performed twice in each animal, and the changes in perfusion and permeability were evaluated immediately before and 2 days after a single treatment with VEGF-Trap (n = 4). Although the tumors showed no apparent changes, the spatiotemporal ICG dynamics were notably altered by treatment with the VEGF-Trap, suggesting rapid remodeling of the tumor vasculature [Fig. 5a]. The most noticeable change was permeability. For all of the treated mice, highly permeable regions in tumors almost completely disappeared within 2 days of treatment. Mean permeability levels of the treated tumors became comparable to normal tissues [Figs. 5b and 6a]. This rapid normalization in permeability was consistent with a previous study that used a multi-tyrosine kinase inhibitor to target the same VEGF signaling pathway.8 No significant change was detected in mean tumor perfusion. However, significant decreases occurred in the spatial heterogeneity of perfusion (n = 4, P = 0.022, paired t-test), reflecting redistribution of blood flow and a noticeable, but nonsignificant, decrease in the ischemic area of all tumors [Figs. 6b, 6c, 6d]. Fig. 5Rapid vascular normalization effect of VEGF-Trap on perfusion and permeability. DyFIs were performed at day 0 and day 2. VEGF-Trap was administered immediately after the first imaging. (a) Bright-field images and representative ICG dynamics. r.f.u., relative fluorescence unit. (b) Changes in the spatial profile of perfusion and permeability. Note that poorly perfused regions at day 0 became normalized after the VEGF-Trap treatment (arrows). 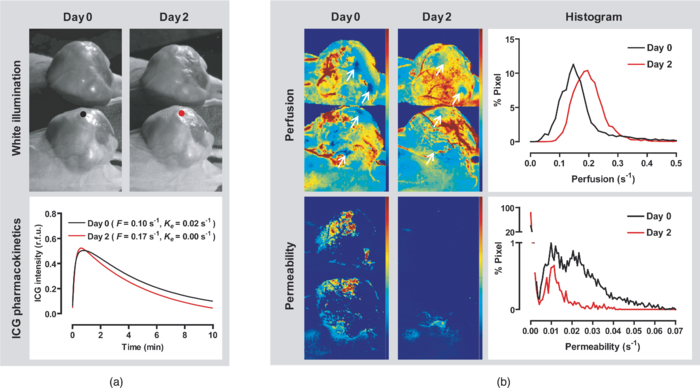 Fig. 6Quantitative analysis of the rapid vascular normalization effect of VEGF-Trap. VEGF-Trap was administered immediately after the first imaging at day 0. (a) Quantitative analysis of permeability. (b) Quantitative analysis of perfusion. (c) Quantitative analysis of spatial heterogeneity of perfusion (n = 4, paired t-test). The spatial heterogeneity of perfusion was defined as the standard deviation of the perfusion parameters in the region of interest. (d) Quantitative analysis of the ischemic area. The ischemic area was defined using three criteria (regions with perfusion rates lower than 100%, 70%, or 50% of normal counterparts). 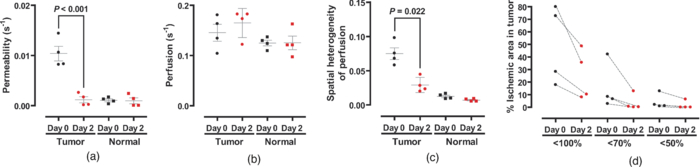 4.DiscussionIn this report, we introduced DyFI—a novel in vivo imaging tool for the simultaneous measurement of functional vascular parameters based on mathematical modeling of ICG pharmacokinetics. We applied DyFI to tumor-bearing mice, which had tumors with abnormal vasculature. With high spatial resolution, we quantitatively measured vascular heterogeneity, vascular density, and permeability to macromolecules in the tumors. Multimodality revealed a negative spatial correlation between perfusion and permeability in the tumors. The noninvasive nature of the technique allowed us to trace dynamic changes in vascular function during anti-angiogenic therapy. Notably, we demonstrated that VEGF-Trap rapidly normalized vascular permeability and redistributed blood perfusion. Although no previous report on vascular normalization by VEGF-Trap exists, this finding was in agreement with previous studies using other inhibitors targeting the same VEGF signaling pathway.8 Since vascular functions are direct physiological markers for anti-angiogenesis, DyFI is a promising tool for the preclinical development of anti-angiogenic drugs. Since perfusion and permeability are quantitative parameters with units of s−1, comparing the parameters among different individuals or between different time points of an individual is possible. However, vascular density, which is intrinsically dependent on illumination intensity, should be carefully analyzed because even with a uniform illumination field, an irregularly shaped sample could yield shaded areas. For these regions, we did not consider vascular density in the follow-up anti-angiogenesis study. In addition, changes in hemodynamic status by body temperature or anesthesia could systemically modify perfusion and permeability. In our follow-up experiments, we ruled out this possible bias by confirming the minimal variation of perfusion in normal counterparts. If significant variation in hemodynamic status occurred, normalization with the normal counterparts should be performed for comparative studies. Our mathematical model is applicable to other imaging contrast agents with the following considerations. First of all, arterial dynamics can differ between imaging agents. The arterial input function should be adjusted based on the molecule dynamics in the arterial blood. Next, excitation and emission spectrum are distinct among chromophore molecules. Since the tissue penetrability of light depends on the wavelength, the acquired parameters reflect the vascular function of different tissue thicknesses from the surface. Moreover, the permeability parameter is negatively correlated with the effective size of the molecule in the plasma.18 Accordingly, the permeability parameter should be interpreted in the context of effective hydrodynamic molecular size. Time-series ICG imaging has been performed successfully in stroke patients19 and patients with peripheral vascular disease;20 hence, we anticipate the direct clinical application of DyFI. The use of near-infrared light with clinically approved ICG allows safe and deep tissue imaging. Moreover, DyFI would likely be time and cost efficient for patients and doctors during diagnosis or repetitive evaluation of therapeutic interventions. Nonetheless, several obstacles exist for clinical use. Since DyFI is based on light reflectance with limited penetrability, development of endoscopic methods may be necessary for imaging internal organs or deep-seated tumors. Moreover, movement artifacts during imaging may be severe in awake patients. Minimizing movement during imaging or computationally compensating for movement artifacts will be challenging. AcknowledgmentsThis work was supported by a grant from the Korea Healthcare Technology R&D Project (A084215), Ministry for Health, Welfare & Family Affairs of the Republic of Korea. ReferencesJ. Folkman,
“Tumor angiogenesis: therapeutic implications,”
N. Engl. J. Med., 285
(21), 1182
–1186
(1971). https://doi.org/10.1056/NEJM197108122850711 Google Scholar
J. Folkman,
“What is the evidence that tumors are angiogenesis dependent?,”
J. Natl. Cancer Inst., 82
(1), 4
–6
(1990). https://doi.org/10.1093/jnci/82.1.4 Google Scholar
M. Klagsbrun and
M. A. Moses,
“Obituary: M. Judah Folkman (1933-2008),”
Nature (London), 451
(7180), 781
(2008). https://doi.org/10.1038/451781a Google Scholar
H. M. Verheul and
H. M. Pinedo,
“Possible molecular mechanisms involved in the toxicity of angiogenesis inhibition,”
Nat. Rev. Cancer, 7
(6), 475
–485
(2007). https://doi.org/10.1038/nrc2152 Google Scholar
R. K. Jain,
“Normalization of tumor vasculature: an emerging concept in antiangiogenic therapy,”
Science, 307
(5706), 58
–62
(2005). https://doi.org/10.1126/science.1104819 Google Scholar
K. Brindle,
“New approaches for imaging tumour responses to treatment,”
Nat. Rev. Cancer, 8
(2), 94
–107
(2008). https://doi.org/10.1038/nrc2289 Google Scholar
V. Goh, A. R. Padhani, and
S. Rasheed,
“Functional imaging of colorectal cancer angiogenesis,”
Lancet Oncol., 8
(3), 245
–255
(2007). https://doi.org/10.1016/S1470-2045(07)70075-X Google Scholar
T. T. Batchelor, A. G. Sorensen, E. di Tomaso, W. T. Zhang, D. G. Duda, K. S. Cohen, K. R. Kozak, D. P. Cahill, P. J. Chen, M. Zhu, M. Ancukiewicz, M. M. Mrugala, S. Plotkin, J. Drappatz, D. N. Louis, P. Ivy, D. T. Scadden, T. Benner, J. S. Loeffler, P. Y. Wen, and
R. K. Jain,
“AZD2171, a pan-VEGF receptor tyrosine kinase inhibitor, normalizes tumor vasculature and alleviates edema in glioblastoma patients,”
Cancer Cell, 11
(1), 83
–95
(2007). https://doi.org/10.1016/j.ccr.2006.11.021 Google Scholar
M. S. Gee, H. M. Saunders, J. C. Lee, J. F. Sanzo, W. T. Jenkins, S. M. Evans, G. Trinchieri, C. M. Sehgal, M. D. Feldman, and
W. M. Lee,
“Doppler ultrasound imaging detects changes in tumor perfusion during antivascular therapy associated with vascular anatomic alterations,”
Cancer Res., 61
(7), 2974
–2982
(2001). Google Scholar
T. Kusaka, K. Isobe, K. Nagano, K. Okubo, S. Yasuda, M. Kondo, S. Itoh, and
S. Onishi,
“Estimation of regional cerebral blood flow distribution in infants by near-infrared topography using indocyanine green,”
Neuroimage, 13
(5), 944
–952
(2001). https://doi.org/10.1006/nimg.2001.0755 Google Scholar
B. Alacam, B. Yazici, X. Intes, S. Nioka, and
B. Chance,
“Pharmacokinetic-rate images of indocyanine green for breast tumors using near-infrared optical methods,”
Phys. Med. Biol., 53
(4), 837
–859
(2008). https://doi.org/10.1088/0031-9155/53/4/002 Google Scholar
D. J. Cuccia, F. Bevilacqua, A. J. Durkin, S. Merritt, B. J. Tromberg, G. Gulsen, H. Yu, J. Wang, and
O. Nalcioglu,
“In vivo quantification of optical contrast agent dynamics in rat tumors by use of diffuse optical spectroscopy with magnetic resonance imaging coregistration,”
Appl. Opt., 42
(16), 2940
–2950
(2003). https://doi.org/10.1364/AO.42.002940 Google Scholar
T. Kitai, M. Miwa, H. Liu, B. Beauvoit, B. Chance, and
Y. Yamaoka,
“Application of near-infrared time-resolved spectroscopy to rat liver–a preliminary report for surgical application,”
Phys. Med. Biol., 44
(8), 2049
–2061
(1999). https://doi.org/10.1088/0031-9155/44/8/314 Google Scholar
V. Ntziachristos, A. G. Yodh, M. Schnall, and
B. Chance,
“Concurrent MRI and diffuse optical tomography of breast after indocyanine green enhancement,”
Proc. Natl. Acad. Sci. U.S.A., 97
(6), 2767
–2772
(2000). https://doi.org/10.1073/pnas.040570597 Google Scholar
A. R. Padhani,
“Dynamic contrast-enhanced MRI in clinical oncology: current status and future directions,”
J. Magn. Reson. Imaging, 16
(4), 407
–422
(2002). https://doi.org/10.1002/jmri.10176 Google Scholar
B. Q. Zhu, C. Heeschen, R. E. Sievers, J. S. Karliner, W. W. Parmley, S. A. Glantz, and
J. P. Cooke,
“Second hand smoke stimulates tumor angiogenesis and growth,”
Cancer Cell, 4
(3), 191
–196
(2003). https://doi.org/10.1016/S1535-6108(03)00219-8 Google Scholar
J. Holash, S. Davis, N. Papadopoulos, S. D. Croll, L. Ho, M. Russell, P. Boland, R. Leidich, D. Hylton, E. Burova, E. Ioffe, T. Huang, C. Radziejewski, K. Bailey, J. P. Fandl, T. Daly, S. J. Wiegand, G. D. Yancopoulos, and
J. S. Rudge,
“VEGF-Trap: a VEGF blocker with potent antitumor effects,”
Proc. Natl. Acad. Sci. U.S.A., 99
(17), 11393
–11398
(2002). https://doi.org/10.1073/pnas.172398299 Google Scholar
F. Yuan, M. Dellian, D. Fukumura, M. Leunig, D. A. Berk, V. P. Torchilin, and
R. K. Jain,
“Vascular permeability in a human tumor xenograft: molecular size dependence and cutoff size,”
Cancer Res., 55
(17), 3752
–3756
(1995). Google Scholar
J. Woitzik, P. G. Pena-Tapia, U. C. Schneider, P. Vajkoczy, and
C. Thome,
“Cortical perfusion measurement by indocyanine-green videoangiography in patients undergoing hemicraniectomy for malignant stroke,”
Stroke, 37
(6), 1549
–1551
(2006). https://doi.org/10.1161/01.STR.0000221671.94521.51 Google Scholar
Y. Kang, J. Lee, K. Kwon, and
C. Choi,
“Application of novel dynamic optical imaging for evaluation of peripheral tissue perfusion,”
Int. J. Cardiol., 145
(3), e99
–e101
(2009). https://doi.org/10.1016/j.ijcard.2008.12.166 Google Scholar
|


