|
|
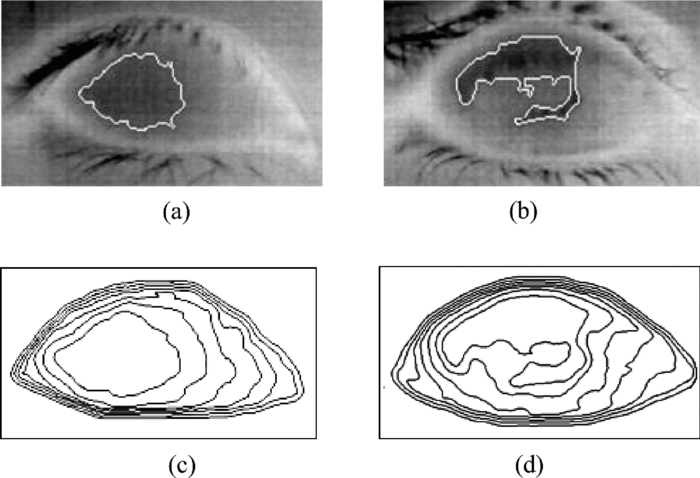
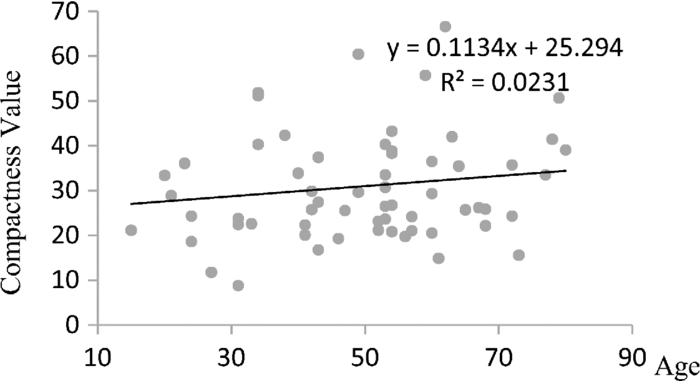
1.IntroductionTear film provides lubrication and constant moisture to maintain vision and comfort of the eye. The outer layer of the tear film is a lipid layer preventing excessive tear evaporation and maintaining lubrication of the eye. A person may experience dry eye symptoms when an imbalance occurs in the tear film system or the tear film cannot remain continuous between blinks.1 The clinical diagnosis of dry eye syndrome is based on measuring the amount of tear production and tear film stability. Schirmer's test with anesthesia (STA) is the most widely used method in tear production measurement. The test is performed by placing filter paper inside the lower lid of the eye to measure the volume of tear production over a 5 min period. In tear film stability measurement, the fluorescent break-up time (FBUT) method applies fluorescent sodium drops onto the ocular surface and measures the time required for the tear film to break. Therefore, both STA and FBUT tests are invasive methods which cause discomfort for patients. Over the past 15 years, researchers have been using an IR thermal image to observe ocular surface temperature (OST) and tear film stability as noninvasive means.2, 3 Ocular surface temperature is mainly affected by tear film stability4, 5 and the tear film instability is one of the major causes of dry eye symptoms.6, 7 Studies have observed that the dry eye group renders a greater temperature decrease in the OST than the control group;8, 9 the greater rate of cooling in the dry eye group is the direct result of excessive tear evaporation.10 In a later study, an opposite finding was reported that dry eye patients had a smaller temperature decrease in the OST.11 Conversely, the patterns of the IR thermal images of the dry eye group appear more irregular and unstable than those of the normal eye group.10, 12, 13, 14 A recent study shows that the temperature profiles across normal eyes is smoother than those of dry eyes.15, 16 However, the irregularity in the IR thermal image of the tear film has not been quantitatively studied. This study developed a custom designed IR thermal image system to noninvasively measure both temporal variation of the OST and spatial variation of thermal images of the tear film to distinguish between the dry and normal eye groups. 2.Methods2.1.SubjectsThe experimental program was approved by the Institution Review Board of the Taipei Veterans General Hospital and the Far Eastern Memorial Hospital. Informed consent was obtained from each participant prior to the procedure. Subjects with signs of ocular surface abnormalities, contact lens and tear drop usage, past ocular surface surgery, and fluorescein allergy were excluded from this study. All participants were first measured by the IR thermal image system prior to the STA and FBUT tests. In this study, the normal group (47 eyes) was composed of the subjects with tear volume larger than 5 mm over a period of 5 min in the STA test and stable tear film conditions for more than 10 s in the FBUT test. The dry eye group (76 eyes) was classified when the subjects had both STA and FBUT test results smaller than 5 mm over a period of 5 min and shorter than 10 s, respectively. After the FBUT and STA selection, the average age of the normal eye group was 34, ranging from 20 to 52. The average age of the dry eye group was 49, ranging from 15 to 80. 2.2.EquipmentAn uncooled room temperature operating microbolometer sensor (BOEINGU3000A, DRS Sensors & Targeting Systems, USA) was applied to capture the thermal images. The resolution of the detector is 320 (H)×240 (V) pixels, with spatial resolution of 51×51 (μm2). The noise equivalent temperature difference of this image system is 0.07°C and the measurement accuracy is 0.1°C. The IR imaging lens is formed by two aspherical Germanium lenses with a 31 mm focal length; the F-number (aperture value) is 1.4 and the field of view is 18° (H)×14° (V). The lens transmits infrared spectrum of 8 to 12 μm. 2.3.Measurement ConditionsAll participants were required to take 10 minutes rest in the examination room before the OST was recorded. The room temperature and humidity were monitored and controlled within 22±1°C and 60±5%, respectively. The measurements were conducted during hospital working hours, from 9 am to 5 pm. During the measurement, participants were asked to close their eyes for 2 s and then open then for 6 s. The forehead and the chin of the participants were placed against a measuring bracket so that the geometric center of the cornea could be aligned with the IR thermal camera. The ocular thermal images were captured and analyzed at 30 Hz frame rate using a custom-designed computer program in MATLAB (MATLAB Software, The MathWorks, Inc.). A series of ocular thermal images from a. normal and b. dry eye participants were displayed at 1 s intervals, as shown in Fig. 1. The light color indicates a higher temperature area while the dark color indicates a lower temperature area. The OST was recorded with a dynamic range of 3.6°C. The average temperature was set at the gray level of 127 in 0 to 255 gray level. The temperature ±1.8°C above or below the average temperature of the region of interest (ROI) was set at the gray level of 255 and 0, respectively, as shown in Fig. 1c. The line scan temperature profiles of a normal and dry eye recorded at the 6th second after the eye opened are shown in Fig. 1d. 2.4.Region of InterestThe OST measuring area was defined by a ROI selection method. The selection was based on the equations of the eye template method.17 The ROI was surrounded by four curves, y 13, y 32, y 42, and y 14, as shown in Fig. 2. The curve of y i j is defined as: y ij = a – (a/b 2) x 2, where the “a” and “b” mark the horizontal and vertical apex coordinates respectively. The four apex points P1-P4 were manually set by the operator to exclude the influence from the eyelashes. Fig. 2ROI defining the area of the Ocular Surface Temperature OST of the tear film is determined by four curves y 13, y 32, y 42 and y 14 connected between four manually set apexes P1—P4.  The manual setting for points P1-P4 is a straightforward approach on the ocular thermal image. Points P3 and P4 were first set on the top and bottom of the eye, immediately below and above the eyelashes. Then P1 and P2 points were set on the left and right corner of the eye, to avoid line y ij contacting the eyelashes. These four points can be set repeatedly to cover the ocular surface. 2.5.Temperature Difference Value (TDV)The first analysis involved measuring the temporal variation of the average OST in the ROI during an eye-open period. The eye was first closed for 2 s and then open for 6 s during the measurement. Figure 3 shows the change in the average OST of a normal eye subject during a 6 s eye-open period. The amount of the temperature difference value (TDV) was defined by: TDV = TOP – TCL, where TOP is the spatially averaged OST when the eye is fully open. TCL represents the spatially averaged OST after the eye is open for 6 s. 2.6.Compactness ValueThe second analysis involved measuring the spatial variation of the OST during a 6 s eye-open period. The compactness value (CV) was used to quantize the irregularity of the relative-lower-temperature-area. A series of image processing steps was applied for obtaining the area and the perimeter of the relative-lower-temperature-area, as shown in Fig. 4. The image was first selected by the ROI method, then enhanced using an image contrast stretching method by mapping the range of the gray level from [0, 100] to [0, 255] and applying a power law transformation s = r γof degree γ = 3, where s is the output gray level, γ is the power of power law transformation and r is the input gray level. The power law transformation enhanced the relative-lower-temperature-area of the image, as shown in Fig. 4b. Then the image was edge sharpened by the Laplacian operator, as shown in Fig. 4c. The image was further filtered by a median filter (3×3) and converted to a binary image with the threshold of 100, as shown in Fig. 4d. Dilation and erosion algorithms were applied to remove small regions and reconnect them to a larger region, as shown in Fig. 4e. The region of the relative-lower-temperature-area was obtained, as shown in Fig. 4f. Then the area of a region is defined as the number of pixels in the region, the perimeter of a region is defined as the number of pixels on its boundary. Fig. 4Image processing steps for obtaining the area and perimeter of the relative-lower-temperature-area. (a) Original IR thermal image; (b) contrast stretching and power-law transformation; (c) Laplacian operator; (d) median and binary filters; (e) dilation and erosion algorithms; (f) the contour of the relative-lower-temperature-area overlay on the original thermal image.  The compactness value of the relative-lower-temperature-area was defined as perimeter2/area. A series of five IR images, recorded between 5.9 to 6 s, after the eye was open, were chosen to calculate the compactness values. The final compactness value was averaged from these five individual CVs. Figures 5a, 5b show the contour of the relative-lower-temperature-area of a normal and dry eye. The CV was 16 for the normal eye and 59 for the dry eye. In Fig. 5c, the black lines represent the equal temperature boundary of the normal eye. The boundary was smooth and roundish. Figure 5d shows the equal temperature boundary of the dry eye and the more irregular boundary. 3.ResultsThe two parameters, TDV and CV, were plotted on a scatter plot in Fig. 6. For the dry eye group, the average of the TDV during the eye-open period was 0.75 ± 0.24°C (mean ± SD), and for the normal eye group the TDV was 0.48 ± 0.18°C. The difference in the TDV of the two groups is statistically significant (P<0.0001). In the compactness measurement, the CV of the relative-lower-temperature-area of the OST after the eye was open for 6 s was calculated. For the dry group, the CV was 31.5±12.6 (mean ± SD), and for the normal eye group the CV was 16.1±17.6. The difference in the CV is statistically significant (P<0.0001), as well. In Fig. 6, the normal and dry eye groups are distinguished by a linear discriminant analysis function, 67C + T = 67, in which T and C represent the parameters of TDV and CV, respectively. Fig. 6The scatter plot of the TDV and compactness CV for the normal and dry eye groups and the threshold of the linear discriminant function. 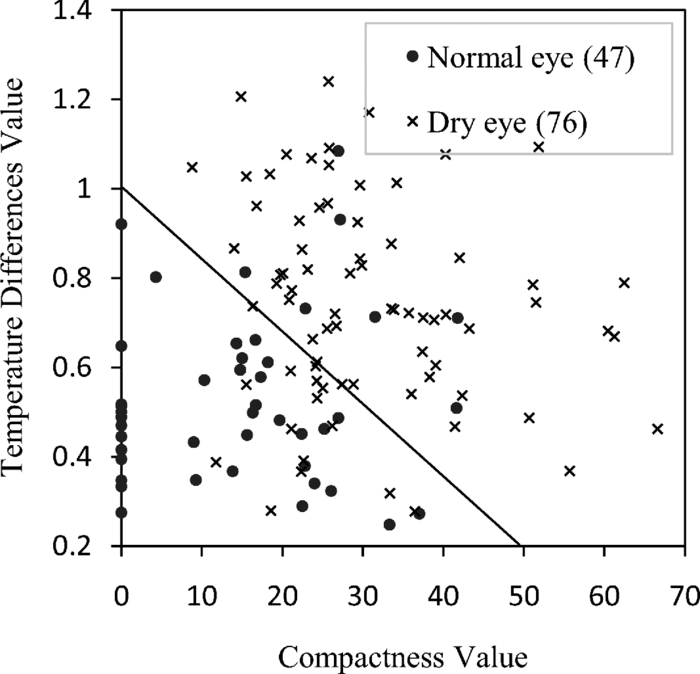 Three receiver operating characteristic (ROC) curves were obtained using TDV, CV, and the combination of TDV and CV, as shown in Fig. 7. The most efficient discrimination result was obtained by the combination of TDV and CV, the sensitivity was 0.84, specificity was 0.83, and the ROC area was 0.87. The result shows a strong correlation between dry eye syndrome and the TDV and CV parameters. Fig. 7Three ROC curves for dry eye diagnosis were obtained using TDV, CV, and the combination of TDV and CV.  The correlation plots (Figs. 8, 9) illustrate a linear regression of CV versus age of the subjects, and TDV versus age of the subjects, respectively, in the dry eye group. Figures 8, 9 show the R2 value of the correlation between the age and CV was 0.023 for the age and TDV was 0.03. 4.DiscussionThis study developed a noncontact IR thermal image system for the assistive diagnosis of dry eye syndrome. Two parameters, the TDV and the CV, were developed for evaluating dry eye syndrome. In the dry eye group, both the TDV and CV were significantly higher than those of the normal eye group. The observation of a larger TDV in the dry eye group may be attributed to a greater amount of tear evaporation. Excessive tear evaporation is expected to occur under the tear film break condition. The larger tear film break area results in a greater amount of tear evaporation and a larger TDV. Compared to the FBUT and STA, a shorter measurement period of 6 s was adopted in this study. The advantage of using a shorter measurement period is apparent since it is uncomfortable for most dry eye patients to keep their eyes open. The shorter measurement time can also reduce the reflex tearing, which could influence the measurement of the IR thermal image system. The CV was a useful quantitative parameter for evaluating the irregularity of the relative-lower-temperature-area of the tear film. The contour of the relative-lower-temperature-area is an equal temperature boundary. In Fig. 5a, a normal eye has a smooth form of the equal temperature boundary at the center of the eye. The temperature gradient is smooth and results in a roundish equal temperature boundary. When the tear film is abnormal, it affects the rate of evaporation in some areas of the ocular surface. This disrupts the temperature gradient of the ocular surface, as shown in Fig. 5b. The boundary of the relative-lower-temperature-area was smoother and roundish in the normal eye group than in the dry eye group. The physiological implications of CV relates to the instability of the tear film during the tear evaporation process. For normal eyes, the tear film is stable, and the variation in OST is small and smooth during the evaporation process; the CV was relatively small. For dry eyes, the instability in the tear film results in a larger degree of variation in the OST during the evaporation process. The CV was relatively large for dry eye patients. The original relative-lower-temperature-area was blurred before the image processing steps. The image process steps were implemented to enhance the area and reconnect the scattered pieces together to a larger area. This approach is superior to a threshold method, which may result in scattered and unconnected relative-lower-temperature-areas that is not suitable for calculating the CV. The relative-lower-temperature-area method enhanced the [−1.8, −0.4] °C region below the average temperature of the ROI. The selection of the temperature region below the average temperature was to extract the area with excessive tear film evaporation. The [−1.8, −0.4] °C region corresponds to the [0, 100] of the 256 gray level range. The rationale for choosing a larger temperature measurement range was based on operator convenience and visualization purposes. Additionally, this range also provides adequate temperature resolution, 3.6 / 256 = 0.014 (°C/gray level), for image recording and further processing purposes. The CV does not correlate to the size of the relative-lower-temperature-area; conversely, it correlates to the irregularity of the relative-lower-temperature-area and the instability of the tear film during the tear evaporation process. We noticed that 14 out of 36 normal eye subjects had 0 CV, indicating that the tear film was stable and with less temperature variation even after the eye had been open for 6 s. The 0 CV was caused by the absence of the relative-lower-temperature-area. Thus, the absence of the relative-lower-temperature-area also indicated a stable tear film condition. In addition, the reason for choosing the 6 s thermal images after the eye had been open was because the FBUT test usually requires less than 6 s to detect the dry eye symptoms. We observed the existence of a 0.8 °C temperature-valley in the line scan temperature profile of the OST of a dry eye subject, as shown in Fig. 1d. The relative-lower-temperature-area may be verified by the coherent recording with both the tear lipid layer interference image system and the IR thermal image system to verify further whether the area matches with the thin area of the tear film. In Fig. 6, the combination of the TDV and CV exhibits a linear discriminate function for classifying the normal and dry eye group. This observation demonstrates that the degree of variation in the dry eye syndrome is quite complicated. Although both the mean TDV and CV for the normal eye group were smaller than the dry eye group, the standard deviation of these two parameters was still quite large. A single parameter cannot completely classify the normal and dry eye group. Therefore, using the combination of the TDV and CV achieved the most efficient discrimination results, as shown in Fig. 7. A current ophthalmology instrument, Keelar TearScope-Plus (Keeler Inc., Windsor, Berkshire, UK), examines the thickness of the lipid layer of the tear film and measures the noninvasive tear break-up time (NIBUT). A short NIBUT indicates that the tear film is instable. In other words, a longer NIBUT indicates a thicker lipid layer and a lower degree of tear evaporation. Conversely, the new parameter, the CV, quantifies the irregularity of the relative-lower-temperature-area, relating to the excessive evaporation area of the tear film. Both of these parameters represent the stability of the tear film; NIBUT is a temporal indicator and CV is a spatial indicator. Dry eye syndrome might be affected by physiological conditions at different times of the day. However, all the measurements including FBUT, Schirmer's test, and IR measurements were conducted within 1 h of the day during hospital working hours. This arrangement could minimize the influence of the physiological condition. Aging is one of the main causes of abnormal tear film and dry eye syndrome. The elderly have a higher occurrence rate in developing dry eye syndrome. In this study, age difference in the normal and dry eye group may partially reflect this age-related syndrome. The correlation plots (Figs. 8, 9) demonstrate a slight correlation between age and CV and TDV of the dry eye group. These results indicate that the CV and TDV were slightly related to the aging problem. The custom designed IR thermal image system is different from other thermograph instruments. The current system consists of a specially designed IR lens system with a close-up working distance, smaller dynamic range of 3.6 °C in temperature measurement, and custom designed image processing programs. The system contains a framework to support the cheek to a fixed position, which stabilizes the eye and the camera. 5.ConclusionsIn conclusion, this study developed a noncontact IR thermal image system for facilitating dry eye diagnosis. In particular, the TDV parameter describes the degree of temperature change on the tear film and the CV represents the degree of tear film stability over a 6 s eye-open period. By combining these two parameters, a linear discriminant function for distinguishing the dry eye and normal eye group was established. The sensitivity is 0.84, the specificity is 0.83, and the ROC area is 0.87. Further development of this IR thermal image system may lead to the implementation of a noncontact dry eye diagnostic system that can alleviate the discomfort and inconvenience one may experience in conventional clinical dry eye diagnosis. ReferencesJ. P. Whitcher,
“Clinical diagnosis of the dry eye,”
Int. Ophthalmol. Clin., 27
(1), 7
(1987). https://doi.org/10.1097/00004397-198702710-00003 Google Scholar
J. H. Tan, E. Y. K. Ng, U. R. Acharya, and
C. Chee,
“Infrared thermography on ocular surface temperature: A review,”
Infrared Phys. Technol., 52
(4), 97
–108
(2009). https://doi.org/10.1016/j.infrared.2009.05.002 Google Scholar
J. H. Tan, E. Y. K. Ng, and
U. R. Acharya,
“Automated study of ocular thermal images: Comprehensive analysis of corneal health with different age group subjects and validation,”
Digit, Signal Process., 20
(6), 1579
–1591
(2010). https://doi.org/10.1016/j.dsp.2010.03.014 Google Scholar
C. Purslow and
J. Wolffsohn,
“The relation between physical properties of the anterior eye and ocular surface temperature,”
Optom. Vision Sci., 84
(3), 197
–201
(2007). https://doi.org/10.1097/OPX.0b013e3180339f6e Google Scholar
J. H. Tan, E. Y. K. Ng, and
U. R. Acharya,
“Evaluation of tear evaporation from ocular surface by functional infrared thermography,”
Med. Phys., 37
(11), 6022
(2010). https://doi.org/10.1118/1.3495540 Google Scholar
M. A. Lemp, C. Baudouin, J. Baum,
“The definition and classification of dry eye disease: Report of the definition and classification subcommittee of the international dry eye workshop (2007),”
The Ocular Surface, 5
(2), 75
–92
(2007). Google Scholar
E. Hosaka, T. Kawamorita, Y. Ogasawara, N. Nakayama, H. Uozato, K. Shimizu, M. Dogru, K. Tsubota, and
E. Goto,
“Interferometry in the evaluation of precorneal tear film thickness in dry eye,”
Am. J. Ophthalmol., 151
(1), 18
–23
(2010). https://doi.org/10.1016/j.ajo.2010.07.019 Google Scholar
P. B. Morgan, A. B. Tullo, and
N. Efron,
“Ocular surface cooling in dry eye — a pilot study,”
J. British Contact Lens Association, 19
(1), 7
–10
(1996). https://doi.org/10.1016/S0141-7037(96)80018-8 Google Scholar
H. K. Chiang, C. Y. Chen, H. Y. Cheng, K. H. Chen, and
D. O. Chang,
“Development of infrared thermal imager for dry eye diagnosis,”
Infrared and Photoelectronic Imagers and Detector Devices II, ,
(2006). Google Scholar
W. Mathers,
“Evaporation from the ocular surface,”
Exp. Eye Res., 78
(3), 389
–394
(2004). https://doi.org/10.1016/S0014-4835(03)00199-4 Google Scholar
A. Mori, Y. Oguchi, Y. Okusawa, M. Ono, H. Fujishima, and
K. Tsubota,
“Use of high-speed, high-resolution thermography to evaluate the tear film layer,”
Am. J. Ophthalmol., 124
(6), 729
–735
(1997). Google Scholar
P. B. Morgan, A. B. Tullo, and
N. Efron,
“Infrared thermography of the tear film in dry eye,”
Eye, 9
(5), 615
–618
(1995). Google Scholar
J. P. Craig, I. Singh, A. Tomlinson, P. B. Morgan, and
N. Efron,
“The role of tear physiology in ocular surface temperature,”
Eye, 14
(4), 635
–641
(2000). Google Scholar
J. H. Tan, E. Y. K. Ng, and
U. R. Acharya,
“An efficient automated algorithm to detect ocular surface temperature on sequence of thermograms using snake and target tracing function,”
J. Med. Syst., 1
–10
(2010). https://doi.org/10.1007/s10916-010-9552-6 Google Scholar
U. R. Acharya, E. Y. K. Ng, G. C. Yee, T. J. Hua, and
M. Kagathi,
“Analysis of normal human eye with different age groups using infrared images,”
J. Med. Syst., 33
(3), 207
(2009). https://doi.org/10.1007/s10916-008-9181-5 Google Scholar
J. H. Tan, E. Y. K. Ng, U. R. Acharya, and
C. Chee,
“Study of normal ocular thermogram using textural parameters,”
Infrared Phys. Technol., 53
(2), 120
–126
(2010). https://doi.org/10.1016/j.infrared.2009.10.006 Google Scholar
A. Yuille, P. Hallinan, and
D. Cohen,
“Feature extraction from faces using deformable templates,”
Int. J. Comput. Vis., 8
(2), 99
–111
(1992). https://doi.org/10.1007/BF00127169 Google Scholar
|