|
|
1.IntroductionDiffuse optical tomography (DOT) in the near infrared (NIR) spectrum provides a unique approach for functional diagnostic imaging.1, 2, 3, 4, 5, 6 However, the primary limitation of DOT is related to the intense light scattering in tissue that dominates NIR light propagation and makes three-dimensional localization of lesions and accurate quantification of lesion optical properties difficult. Recently, diffuse optical tomography guided by coregistered ultrasound (US), MRI, and x ray has demonstrated a great clinical potential to overcome lesion location uncertainty and to improve light quantification accuracy.2, 4, 5 In the coregistration approach, spatial a priori information about a suspicious lesion is detected using a nonoptical high-resolution imaging system and used to guide DOT image reconstruction.4 However, due to the different contrast mechanisms, some lesions may not be detectable by a nonoptical modality but yet have high optical contrast. In the presence of multiple targets within a region of interest (ROI), accurate characterization of true absorptive features becomes difficult without guidance based upon higher resolution optical contrast. Photoacoustic spectroscopy and tomography is a rapidly growing field. In photoacoustic imaging, a short-pulsed laser beam diffusively penetrates into the tissue sample. 7, 8, 9, 10, 11, 12, 13, 14, 15, 16, 17, 18, 19, 20, 21 This irradiation causes a transient temperature rise and subsequent thermoelastic expansion that generates photoacoustic waves. These waves can be detected with wideband ultrasound transducers. The acquired photoacoustic waves are used to reconstruct, at ultrasound resolution, the optical absorption distribution that reveals optical contrast. By providing high-resolution imaging of optical contrast, photoacoustic tomography (PAT) can serve as an excellent complementary modality for improving the quantification accuracy of DOT. Several groups have investigated the use of quantitative PAT as a stand-alone optical imaging modality with finite element light diffusion forward models,22, 23, 24 iterative inversion techniques,25, 26, 27, 28 and phantoms of known optical properties to calibrate the sensitivity and directivity of the ultrasound transducer.29, 30 The robustness of the optical property quantification using this technique however is complicated due to several factors: the ultrawideband photoacoustic frequency response, dependencies on the orientation, size, and shape of the targets with respect to the ultrasound receiving aperture, uniformity of the light illumination, and uncertainty in optical parameters such as scattering not provided by the photoacoustic measurement.29, 31 Diffused light measurements have recently been applied as an adjunct modality to solve the latter problem and determine information on the light illumination and background optical properties.32, 33 In this paper, we present a new PAT-guided DOT approach that utilizes qualitative or relative target absorption maps detected by PAT to guide the selection of a single or multiple ROIs for quantitative DOT image reconstruction of optical properties for one or more targets. This hybrid approach combines the advantages of PAT and DOT and has a great potential to provide optical detection and characterization of deeply-seated tumors. 2.Methods2.1.Experimental Systems2.1.1.Photoacoustic imaging systemFigure 1 shows the experimental configuration of the PAT-guided DOT study. A Ti:Sapphire (Symphotics TII, LS-2134) laser optically pumped with a Q-switched Nd:YAG laser (Symphotics TII, LS-2122) delivered 10 ns pulses at 15 Hz. The laser output was coupled into two optical fibers using a convex lens and circular beam splitter arrangement as shown in Fig. 1. The convex lens, which has 99% transmittance at 700 nm wavelength, has a focal length of 20 cm and focuses the light into the pair of fibers that are placed at its focal point. The beam splitter was used to split the incoming beam into two beams, one for each fiber. It was measured to have a 60% transmitting and 36% reflecting split ratio for horizontally polarized light at the 700 nm that was used for the experiment. The overall coupling efficiency of the setup (including the losses in the lens and beam splitter) was about 85%. The two output ends of the fibers were then mounted on opposite (longitudinal) sides of a low-frequency linear ultrasound transducer described below and used for photoacoustic imaging. Fig. 1Experimental configuration of the PAT setup coregistered with the DOT system. The DOT system consists of four laser diodes, 14 detectors, and data processing electronics integrated into a box, and interfaced with a computer for performing image reconstruction.  The electronics of the photoacoustic imaging system consists of 64-channel receiving circuits. Signals from 64-array elements are individually amplified by 20 dB and multiplexed to two parallel channels for further amplification, low pass filtering, and analog-to-digital (A/D) conversion. The second stage electronics consists of dual-channel two-stage variable gain amplifiers (Analog Devices AD604), 10 MHz low pass filters (Mini-Circuits SCLF-10), and 12-bit analog-to-digital converters running at 50 MS/s. The A/Ds are connected to a National Instruments PCI-DIO-32HS high-speed digital I/O card, which controls and receives the digitized data. The system is controlled with a custom C-language software on the host computer through the two digital I/O cards. Due to the multiplexing, 32 laser firings are required to generate a single 64-channel capture. Because the Ti:Sapphire laser has 15 Hz pulse repetition rate, the acquisition rate is about one frame every 5 s. Images were reconstructed using the delay-and-sum beamforming algorithm, which provided similar imaging quality as the model-based backprojection algorithm mainly because of the limited receiving aperture. Clinically, DOT has demonstrated the capability to detect tumors of 1 cm or larger in extent. Because of the large target size, a low-frequency ultrasound transducer was employed to maximize the sensitivity of the system. The piezocomposite transducer, produced by Vermon (France), consisted of 64 elements with 0.85 mm pitch. The center frequency of the transducer is 1.3 MHz with a 6 dB response from 500–1800 kHz. An integrated acoustic lens with 25 mm focal length increases sensitivity at imaging depths for which the optical fluences are low. Figure 2 depicts the amplitude frequency response of the photoacoustic system along with the theoretical spectra for uniformly absorbing spheres with radii of 1, 5, and 10 mm. The spectra were obtained from FFT of the expressions derived by Diebold 34 The center frequency and bandwidth of the mainlobe of the 1-mm-diameter sphere match the transducer response well. In contrast, the 10-mm-diameter sphere possesses a narrower spectrum located near the low-frequency edge of the transducer response. As a result, the system exhibits sensitivity only to the edges for objects with dimensions greater than 1 mm. 2.1.2.Frequency domain DOT system and imaging reconstructionThe DOT system used for the experiment was a frequency-domain imager consisting of four laser diodes emitting at 740, 780, 808, and 830 nm wavelengths. Since phantom targets were used in the study and the multiwavelength imaging was not a concern, only 780 nm wavelength was used to demonstrate the PAT guided DOT approach. The outputs of these laser diodes were coupled into nine fibers via a 4×1 and a 1×9 optical switches.4 The nine source fibers were then deployed around the PAT/DOT probe in an arrangement as shown in Fig. 3. On the receiving side, fourteen 3 mm-diameter fiber bundles were used to couple reflected light from the target to 14 photomultiplier tubes (PMTs). Light from the source fibers was sequentially delivered to the target, but the received light was detected in parallel by the PMT detectors. Semi-infinite partial reflection boundary condition with an effective refraction coefficient of 0.6 was used for the DOT image reconstruction. The measured scattered field used for the optical imaging reconstruction was the difference between measurements obtained from a 0.5–0.7% intralipid solution and a target immersed inside and located at various depths. The calibrated optical absorption (μa) and reduced scattering coefficient ( [TeX:] $\mu _s^\prime $ ) of the intralipid solution used in the experiment were in the ranges of 0.01–0.02 cm−1 and 5–7 cm−1. To compare the improvement of PAT-guided reconstruction to reconstruction with no a priori target information and depth-only guidance, we reconstructed targets using three procedures, namely: 1. no a priori target location information, 2. target depth only, and 3. PAT-guided reconstruction using target depth and twice the target size as measured from PAT images. In PAT-guided reconstruction, the dual-zone mesh optical imaging algorithm that we developed earlier was modified for reconstructing the target optical properties.6 Briefly, the entire imaging volume was segmented into a target region or two-target regions (ROIs), and a background region; this segmentation was based on the target absorption map provided by the high-resolution PAT. The center region of each target was then precisely determined from the reconstructed photoacoustic image in the lateral (x) dimension, depth (z), as well as a region twice the size of the target diameter. Because the photoacoustic images provided only 2-D information, the target center in the y dimension was assumed to be on the same ultrasound transducer plane at y = 0. The center locations in the x and y directions measured by PAT were slightly perturbed in the DOT reconstruction in order to obtain an improved convergence as measured by the object function. Because of the intense light scattering, the target size seen by DOT was much larger than its actual size. A ROI twice the target size was necessary for avoiding boundary distortion in reconstructed DOT images. A finer grid of 0.2×0.2×0.5 (cm3) was chosen for the target region and a coarse grid of 1.5×1.5×1.0 (cm3) was used for the background region. The total imaging volume was chosen to be 12×12×4 (cm3). This multiple-ROIs scheme significantly reduced the total number of voxels with unknown optical properties and dramatically improved the convergence of inverse mapping of target optical properties. 2.2.Hybrid ProbeFigure 3 presents a close-up photograph of the hybrid PAT/DOT probe. The transducer occupies the central slot with the two PAT optical fibers straddling the transducer on both sides. The transducer was painted white to reduce the front-face light absorption that may generate unwanted photoacoustic signals. The nine DOT source fibers and 14 detector fiber bundles are arranged nearly symmetrically on both sides of the probe in a pattern that provides a distribution of source-detector pair distances from 1.5–7 cm. The probe, made from transparent plexiglas, measured 9 cm in diameter and 1 cm in height and was covered with aluminum foil at the bottom. This organization, coupled with the partial reflection probe boundary, enabled optimized imaging for targets ranging from 1–3 cm in depth suitable for breast imaging in reflection geometry. 2.3.PhantomsOne centimeter-cubical soft absorbers of higher (μa = 0.25 cm−1) and lower (μa = 0.08 cm−1) optical contrast representative of typical malignant and benign lesion optical properties served as more realistic soft tissue targets. The soft absorbers were made of polyvinyl chloride plastisol35 and the calibration was performed on a larger piece of 10 cm × 10 cm × 5 cm phantom using the DOT system. 3.Results3.1.Single Target ImagingA 1 cm-cubical absorber of higher (μa = 0.25 cm−1) and another of lower (μa = 0.08 cm−1) optical contrast were used as soft tissue targets and placed inside intralipid of calibrated optical properties of μa = 0.02 cm−1 and [TeX:] $\mu _s^\prime $ = 6.9 cm−1, and imaged. Figures 4a1, 4a1, 4a2, 4a3, 4a4, 4b1, 4b2, 4b3, 4b4, 4c1, 4c2, 4c3, 4c4, 4d1 show the PAT images of the higher contrast target with its center located at 1.5, 2.0, 2.5, and 3 cm depth, respectively, from the transducer. The high-resolution PAT images clearly delineate the front and back face of the target. Without any a priori information about the target location, the reconstructed DOT absorption maps shown in Figs. 4a2, 4a3, 4a4, 4b1, 4b2, 4b3, 4b4, 4c1, 4c2, 4c3, 4c4, 4d1, 4d2 fail to provide target location and contrast. However, if the target depth is available, the reconstructed absorption maps, given in Figs. 4a3, 4a4, 4b1, 4b2, 4b3, 4b4, 4c1, 4c2, 4c3, clearly show the target location and the quantification accuracy has reached 39–48% for a target located from 1.5–2.5 cm depth. The maximum reconstructed absorption coefficient is used to quantitatively evaluate the reconstruction accuracy. Although the quantification accuracy is only 25% when the target is located deeper at 3 cm as shown in Fig. 4d3, the target is reconstructed at the correct depth and is visible. With the precise guidance of the PAT target location and size, the reconstructed DOT absorption maps shown in corresponding Figs. 4a4, 4c1, 4d1, 4d2, 4d3, 4d4 further improved target quantification by 22% on average. The reconstructed maximum target absorption coefficient and quantification accuracy are given in Fig. 5. Figures 6a1, 6a2, 6a3, 6a4, 6d1 show the PAT images of the lower-contrast target whose center is located at 1.5, 2.0, 2.5, and 3 cm depth, respectively, from the probe. The contrast of the PAT images was not as good as that of the higher contrast one. However, the front and back faces of the target were fairly well resolved. Without any a priori target information, the reconstructed DOT absorption maps shown in Figs. 6a2, 6b1, 6c1, 6d1, 6d2, 6d3, 4d4 cannot resolve the target location and provide a poor contrast from the background. With the target depth information, the reconstructed absorption maps, given in Figs. 6a1, 6a2, 6a3, 6a4, 6d1, 6d2, 6d3, clearly show the target location and the quantification accuracy has reached 51–60% for a target located from 1.5–2.5 cm depth and 27% for a target located at 3 cm depth. With the precise PAT guidance on target location and size, the reconstruction accuracy has reached 76–99% for a target located from 1.5–2.5 cm, and 65% for a target located at 3 cm depth [Figs. 6a4, 6d1, 6d2, 6d3, 6d4]. The reconstructed maximum target absorption coefficient quantification accuracy is shown in Fig. 7. Clearly, a priori spatial information from PAT provides a significant improvement in the absorption coefficient quantification accuracy. Fig. 4Experimental results of the higher-contrast 1 cm cubical phantom target. (a1)–(d1) PAT images of the target (shown inside the circled regions) with center located at 1.5, 2, 2.5, and 3 cm depths, respectively. The x-axis of the PAT images is the lateral dimension in x (mm), and vertical axis is the depth in z (mm). (a2)–(d2) Corresponding absorption maps reconstructed without using any a priori information. (a3)–(d3) Corresponding absorption maps reconstructed using only depth information. (a4)–(d4) Corresponding absorption maps reconstructed using PAT location and target size guidance. Each absorption map has six subimages. Each subimage is an x-y image of 12 cm × 12 cm. The depth range is from 0.5–3 cm in 0.5 cm increments. 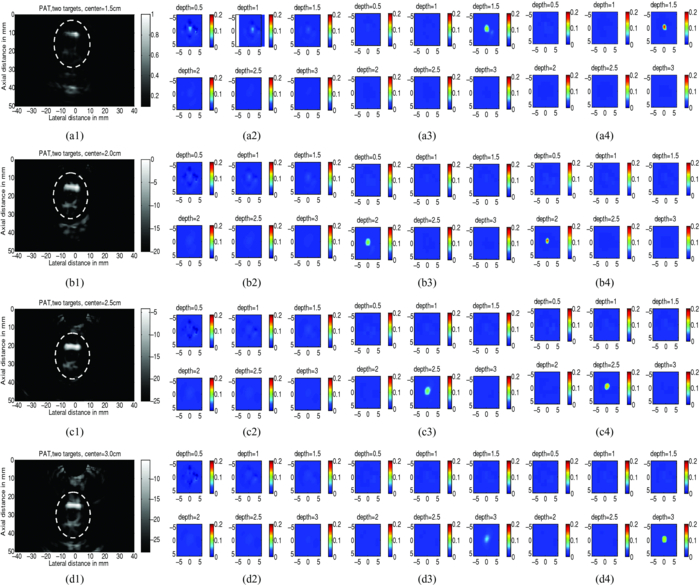 Fig. 5Absorption coefficient quantification accuracy for higher-contrast phantom (with calibrated μa = 0.25 cm−1) using DOT reconstruction with no a priori information, depth-only information, and PAT spatial information.  Fig. 6Experimental results of the lower-contrast 1 cm-cubical phantom target. (a1)–(d1) PAT images of the target (shown inside the circled regions) with center located at 1.5, 2, 2.5, and 3 cm depths, respectively. The x-axis of the PAT images is lateral dimension in x (mm), and vertical axis is the depth in z (mm). (a2)–(d2) Corresponding absorption maps reconstructed without using any a priori information. (a3)–(d3) Corresponding absorption maps reconstructed using only depth information. (a4)–(d4) Corresponding absorption maps reconstructed using the PAT location and target size guidance. Each absorption map has six subimages. Each subimage is an x-y image of 12 cm × 12 cm. The depth range from 0.5–3 cm in 0.5 cm increments. 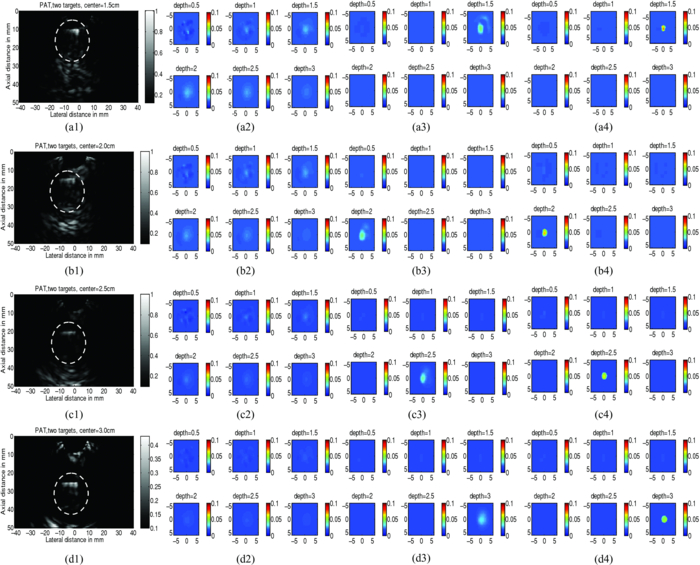 3.2.Dual Target ImagingThe 1 cm-cubical absorbers immersed inside the intralipid were again used to mimic two lesions. The first set of experiments was conducted using a pair of the higher contrast absorbers to represent typical optical properties of clustered malignant lesions. Both targets were located at the same depth from the probe and were again varied from 1.5–3.0 cm as before. For each depth, the center-to-center separation of the two targets was also varied from 1.5–3.0 cm in 0.5 cm increments. The images shown in Figs. 8a1, 8a2, 8a3, 8d1 are the PAT images of the two targets located at the four different depths as mentioned above and 3.0 cm center-to-center separation. The PAT images clearly delineate the front and back face of each target; however, the contrast is reduced at a depth of 3 cm. In addition, the target size and center-to-center distance can be accurately measured. Figures 8a2, 8a3, 8d1, 8d2 are the reconstructed absorption maps of the two targets using target depth information without target size and spatial location guidance from PAT. The two targets are recognizable at 1.5 cm depth as shown in Fig. 8a2 and merge together at deeper depths. The reconstructed values were 0.13 cm−1 (52%) and 0.12 cm−1 (48%). The reconstructed absorption maps using two ROIs estimated from coregistered PAT images are shown in Figs. 8a3, 8d1, 8d2, 8d3. It is seen that this time, the two targets are well separated, and the reconstructed values are 0.18 cm−1 (71%) and 0.18 cm−1 (71%). The results of the accuracies for other depths and center-to-center separations are given in Table 1. In summary, when the center-to-center (C-C) separation of targets was 2.0 cm and targets located at 1.5 cm, or C-C was 2.5 cm and targets located at 2.0 cm and shallower, or C-C was 3 cm and targets located at 3.5 cm and shallower, the reconstructed absorption maps without and with PAT guidance can separate the two targets. However, the target quantification can be improved by using two ROIs provided by precise PAT guidance. The average improvement ranges from 11–26% with an average of 20%. For other C-C target separations and locations without and with PAT, guidance cannot separate the two targets. However, the target quantification has improved from 8–20% with an average improvement of 13% by using precise PAT guidance on target spatial location and size. Fig. 8Phantom experiments of two higher-contrast targets, with a center-to-center separation of 3.0 cm. The images in the left column (a1)–(d1) are the PAT images (shown inside the circled regions). The reconstructed absorption maps using a priori target depth information are only given in the middle column (a2)–(d2). The reconstructed absorption maps using PAT guidance are shown in (a3)–(d3).  Fig. 11Experiment results for a higher contrast cube submerged in the chicken breast. (a) PAT image, circled region is the cube; (b) Reconstructed target absorption map, max μa = 0.152 cm−1.  Table 1Reconstruction results of phantom experiments of two higher contrast targets (calibrated μa = 0.25 cm−1).
A second set of experiments were performed on a pair of 1 cm-cubical soft absorbers, one of higher contrast and the other of lower contrast. This set of experiments emulates the condi-tion of imaging one malignant and one benign lesion next to each other. As before, both targets were located at the same depth from the probe and the center depth was varied from 1.5–3.0 cm in the intralipid. For each target depth, the C-C separation between two targets was varied from 1.5–3.0 cm in 0.5 cm increments. An example of C-C = 3 cm and target located from 1.5–3 cm is given in Fig. 9. As shown in Figs. 9a2, 9a3, 9b1, 9b2, 9b3, 9c1, 9c2, 9c3, 9d1, 9d2, the reconstructed absorption maps using the single ROI with the a priori target depth information can barely resolve the low contrast target at 1.5 and 2 cm depth and both targets are merged at 2.5 and 3 cm depth. Using the two ROIs estimated from PAT images, the two targets can be resolved at 1.5 and 2 cm, but barely resolved at 2.5 cm depth with an average 17% improvement on target quantification for high contrast target and 15% for low contrast one at depths of 1.5 and 2 cm. The reconstruction accuracy results are given in Table 2 and show a similar trend as in Table 1. When the center-to-center separation of the two targets was 2.0 cm at a depth of 1.5 cm, or C-C was 2.5 cm at a depth of 2.0 cm or shallower, or C-C was 3 cm at a depth of 3.5 cm or shallower, the reconstructed absorption maps without and with PAT guidance can separate the two targets. However, the target quantification can be improved by using two ROIs provided by precise PAT guidance. On average, both high and low contrast quantification accuracy was improved by 18% using PAT guidance compared with depth only. For other C-C target separations and locations, neither PAT method was able to separate the two targets, and only the higher contrast target was able to be reconstructed. The PAT guidance improved the quantification of the higher contrast target by 13%. Fig. 9Phantom experiments of two targets with different contrasts, with a center-to-center separation of 3.0 cm. The images in the left column (a1)–(d1) are PAT images (shown inside the circled regions), with the left one being the higher-contrast and the right one the lower-contrast target. The reconstructed absorption maps using a priori target depth information are only given in the middle column (a2)–(d2). The reconstructed absorption maps using PAT guidance are shown in (a3)–(d3).  Table 2Reconstruction results of phantom experiments of one higher (calibrated μa = 0.25 cm−1) and one lower contrast targets (calibrated μa = 0.08 cm−1).
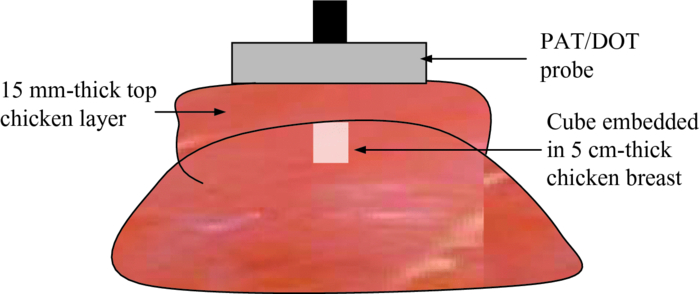
3.3.Absorber Embedded in Chicken BreastApart from imaging target in intralipid medium, the PAT/DOT system was also used in imaging target through a chicken breast of 1.5 cm thickness. For this experiment, the higher-contrast cube was inserted into a hole made in a chicken breast as illustrated in Fig. 10. The size of the hole was made a little bit smaller than the cube to allow the cube to fit tightly inside the hole. A thin layer of transparent ultrasound gel was used over the top surface of the cube and the chicken breast. A second layer of chicken breast of about 1.7 cm thickness was then placed on top of the cube so that the latter was covered on sides with chicken breast. This setup mimicked a tumor that is located at a depth of 2.2 mm inside breast tissue. The PAT/DOT probe was placed over and in contact with the top layer chicken breast. Coregistered PAT and DOT images were then taken and the results are shown in Fig. 11. The value of the reconstructed absorption coefficient (0.152 cm−1) of the cube obtained is 67% of the calibrated value (0.25 cm−1). 4.Summary and DiscussionThis study demonstrates the synergistic role of PAT and DOT in the detection and characterization of deep single target or closely-spaced dual targets. Because both PAT and DOT utilize optical contrast, this guidance is potentially more specific than with conventional nonoptical modalities to improve reconstruction accuracy and robustness. This can be particularly important for more complex absorption profiles such as the clustered tumors observed in clinical environments. In this study, we have used a PAT qualitative absorption map to guide DOT to quantitatively reconstruct the target absorption distribution. Tumor absorption due to angiogenesis is the main source of the optical contrast. Tumor scattering contrast is much smaller than that of the absorption. DOT can also quantitatively reconstruct the scattering distribution of the tumor but the reconstruction is not as accurate and reliable as that of the absorption distribution. As optical absorption changes are directly related to tumor angiogenesis process, this hybrid technology has a great potential for simultaneous cancer detection and diagnosis. While this initial demonstration of a clinical probe design was focused on validating the robustness and improvements in DOT quantification with PAT serving as an adjunct modality, the ultimate goal of the system is to exploit the advantages of both technologies for cancer detection and diagnostics. PAT can provide high-resolution imaging of lesion heterogeneity, especially when aided by DOT determination of background optical parameters. Knowledge of the background optical properties enables the introduction of an optical illumination forward model for more accurate conversion of absorbances (fluence×absorption coefficient) to the clinically relevant absorption coefficient (or equivalently hemoglobin concentration). Similarly, DOT can provide low resolution 3D images of optical absorption while offering absolute quantification of volumetric chromophore concentrations when assisted by PAT guidance. There are a number of technical challenges that need to be solved before we translate this technique into clinical studies. First, the ultrasound transducer face generates photoacoustic waves upon the absorption of light from the PAT source fibers. These waves propagate to the target where they are reflected back to the transducer and picked up as signals, producing artifacts in the photoacoutic images. Because the speed of the photoacoustic wave is much slower than light, the round-trip echoes from the transducer to target and back to transducer are received later than the actual target photoacoustic waves, and thus register as deeper-seated targets. To circumvent this problem, we placed a 3 mm-thick acoustically transparent cube containing 20%-concentration intralipid on the transducer face. The intralipid, with a reduced scattering coefficient of 200 cm−1, scatters the light reaching the transducer face and significantly reduces the light fluence. The reduced fluence in turn effectively reduces the transducer-face-generated artifacts to noise level. Unfortunately, the cube placed on the transducer face also reduces the DOT signals to some extend; therefore this approach only provides a compromise solution between PAT artifact level and DOT signal reduction. In this reported study, because the targets were deeply seated from 1.5–3 cm, the round trip echoes of the artifacts were outside of the imaging field of view. Therefore, ultrasound transducer- generated artifacts were not a main issue in this phantom study, but will have to be considered in future clinical studies. A second technical challenge arose from the aluminum foil that covered the transparent Plexiglas that was used for the combined PAT/DOT probe. The foil effectively reflected back-scattered light from the intralipid and hence avoided the artifacts that would otherwise have been generated by the absorption of light by the hybrid probe. The effective reflection coefficient of the probe was measured to be 0.6 and this corresponded to the partial reflection boundary condition.36 Compared to semi-infinite boundary condition provided by black probes as is typically used in DOT breast imaging studies, the depth for sensitive detection of targets reduced by about 0.5–1 cm depending on the background optical properties. We are currently looking into smart materials that can comprise both PAT artifacts level and DOT sensitive detection. We expect that both modalities can be optimized in this hybrid approach. Third, the poorer PAT image quality that was observed in some of the low contrast absorber images is a result of the rather low optical energy that was used: 8.5 mJ/pulse at 700 nm. The use of 700 nm reduces background absorption and therefore background artifacts, however, the output power of our laser system at this wavelength is quite low. Future work will involve the use of a more powerful laser system that will deliver sufficient energy for improved image quality. Last, the data acquisition speed of the ultrasound system used in this study is not suitable for clinical studies. A real-time system with both US pulse-echo and photoacoustic capabilities has been developed and is currently under debugging and testing. In summary, we have presented to the best of our knowledge the first PAT-guided DOT investigation for the detection and characterization of deep-seated single target and closely-spaced targets. This hybrid technique has the potential to overcome the challenges and limitations of each single technology alone and thus holds promise for cancer detection and diagnosis. AcknowledgmentsThe authors thank the funding support of this work from the National Institute of Health (R01EB002136), the Donaghue Medical Research Foundation, and ARMY Medical Research and Materiel Command (W81XWH-09-1-0511). ReferencesD. R. Leff, O. J. Warren, L. C. Enfield, A. Gibson, T. Athanasiou, D. K. Patten, J. Hebden, G. Z. Yang, and
A. Darzi,
“Diffuse optical imaging of the healthy and diseased breast: a systematic review,”
Breast Cancer Res. Treat., 108
(1), 9
–22
(2008). https://doi.org/10.1007/s10549-007-9582-z Google Scholar
Q. Fang, J. Selb, S. A. Carp, G. Boverman, E. L. Miller, D. H. Brooks, R. H. Moore, D. B. Kopans, and
D. A. Boas,
“Combined Optical and X-ray Tomosynthesis Breast Imaging,”
Radiology, 258 89
–97
(2011). https://doi.org/10.1148/radiol.10082176 Google Scholar
B. J. Tromberg, A. Cerussi, N. Shah, M. Compton, A. Durkin, D. Hsiang, J. Butler, and
R. Mehta,
“Imaging in Breast Cancer: Diffuse Optics in Breast Cancer: Detecting Tumors in Pre-Menopausal Women and Monitoring Neoadjuvant Chemotherapy,”
Breast Cancer Res., 7
(6), 279
–285
(2005). https://doi.org/10.1186/bcr1358 Google Scholar
Q. Zhu, P. Hegde, M. Kane, E. Cronin, Y. Ardeshirpour, C. Xu, A. Aguirre, S. Kurtzman, P. Deckers, and
S. Tannenbaum,
“The Potential Role of Optical Tomography with Ultrasound Localization in Assisting Ultrasound Diagnosis of Early-Stage Invasive Breast Cancers,”
Radiology, 256
(2), 367
–378
(2010). https://doi.org/10.1148/radiol.10091237 Google Scholar
B. Brooksby, B. W. Pogue, S. D. Jiang, H. Dehghani, S. Srinivasan, C. Kogel, T. D. Tosteson, J. Weaver, S. P. Poplack, and
K. D. Paulsen,
“Imaging Breast Adipose and Fibroglandular Tissue Molecular Signatures By Using Hybrid MRI-Guided Near-Infrared Spectral Tomography,”
Proc. Natl. Acad. Sci. U.S.A., 103
(23), 8828
–8833
(2006). https://doi.org/10.1073/pnas.0509636103 Google Scholar
R. Choe, S. D. Konecky, A. Corlu, K. Lee, T. Durduran, D. R. Busch, B. J. Czerniecki, J. Tchou, D. L. Fraker, A. Demichele, B. Chance, S. R. Arridge, M. Schweiger, J. P. Culver, M. D. Schnall, M. E. Putt, M. A. Rosen, and
A. G. Yodh,
“Differentiation of benign and malignant breast tumors by in-vivo three-dimensional parallel-plate diffuse optical tomography,”
J. Biomed. Opt., 14
(2), 024020
(2009). https://doi.org/10.1117/1.3103325 Google Scholar
R. A. Kruger, P. Liu, Y. R. Fang, and
C. R. Appledorn,
“Photoacoustic Ultrasound (Paus)–Reconstruction Tomography,”
Med. Phys., 22
(10), 1605
–1609
(1995). https://doi.org/10.1118/1.597429 Google Scholar
C. G. Hoelen and
F. F. De Mul,
“Image Reconstruction for Photoacoustic Scanning of Tissue Structures,”
Appl. Opt., 39
(31), 5872
–5883
(2000). https://doi.org/10.1364/AO.39.005872 Google Scholar
A. Karabutov, E. V. Savateeva, N. B. Podymova, and
A. A. Oraevsky,
“Backward Mode Detection of Laser-Induced Wide-Band Ultrasonic Transients With Optoacoustic Transducer,”
J. Appl. Phys., 87 2003
–2014
(2000). https://doi.org/10.1063/1.372127 Google Scholar
A. Mandelis and
C. Feng,
“Frequency-Domain Theory of Laser Infrared Photothermal Radiometric Detection of Thermal Waves Generated By Diffuse-Photon-Density Wave Fields in Turbid Media,”
Phys. Rev. E, 65
(2), 021909
(2002). https://doi.org/10.1103/PhysRevE.65.021909 Google Scholar
A. Oraevsky and A. Karabutov,
“Optoacoustic Tomography,”
Biomedical Photonics Handbook, 34 Chemical Rubber, Cleveland/ Boca Raton
(2003). Google Scholar
X. Wang, Y. Pang, G. Ku, X. Xie, G. Stoica, and
L. Wang,
“Noninvasive Laser-Induced Photoacoustic Tomography for Structural and Functional in Vivo Imaging of the Brain,”
Nat. Biotechnol., 21
(7), 803
–806
(2003). https://doi.org/10.1038/nbt839 Google Scholar
M. Xu and
L. Wang,
“Photoacoustic Imaging in Biomedicine,”
Rev. Sci., 77
(4), 041101
(2006). https://doi.org/10.1063/1.2195024 Google Scholar
H. P. Brecht, D. S. Prough, Y. Y. Petrov, I. Patrikeev, I. Y. Petrova, D. J. Deyo, I. Cicenaite, and
R. O. Esenaliev,
“In Vivo Monitoring of Blood Oxygenation in Large Veins With a Triple-Wavelength Optoacoustic System,”
Opt. Express, 15
(24), 16261
–16269
(2007). https://doi.org/10.1364/OE.15.016261 Google Scholar
L. V. Wang,
“Prospects of Photoacoustic Tomography,”
Med. Phys., 35 5758
–5767
(2008). https://doi.org/10.1118/1.3013698 Google Scholar
L. V. Wang, Photoacoustic Imaging and Spectroscopy, CRC Press, Boca Raton
(2009). Google Scholar
A. Aguirre, P. Guo, J. Gamelin, S. Yan, M. M. Sanders, M. Brewer, and
Q. Zhu,
“Coregistered Three-Dimensional Ultrasound and Photoacoustic Imaging System for Ovarian Tissue Characterization,”
J. Biomed. Opt., 14
(5), 054014
(2009). https://doi.org/10.1117/1.3233916 Google Scholar
J. Gamelin, A. Maurudis, A. Aguirre, F. Huang, P. Guo, L. Wang, and
Q. Zhu,
“A Real-Time Photoacoustic Tomography System for Small Animals,”
Opt. Express, 17
(13), 10489
–10498
(2009). https://doi.org/10.1364/OE.17.010489 Google Scholar
C. Li and
L. V. Wang,
“Photoacoustic Tomography and Sensing in Biomedicine,”
Phys. Med. Biol., 54
(19), R59
–R97
(2009). https://doi.org/10.1088/0031-9155/54/19/R01 Google Scholar
A. B. Karpiouk, B. Wang, and
S. Y. Emelianov,
“Development of a Catheter for Combined Intravascular Ultrasound and Photoacoustic Imaging,”
Rev. Sci. Instrum., 81
(1), 014901
(2010). https://doi.org/10.1063/1.3274197 Google Scholar
R. A. Kruger, R. B. Lam, D. R. Reinecke, S. P. Del Rio, and
R. P. Doyle,
“Photoacoustic Angiography of the Breast,”
Med. Phys., 37
(11), 6096
–6100
(2010). https://doi.org/10.1118/1.3497677 Google Scholar
H. Jiang, Z. Yuan, and
X. Gu,
“Spatially Varying Optical and Acoustic Property Reconstruction Using Finite-Element-Based Photoacoustic Tomography,”
J. Opt. Soc. Am. A Opt. Image Sci. Vis, 23
(4), 878
–888
(2006). https://doi.org/10.1364/JOSAA.23.000878 Google Scholar
Z. Yuan and
H. Jiang,
“Three-Dimensional Finite-Element-Based Photoacoustic Tomography: Reconstruction Algorithm and Simulations,”
Med. Phys., 34
(2), 538
–546
(2007). https://doi.org/10.1118/1.2409234 Google Scholar
J. Xiao, L. Yao, Y. Sun, E. S. Sobel, J. He, and
H. Jiang,
“Quantitative Two-Dimensional Photoacoustic Tomography of Osteoarthritis in the Finger Joints,”
Opt. Express, 18
(14), 14359
–14365
(2010). https://doi.org/10.1364/OE.18.014359 Google Scholar
J. Ripoll and
V. Ntziachristos,
“Quantitative Point Source Photoacoustic Inversion Formulas for Scattering and Absorbing Media,”
Phys. Rev. E, 71
(3 Pt 1), 031912
(2005). https://doi.org/10.1103/PhysRevE.71.031912 Google Scholar
B. T. Cox, S. R. Arridge, K. P. Köstli, and
P. C. Beard,
“Two-Dimensional Quantitative Photoacoustic Image Reconstruction of Absorption Distributions in Scattering Media By Use of a Simple Iterative Method,”
Appl. Opt., 45
(8), 1866
–1875
(2006). https://doi.org/10.1364/AO.45.001866 Google Scholar
J. Laufer, D. Delpy, C. Elwell, and
P. Beard,
“Quantitative Spatially Resolved Measurement of Tissue Chromophore Concentrations Using Photoacoustic Spectroscopy: Application to the Measurement of Blood Oxygenation and Haemoglobin Concentration,”
Phys. Med. Biol., 52
(1), 141
–168
(2007). https://doi.org/10.1088/0031-9155/52/1/010 Google Scholar
J. Laufer, B. Cox, E. Zhang, and
P. Beard,
“Quantitative Determination of Chromophore Concentrations From 2d Photoacoustic Images Using a Nonlinear Model-Based Inversion Scheme,”
Appl. Opt., 49
(8), 1219
–1233
(2010). https://doi.org/10.1364/AO.49.001219 Google Scholar
M. Sivaramakrishnan, K. Maslov, H. F. Zhang, G. Stoica, and
L. Wang,
“Limitations of Quantitative Photoacoustic Measurements of Blood Oxygenation in Small Vessels,”
Phys. Med. Biol., 52
(5), 1349
–1361
(2007). https://doi.org/10.1088/0031-9155/52/5/010 Google Scholar
J. Rajian, P. Carson, and
X. Wang,
“Quantitative Photoacoustic Measurement of Tissue Optical Absorption Spectrum Aided By an Optical Contrast Agent,”
Opt. Express, 17
(6), 4879
–4889
(2009). https://doi.org/10.1364/OE.17.004879 Google Scholar
B. Cox, J. G. Laufer, and
P. C. Beard,
“The challenges for quantitative photoacoustic imaging,”
Proc. SPIE, 7177 717713
(2009). https://doi.org/10.1117/12.806788 Google Scholar
L. Yin, Q. Wang, Q. Zhang, and
H. Jiang,
“Tomographic Imaging of Absolute Optical Absorption Coefficient in Turbid Media Using Combined Photoacoustic and Diffusing Light Measurements,”
Opt. Lett., 32
(17), 2556
–2558
(2007). https://doi.org/10.1364/OL.32.002556 Google Scholar
J. C. Ranasinghesagara and
R. Zemp,
“Combined Photoacoustic and Oblique-Incidence Diffuse Reflectance System for Quantitative Photoacoustic Imaging in Turbid Media,”
J. Biomed. Opt., 15
(4), 046016
(2010). https://doi.org/10.1117/1.3470336 Google Scholar
G. J. Diebold, T. Sun, and
M. I. Khan,
“Photoacoustic Monopole Radiation in One, Two, and Three Dimensions,”
Phys. Rev. Lett., 67
(24), 3384
–3387
(1991). https://doi.org/10.1103/PhysRevLett.67.3384 Google Scholar
G. Spirou, A. Oraevsky, I. Vitkin, and
W. Whelan,
“Optical and Acoustic Properties At 1064 Nm of Polyvinyl Chloride-Plastisol for Use as a Tissue Phantom in Biomedical Optoacoustics,”
Phys. Med. Biol., 50
(14), N141
–N153
(2005). https://doi.org/10.1088/0031-9155/50/14/N01 Google Scholar
C. Xu, B. Yuan, and
Q. Zhu,
“An optimal probe design for breast imaging using near infrared diffused light,”
J. Biomed. Opt., 13
(4), 044002-1–044002-10
(2008). https://doi.org/10.1117/1.2966703 Google Scholar
|
||||||||||||||||||||||||||||||||||||||||||||||||||||||||||||||||||||||||||||||||||||||||||||||||||||||||||||||||||||||||||||||||||||||||||||||||||||||||||||||||||||||||||||||||||||||||||||||||||||||||||||||||||||||||||||||||||||||||||