
|
|
1.IntroductionAn animal starts its life as a single cell—a fertilized egg. During development, this cell divides repeatedly to produce many different cells in a final pattern of spectacular complexity and precision. Ultimately, the genome determines the pattern. Understanding the specialization of cells during embryogenesis can provide information on how stem cells specialize into specific tissues and organs. Two photon excitation fluorescence (TPEF), second and third harmonic generation (SHG and THG, respectively) are nonlinear imaging techniques that have been used as diagnostic tools for the in vivo delineation and mapping of subcellular biological structures and processes. By employing these imaging modalities, valuable and complementary information from various biological samples at the microscopic level have been extracted.1, 2, 3 These nondestructive techniques have the potential to offer new insights into complex developmental processes of embryogenesis in many biological settings. The main features of the three (TPEF–SHG–THG) nonlinear imaging modalities are summarized in Table 1. Table 1Main advantages of three nonlinear imaging microscopy techniques (TPEF-SHG-THG).
Specifically, the THG process represents a nonlinear scattering (coherent) phenomenon. Three photons of angular frequency ω are destroyed and a photon of angular frequency 3ω is simultaneously created in a single quantum mechanical process.4 THG is sensitive to local differences in third-order nonlinear susceptibility χ(3), refractive index, and dispersion.5 In THG imaging microscopy the contrast arises from interfaces and optical heterogeneities of size comparable to the beam focus. In other words, no THG signal is collected when the laser beam is focused inside a homogeneous, normally dispersive medium.4, 6 In contrast to SHG modality that requires a medium without inversion symmetry, THG is allowed in any medium. Moreover, a main advantage of using THG compared to TPEF imaging modality is that no fluorescent markers are needed for staining the samples. Therefore, common issues of dye availability, or dye toxicity of the biological specimen are eliminated. Consequently, THG comprises an ideal diagnostic tool that provides unique structural, anatomical, and morphological information from various biological samples. Several imaging techniques have been employed in embryology in order to track cell division stage of biological specimens, such as confocal laser scanning microscopy7 and differential interference contrast (DIC-Nomarski).8 Additionally, the nonlinear imaging modality of THG has been used as an alternative method to provide information related to morphological changes and complex developmental processes of Zebrafish,9, 10 Drosophila,11 Xenopus laevis,12 Caenorhabditis elegans (C. elegans) 13, 14 and mouse15 embryos. Recently, quantitative cell tracking studies were performed at early stage zebrafish embryos through the detection of higher harmonic signals (SHG, THG).16 Furthermore, different developmental stages of C. elegans embryos have been discriminated and individual embryonic cells have been identified via THG imaging measurements.13, 14 In the current work, for the first time to the best of our knowledge, cell tracking studies were performed in C. elegans embryos in vivo using high-resolution THG imaging measurements. C. elegans embryos were continually imaged across early development ranging from 2-cell to 3-fold stage. We extracted valuable information related to the complex developmental process of C. elegans embryogenesis. Specifically, via the collection of THG signals, we achieve to monitor the exact movement of cells and cell nuclei during mitosis at the early stages of C. elegans embryogenesis. 2.Materials and Methods2.1.Experimental ApparatusThe use of femtosecond (fs) lasers enables high peak powers for efficient nonlinear excitation, but at low enough energies so that the biological samples are not damaged. In our study, an amplitude system t-pulse laser (1028 nm, 50 MHz, 1 W, 200 fs) has been used as an excitation source. The femtosecond laser beam was directed into a modified Nikon upright microscope (Nikon Eclipse ME600D). THG signals were detected in the forward direction. A 32×,0.85 numerical aperture (NA) objective lens (Carl Zeiss, C Achroplan, water immersion) was employed for tight focusing of the laser beam onto the sample and a 100×,1.4 NA condenser lens (Carl Zeiss, Plan Apochromat, oil immersion) was used for recording THG signals. The lateral resolution of our system was 0.6 μm. The scanning procedure was performed with a pair of galvanometric mirrors (Cambridge Tech. 6210H) and the focal plane was selected with a motorized translation stage (Standa 8MT167–100). LABVIEW interface controlled both scanning and data acquisition procedures. Biological samples were placed between two very thin (∼70 μm) round glass slides (Marienfeld). The glass slides were separated with a 100-μm thick spacer to avoid damaging the embryos. After filtering with a 340 nm color glass filter (Hoya U 340), THG was detected by a photomultiplier tube (PMT Hamamatsu H9305–04). A single two-dimensional (2D) THG image of 300×300 number of pixels was recorded in less than 400 ms. In order to improve the signal-to-noise ratio (SNR), one 2D optical section was obtained from 20 average scans. The total time for obtaining an image was 8 s. The field of view used to obtain the THG images was the square of 68×68 μm2. The pixel size was equal to 0.23 μm. The optical power density on the specimen was 14.1×10⁵ W/cm2 (16 mW average laser power, 0.32 nJ per pulse). The calculated typical range of values for SNR of the obtained THG images was 15 to 20. Our experimental apparatus allows the collection of two nonlinear optical signals simultaneously (one in the reflection and the other in the transmission mode). In the current study only the forward path of detection has been used. 2.2.Biological SampleWe used wild-type (N2) C. elegans embryos to perform the THG cell tracking experiments. C. elegans is a model system with several advantages. It is a small (1 mm), hermaphroditic, soil nematode, which grows in 2.5 days at 25°C to be an adult worm that lays 200 to 300 eggs. Worms are easily cultivated and maintained in the lab. Their transparency permits microscopic visualization of specific cells and subcellular structures. The lineage of the 959 cells in the adult is fully described and invariable among animals, which greatly facilitates studies of development. C. elegans embryogenesis is divided into three major stages and lasts 14 h at the incubation temperature of 20°C. Embryogenesis begins with the formation of the zygote followed by the establishment of the embryonic axes and the determination of the somatic and germ-line cell pathways. In the second stage, gastrulation takes place, most of the cell proliferation completes, and cell differentiation and organogenesis commences. During the final stage, morphogenesis and organogenesis completes and the egg subsequently hatches into a worm. As embryos advance through the various stages of embryogenesis, major morphological landmarks, as it grows from a zygote into a worm, are the bean, comma, 1.5-fold, 2-fold and finally the 3-fold stage. Specifically early in development, the embryo undergoes four unequal divisions to produce five somatic founder cells (AB, E, MS, C, D) and the primordial germ cell P4. These divisions occur within 100 min following the first cleavage and the embryo at this time is at the 28-cell stage (Fig. 1). Embryogenesis concludes with hatching and at this stage the embryo contains 550 cells. Fig. 1Cell lineage tree of early development in the C. elegans embryo. Horizontal line indicates cell divisions. P0 denotes the zygote. The germ-line or P cells divide unequally to form the five somatic founder cells (AB, MS, E, C and D) and the primordial germ cell P4. The type of cells generated by each founder cell is indicated. 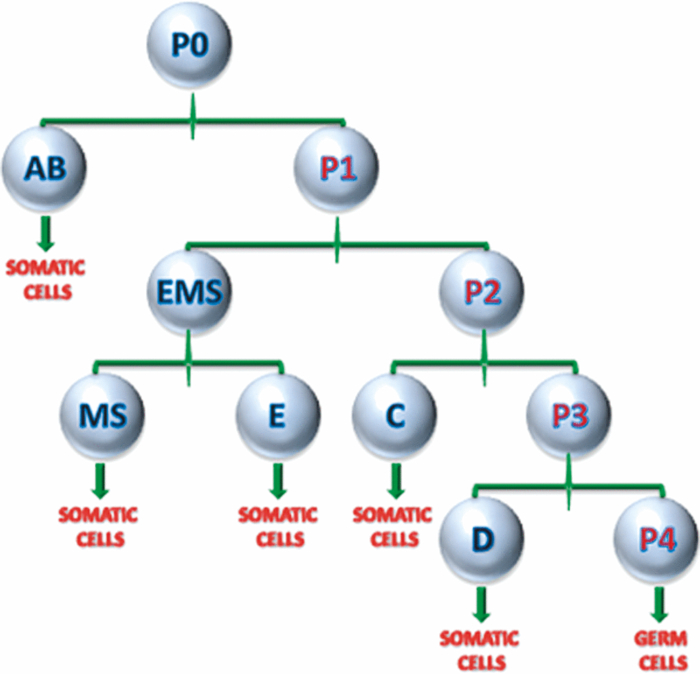 Worms were maintained at 20°C on standard nematode growth medium plates seeded with Escherichia coli as previously described.14 Synchronized young adults were collected from their plates and were subsequently bleached in order to obtain eggs at early developmental stages. Eggs were subsequently mounted on glass slides for viewing. 3.Results and DiscussionIn a previous study we demonstrated the ability of THG measurements to image C. elegans embryos.14 Figure 2 depicts a 2D THG image (300×300 pixels) of an early-stage (16 cells) C. elegans embryo. Scanning was performed in a specific z position where the THG signal that arises from the sample was maximal. Individual embryonic cells can be clearly identified. Round dark regions represent cell nuclei. The cell nucleus fails to emit detectable THG signal due to its homogeneous constitution.13, 14, 17 In contrast, high THG signals are generated by discontinuities in the region around the cell nucleus. The main contributors of the high THG signals are the endoplasmic reticulum, different organelles (e.g., mitochondria),18 lipid depositions,17 and other formations of discontinuous refractive index or χ(3) values.4, 19 By performing THG imaging measurements the precise delineation of the 16 different cells that constitute the C. elegans embryo was easily derived. The detailed structure and the morphology of each cell were observed. Fig. 2THG image from an early-stage C. elegans embryo. Maximum THG signal is depicted in blue color, while minimal THG signal is depicted in black color.  To demonstrate the ability of our system to image the morphological changes that occur early in development, we followed the same embryo for several hours. We took continual images at 1 or 3 min intervals and captured the unequal cell divisions that occur during the first few hours of embryogenesis. Figure 3 depicts the cell division process in a C. elegans embryo in vivo from two- to four-cell stage. The scanning was performed at a specific z position where the collected THG signal derived from the embryo was maximum. Nine sequential THG 2D images (300×300 pixels) are presented. The time interval between consecutive images was 2 m. The duration of data acquisition was sixteen minutes. Figures 3a and 3b show an embryo at two-cell stage. The next five Figs. 3c, 3d, 3e, 3f, 3g depict the mitosis process until the four-cell stage. Figures 3h and 3i represent the C. elegans embryo at the four-cell stage. The time needed to complete cell division from two- to four-cell stage was 10 min. Cell nuclei appear as round dark regions since homogeneous areas fail to emit a THG signal. It is thus feasible to monitor the proliferation process inside a live C. elegans embryo. The exact movement of cells during mitosis is detectable via the collection of THG signals. We have to note that, due to the very fast data acquisition time (8 s) the micro movements of the C. elegans embryos are negligible. This results in the collection of high quality THG images from the embryos. Fig. 3THG images taken from a C. elegans embryo. Images show the in vivo asymmetric cell division from two- to four-cell stage.  Figure 4 shows the division process in a C. elegans embryo in vivo from four- to multiple-cell stage. Six THG 2D images (300×300 pixels) at different developmental stages are presented. Figure 4a shows the initial four-cell stage of the embryo. Figures 4b, 4c, 4d, 4e, 4f represent later multiple-cell developmental stages. The THG signal is observed from all the embryonic cells in all figures. Cell nuclei are visible as dark regions. Every cell from four- to multiple-cell stage can be outlined with satisfactory analysis. Video 1 depicts an animated time-lapse sequence of 2D THG signals from the same embryo. The whole procedure of data acquisition needed for each THG image lasted 8 s. The sample was imaged for 3 h and the time-lapse between images was 1 min. By performing THG measurements (see Video 1) it is feasible to monitor in vivo cell divisions at the early stage of C. elegans embryos. One of the main advantages of the application of THG imaging modality to C. elegans embryogenesis studies, compared with other well established optical techniques such as DIC, is that the morphology and the structure of cell nuclei at the early developmental stages of embryos are extremely perspicuous and well determined. The cell loses the nuclear integrity when it is entering the mitotic phase. The disappearance of the cell nucleus indicates the beginning of the mitotic procedure. This highly important biological procedure can be monitored precisely via THG imaging measurements since cell nuclei appear as black holes in the recorded images, creating very high contrast with the surrounding structures of the cytoplasm. Moreover, we can follow C. elegans embryonic growth across the different developmental stages. Fig. 4THG images recorded from an early stage C. elegans embryo. Images depict the in vivo cell divisions from four- to multiple-cell stage.  Video 1THG imaging measurements for cell tracking at early cell division stages of a C. elegans embryo. The whole procedure of data acquisition lasted 3 h. Time-lapse between images is 1 min. THG signal is depicted in yellow. (QuickTime 1.7 MB) 1  Figure 5 shows the division process in two live C. elegans embryos from multiple-cell to threefold stage. Nine THG 2D images (300×300 pixels) at different developmental stages are depicted. Figure 5a shows two multiple-cell stage embryos. Figures 5b, 5c, 5d, depict a mid C. elegans embryonic stage (especially the right embryo of the figure). At this developmental stage, many cell divisions have already occurred. In Figs. 5e and 5f the right embryo is at the comma stage of C. elegans embryogenesis. At this developmental stage, the elongation of the new embryo has initiated and is progressing toward the first folding. The number of individual cells is increased and it is difficult to distinguish cell nuclei. In Figs. 5g, 5h, 5i, the right embryo is at the fold stages of embryogenesis. At these stages of embryogenesis, the embryo is elongated and folded inside the egg. The THG imaging modality provides information relevant to the overall contour of the animal. However, the movement of the new worm inside the egg is very rapid making it difficult to precisely monitor this motion with THG measurements. The whole procedure of cell division from multiple-cell to the threefold stage can be observed in the right C. elegans embryo in Video 2. Video 2 shows an animated time-lapse sequence of 2D THG signals arising from two embryos. The whole procedure of data acquisition needed for each THG image lasted 8 s. The samples were imaged for 7 h and the time-lapse between images was 3 min. Fig. 5THG images obtained from two live C. elegans embryos. Images show the embryonic development from multiple-cell to the threefold stage (right embryo). 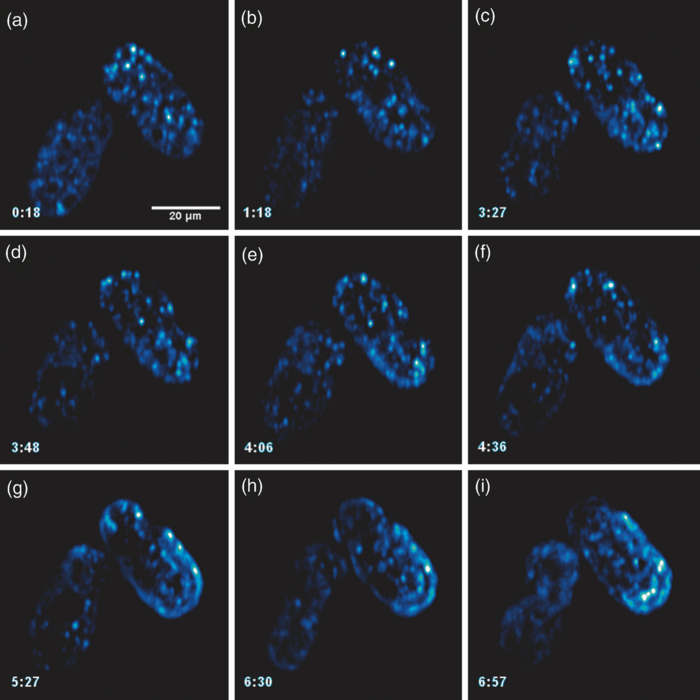 Video 2THG imaging measurements at late embryonic stages of two C. elegans embryos. The right embryo clearly shows the development from multiple-cell to the threefold stage. The whole procedure of data acquisition lasted 7 h. Time-lapse between images is 3 min. THG signal is depicted in yellow. (QuickTime 1.1 MB) 2 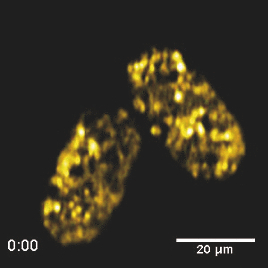 4.ConclusionsTo the best of our knowledge, this is the first time that cell tracking studies have been performed with live C. elegans embryos by employing THG imaging microscopy measurements. THG imaging technique is an ideal diagnostic tool for tracking cell divisions, morphological, and structural processes in live C. elegans embryos. The movement of cells and cell nuclei during mitosis at the early stages of C. elegans embryogenesis is detectable. Furthermore, structural information from later developmental stages (fold stages) has been extracted. By employing this non-linear modality, no fluorescent markers are required for staining the samples. Due to the nature of the THG phenomenon (nonlinear coherent scattering effect), it is feasible to irradiate live C. elegans embryos for extended periods of time (for more than 7 h). Additionally, this imaging technique has the potential to provide exact temporal information for the different developmental processes (cell division, transition from an earlier to a later developmental stage, etc.) that occur during C. elegans embryogenesis. The identification of healthy and unhealthy embryos is a possible application of this imaging technique. Mitochondria and lipid bodies have been considered as the most prominent structures of the THG signal from cells.17, 18 It can be assumed that they both give information related to the energetic profile of the cell. Consequently, THG imaging modality has the potential to be used as a novel diagnostic tool for monitoring embryonic health. Eventually, we anticipate that THG modality can be utilized in combination with other optical techniques, such as DIC and fluorescence (confocal or multiphoton), to obtain complementary information in the research field of cell tracking of various biological samples (C. elegans embryos, Drosophila embryos, etc). AcknowledgmentsThis work was supported by the UV Laser Facility operating at IESL-FORTH under the European Commission “Improving Human Research Potential” program (RII3-CT-2003–506350) and by the ICT-Collaborative project “FAST-DOT” (Grand Agreement No. 224338). ReferencesP. J. Campagnola and
L. M. Loew,
“Second-harmonic imaging microscopy for visualizing biomolecular arrays in cells, tissues and organisms,”
Nat. Biotechnol., 21 1356
–1360
(2003). https://doi.org/10.1038/nbt894 Google Scholar
G. Filippidis, C. Kouloumentas, G. Voglis, F. Zacharopoulou, T. G. Papazoglou, and
N. Tavernarakis,
“Imaging of Caenorhabditis elegans neurons by second harmonic generation and two-photon excitation fluorescence,”
J. Biomed. Opt., 10 024015
(2005). https://doi.org/10.1117/1.1886729 Google Scholar
W. R. Zipfel, R. M. Williams, and
W. W. Webb,
“Nonlinear magic: multiphoton microscopy in the biosciences,”
Nature Biotechnol., 21 1369
–1377
(2003). https://doi.org/10.1038/nbt899 Google Scholar
Y. Barad, M. Eisenberg, M. Horowitz, and
Y. Silberberg,
“Nonlinear scanning laser microscopy by third harmonic generation,”
Appl. Phys. Lett., 70 922
–924
(1997). https://doi.org/10.1063/1.118442 Google Scholar
D. Debarre and
E. Beaurepaire,
“Quantitative characterization of biological liquids for third harmonic generation microscopy,”
Biophys. J., 92 603
–612
(2007). https://doi.org/10.1529/biophysj.106.094946 Google Scholar
J. Squier and
M. Muller,
“High resolution nonlinear microscopy: A review of sources and methods for achieving optimal imaging,”
Rev. Sci. Instrum., 72 2855
–2867
(2001). https://doi.org/10.1063/1.1379598 Google Scholar
M. M. Cockell, K. Baume, and
P. Gonczy,
“Lis-1 is required for dynein-dependent cell division processess in C. elegans embryos,”
J. Cell Sci., 117 4571
–4582
(2004). https://doi.org/10.1242/jcs.01344 Google Scholar
S. Hamahashi, S. Onami, and
H. Kitano,
“Detection of nuclei in 4D Nomarski DIC microscope images of early Caenorhabditis elegans embryos using local image entropy and object tracking,”
BMC Bioinf., 6 125
(2005). https://doi.org/10.1186/1471-2105-6-125 Google Scholar
C. S. Hsieh, C. Y. Ko, S. Y. Chen, T. M. Liu, J. S. Wu, C. H. Hu, and
C. K. Sun,
“In vivo long-term continuous observation of gene expression in zebrafish embryo nerve system by using harmonic generation microscopy and morphant technology,”
J. Biomed. Opt., 13 064041
(2008). https://doi.org/10.1117/1.3050423 Google Scholar
C. K. Sun, S. W. Chu, S. Y. Chen, T. H. Tsai, T. M. Liu, C. Y. Lin, and
H. J. Tsai,
“Higher harmonic generation microscopy for developmental biology,”
J. Struct. Biol., 147 19
–30
(2004). https://doi.org/10.1016/j.jsb.2003.10.017 Google Scholar
W. Supatto, D. Debarre, B. Moulia, E. Brouzes, J. L. Martin, E. Farge, and
E. Beaurepaire,
“In vivo modulation of morphogenetic movements in Drosophila embryos with femtosecond laser pulses,”
Proceedings of National Academy of Science, 102 1047
–1052
(2005). https://doi.org/10.1073/pnas.0405316102 Google Scholar
D. Oron, D. Yelin, E. Tal, S. Raz, R. Fachima, and
Y. Silberberg,
“Depth-resolved structural imaging by third-harmonic generation microscopy,”
J. Struct. Biol., 147 3
–11
(2004). https://doi.org/10.1016/S1047-8477(03)00125-4 Google Scholar
R. Aviles-Espinosa, S. I. C. O. Santos, A. Brodschelm, W. G. Kaenders, C. Alonso-Ortega, D. Artigas, and
P. Loza-Alvarez,
“Third-harmonic generation for the study of Caenorhabditis elegans embryogenesis,”
J. Biomed. Opt., 15 046020
(2010). https://doi.org/10.1117/1.3477535 Google Scholar
G. J. Tserevelakis, G. Filippidis, A. J. Krmpot, M. Vlachos, C. Fotakis, N. Tavernarakis,
“Imaging Caenorhabditis elegans embryogenesis by third-harmonic generation microscopy,”
Micron, 41 444
–447
(2010). https://doi.org/10.1016/j.micron.2010.02.006 Google Scholar
T. Watanabe, A. Thayil, A. Jesacher, K. Grieve, D. Debarre, T. Wilson, M. Booth, and
S. Srinivas,
“Characterisation of the dynamic behaviour of lipid droplets in the early mouse embryo using adaptive harmonic generation microscopy,”
BMC Cell Biology, 11 38
(2010). https://doi.org/10.1186/1471-2121-11-38 Google Scholar
N. Olivier, M. A. Luengo-Oroz, L. Duloquin, E. Faure, T. Savy, I. Veilleux, X. Solinas, D. Debarre, P. Bourgine, A. Santos, N. Peyrieras, and
E. Beaurepaire,
“Cell lineage reconstruction of early zebrafish embryos using label-free nonlinear microscopy,”
Science, 329 967
–971
(2010). https://doi.org/10.1126/science.1189428 Google Scholar
D. Debarre, W. Supatto, A. M. Pena, A. Fabre, T. Tordjmann, L. Combettes, M. C. Schanne-Klein, and
E. Beaurepaire,
“Imaging lipid bodies in cells and tissues using third-harmonic generation microscopy,”
Nat. Methods, 3 47
–53
(2006). https://doi.org/10.1038/nmeth813 Google Scholar
C. S. Hsieh, S. U. Chen, Y. W. Lee, Y. S. Yang, and
C. K. Sun,
“Higher harmonic generation microscopy of in vitro cultured mammal oocytes and embryos,”
Opt. Express, 16 11574
–11588
(2008). Google Scholar
J. M. Schins, T. Schrama, J. Squier, G. J. Brakenhoff, and
M. Muller,
“Determination of material properties by use of third-harmonic generation microscopy,”
J. Opt. Soc. Am. B, 19 1627
–1634
(2002). https://doi.org/10.1364/JOSAB.19.001627 Google Scholar
|
|||||||||||||||||||||||||||||||||||||||||||||


