|
|
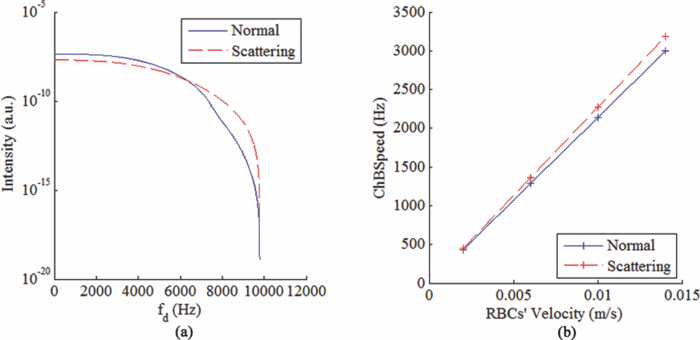
1.IntroductionLaser Doppler flowmeter (LDF) is the most widely used method for blood flow measurement because of its noninvasive and noncontact characteristics.1 Several studies of blood flow in human eye fundus using LDF outline the importance of measuring vessel flow properties since it is an early indicator of eye pathologies like glaucoma, diabetic retinopathy or age related macular degeneration. 2, 3, 4, 5, 6, 7, 8 The principle of LDF is to measure the Doppler frequency shift that light undergoes when reflected by moving objects. Such Doppler frequency shift has also been exploited in optical Doppler tomography with additional benefit of localization along depth.9, 10, 11, 12 Most commercial available LDFs are equipped with a ponderous table and a fixed head holder for patient examination. Such characteristic limits their applications to patients with self-consciousness and self-dependence. For special patients such as new born babies, disabled persons, and patients under intensive care or under operation, ponderous LDFs are not convenient whereas portable LDFs are desirable.13 Furthermore, for clinical applications, it is required that the developed LDF is capable of monitoring blood flow with high sensitivity. However, the usual construction of the commercial ocular LDF device is based on a very small angle restricted by pupil aperture, leading to small Doppler shift due to a near perpendicular direction of incident laser to primary blood flow in choroidal vessels. It limits commercial LDF to detect very slight alternation of choroidal blood flow with high sensitivity. In this paper, we report a portable choroidal LDF with a scattering plate to enhance its measuring sensitivity. Utilization of the scattering plate causes photons that undergo more scattering events to be detected and the scattering events appear with much larger angles. This leads to broadening of the Doppler shift power density spectrum (DSPDS) and relative higher measured blood flow speed. Redirection capability of the scattering plate and its effect on system performance are theoretically analyzed and experimentally evaluated. 2.System DescriptionOptical layout of the developed LDF is illustrated in Fig. 1a, which consists of a laser Doppler measurement unit (LDF unit), an illumination unit, and an observation unit. 2.1.LDF UnitThe LDF unit is subdivided into laser delivering, signal detection, and sharing paths. The source of the LDF unit in the laser delivering path is a polarized laser diode (LDF-LD, Thorlabs L780P010) at center wavelength of 780 nm. The s-polarized laser beam from the source has a divergence angle of about 30 deg and, hence, two aspheric lenses (LDF-L1 and LDF-L2) are implemented to shrink its divergence enabling enough power to the targeted vessels. After reflection by a polarization beam splitter (LDF-beam splitter), the light goes to two lenses (LDF-L3 and LDF-L4), and is then redirected to the sharing path by a dichroic beam splitter (SP-beam splitter). An accommodation lens (SP-L1) followed by two lenses (SP-L2 and SP-L3) in the sharing path is adopted for patients with myopia or hypermetropia. The delivered laser spot at the position of the cornea is about 2 mm in diameter with an output power of less than 150 μW, which is safe for continuous examination of 20 min according to ANSI Z136.1. Backscattered light from the target retraces the light path of the delivering light until the signal detection path is separated by the LDF-beam splitter, where the transmitted light with p-polarization owing to birefringence of the cornea and other components is collected by a fiber pigtailed avalanche photon detector (APD). The detected signal is then amplified for further processing. 2.2.Illumination UnitThe illumination unit is constructed by replacing the halogen bulb in a KOWA camera with a green-light LED (IU-LED) at 530 nm. The maximum output power is 10 mW and can be modified by adjusting the current feeding to the IU-LED. 2.3.Observation UnitBesides optical components in the sharing path mentioned above, the observation unit is constructed by two additional lenses (OU-Ocular and OU-L1) and a targeting plate in between. The targeting plate is located in conjugate to the LDF laser spot on the eye fundus. Under the illumination of IU-LED and with the help of the targeting plate, the observation unit is used to help the operator to adjust the portable LDF for correct positioning of the LDF laser spot on targeted vessels. The picture of the developed LDF under operation is shown in Fig. 1b. The developed LDF is weighted about 2 kg with compact size, suitable to be carried and operated by hand. Such portable LDF is therefore applicable to special patients such as new born babies, disabled persons, and patients under intensive care or even under operation. 3.Theoretical Analysis3.1.Ray Trace ModelIn order to explain the mechanism of detection and sensitivity enhancement of the LDF based on the scattering plate, a ray trace model is built to describe the process that the laser transmits from the LDF to the eye fundus and that is scattered by moving red blood cells (RBCs) back to the LDF. As shown in Fig. 2, the model consists of a single blood vessel containing moving RBCs, a convex eye lens with focal length f c and clear aperture radius r c, and a scattering plate between the LDF unit and the eye lens with a distance L away from the latter. Due to the scattering characteristics of the scatting plate, the LDF laser illuminates an area over the choroidal bed where static structures and RBCs moving in random directions and velocities are available. Without loss of generality, only one blood vessel perpendicular to the optics axis of the LDF (dotted-dashed line) with RBCs moving at typical azimuth angle (bold arrow) is assumed. Such an assumption of a blood vessel is just for explanation of the mechanism of sensitivity enhancement and is not a realistic mimic of the vascular vessels in the choroidal vascular bed. A Cartesian coordinate system with origin at the focus of the eye lens is set, where y-axis coincides with the given blood vessel and z-axis along the optics axis of the LDF unit. As shown in Fig. 2, I i represents an incident ray from the LDF unit illuminating the scattering plate at point (x i, y i, L + f c), and [TeX:] $I_i^\prime $ is one of the scattering components with a separation angle β corresponding to I i after transmitting through the scattering plate. When ray [TeX:] $I_i^\prime $ passes through the eye lens, it is denoted by ray [TeX:] $I_i^{\prime\prime}$ and hits the given blood vessel at point (0, y 0, 0). Backscattering happens at point (0, y 0, 0) and the backscattering intensity is expressed by [TeX:] $I_s = \eta I_i^{\prime\prime}$ . Here, uniform back scattering coefficient of ηis assumed because of relatively small numerical aperture of human eye and hence limited scattering angle resulting in insignificant angular intensity changes according to Mie theory. Ray [TeX:] $I_s^\prime $ comes from ray I s after refracted by the eye lens is parallel to ray [TeX:] $I_i^\prime $ and hits the scattering plate at point (x s, y s, L + f c). Ray [TeX:] $I_s^{\prime\prime}$ represents one of the scattering components with a deviation angle of θ1 relative to the direction of the ray donated by [TeX:] $I_s^\prime $ , and a deviation angle of θ2 relative to the direction of the z-axis. Doppler frequency shift achieved in ray [TeX:] $I_s^{\prime\prime}$ corresponding to ray I i based on previous ray tracing is then given by14 — 16 Eq. 1[TeX:] \documentclass[12pt]{minimal}\begin{document}\begin{equation} f_d = \frac{V}{{\lambda \cdot f_c }} \cdot (y_i + y_s + 2f_c \tan \beta - 2L\tan \beta), \end{equation}\end{document}Supposing the incident laser beam from LDF has a Gaussian distribution with maximum intensity of I 0 and radius of beam waist equals to r c, the intensity of ray I i is then determined by [TeX:] $I_i = I_0 \exp [ - \frac{{2x_i ^2 + 2y_i ^2 }}{{r_c ^2 }}]$ . When light transmits through the scattering plate, the probability distribution (PS HG) of the scattering light versus the scattering angle β can be modeled using the Henyey–Greenstein function17, 18 Eq. 2[TeX:] \documentclass[12pt]{minimal}\begin{document}\begin{equation} {\it PS}_{\it HG} (\beta,g) = \frac{{1 - g^2 }}{{(1 + g^2 - 2g\cos \beta)^{3/2} }}, \end{equation}\end{document}Eq. 3a[TeX:] \documentclass[12pt]{minimal}\begin{document} \begin{equation} \hspace*{-12pt}I_i^{\prime} = \displaystyle\frac{{I_i \cdot {\it PS}_{\it HG} (\beta,g)}}{{\displaystyle\int_{\beta \le \beta _{\max } } {\it PS_{\it HG} (\beta,g)d\beta } }}, \end{equation}\end{document}Eq. 3b[TeX:] \documentclass[12pt]{minimal}\begin{document} \begin{equation} I_s^{\prime\prime} = \displaystyle\frac{{I_s^{\prime\prime} \cdot {\it PS}_{\it HG} (\theta _1,g)}}{{\displaystyle\int_{\theta _1 \le \theta _1 {\max } } {{\it PS}_{\it HG} (\theta _1,g)\,d\theta _1 } }}, \end{equation}\end{document}Eq. 4[TeX:] \documentclass[12pt]{minimal}\begin{document}\begin{eqnarray} P(f_d) &=& \int_{\beta \le \beta _{\max } } {\int_{\theta_2 \le \theta _2 {\max } } \Bigg[ \mathop{{\int\!\!\!\!\!\int}\mkern-21mu \bigcirc}_{x_s^2 + (y_s - L\tan \beta)^2 \le r_c ^2}{\Bigg({\mathop{{\int\!\!\!\!\!\int}\mkern-21mu \bigcirc}_{x_i ^2 + (y_i - L\tan \beta)^2 \le r_c ^2 } {\left. {\eta I_i '} \right|_{_{y_i = f_d \lambda f_c /v + 2L\tan \beta - 2f_c \tan \beta - y_s } } dx_i dy_i } } \Bigg)} dx_s dy_s } \Bigg]\nonumber\\ &&\times\, \frac{{{\it PS}_{\it HG} (\theta _1,g)}}{{\displaystyle\int_{\theta _1 \le \theta _1 {\max } } {{\it PS}_{\it HG} (\theta _1,g)d\theta _1 } }}d\theta _{2} d\beta, \end{eqnarray}\vspace*{-12pt}\end{document}Eq. 5a[TeX:] \documentclass[12pt]{minimal}\begin{document}\begin{equation} \textit{ChBVolume} = \int {P(f_d)\, df_d }, \end{equation}\end{document}3.2.Simulation Based on the ModelIn order to show how the scattering plate influences the measurement results, numerical simulation of P(f d) and ChBSpeed is conducted to evaluate both the change of the DSPDS [P(f d)] curve and the change of ChBSpeed value after the adoption of the scattering plate. The simulation under “normal condition” that the scattering plate is not utilized is achieved as the limit of Eq. 4 when g→1, supposing the redirection capability of the scattering plate can be ignored. The simulation under “scattering condition” after the adoption of the scattering plate uses g = 0.71, which equals the asymmetry factor of the scattering plate in our later experiments. In the simulation under both conditions, f c is chosen to be 17 mm, which equals the effective focal length of the human eye, and L, r c, βmax , and θ2max are set to be 5 mm, 2.5 mm, 25 deg, and 20 deg, respectively. The curves in Fig. 3a show simulated P(f d) curve under scattering and normal conditions. The RBC's velocity is set to be 10 mm/s in this simulation. Comparing the curve under scattering condition to that under the normal condition, broadening of P(f d) and improved power density of higher Doppler frequency shift can be observed. As the P(f d) curve is broadened and the power density of higher Doppler frequency shift is increased under the scattering condition, the calculated value of ChBSpeed, which corresponds to the first moment of P(f d) divided by its 0th moment, is calculated to be higher due to utilization of the scattering plate. Fig. 3b shows how the value of ChBSpeed changes versus the alternation of the RBC's velocity. The value of ChBSpeed is linear to the RBC's velocity both under normal and scattering conditions. It can be seen that under the scattering condition, the slope of ChBSpeed versus RBC's velocity is increased, and hence the sensitivity of the speed measurement is enhanced. 3.3.Monte Carlo SimulationIn order to show how the scattering plate influences the measured results, we also conduct a Monte Carlo simulation in which, comparing to the ray trace model, the single blood vessel is replaced by a simulated choroidal vascular bed. The main part of the simulation code is adopted from “Monte Carlo modeling of light transport in Multilayered tissues,”21 which simulates the photon transports in layers of types of “tissue” and “glass” taking no account of Doppler effect. We modify the code in such a way that it allows us to consider Doppler frequency shift of a scattered photon and direction change of a photon due to a lens. The frequency shift is calculated by the incident and scattered wavenumber vectors of the photon and the velocity vector of the moving particle.15 The lens is modeled as a lens-layer that refracts the direction of passed photons in terms of Gaussian optics. In our simulation, the scattering plate is modeled as a layer with the thickness t = 2 mm, the anisotropy factor g = 0.71, the scattering coefficient μs = 500 m−1, and the absorption coefficient μa→0. The eye lens is modeled as a lens-layer with the focal length f = 17 mm. The vitreous body is modeled as a glass-layer with refractive index n = 1.336 since its μs and μa are very small. The choroidal vascular bed is modeled as a tissue-layer with t = 0.2 mm, g = 0.87, μs = 1.35×10⁵ m−1, and μa = 6.13×10⁴ m−1.22 The velocity vector of moving RBCs in this layer is determined by three random numbers: the magnitude with normal distribution (mean: 10 mm/s, standard deviation: 3 mm/s), the azimuth angle with uniform distribution (0 ~ 2π), and the elevation angle with normal distribution (mean: 0, standard deviation: π/2). We choose a concentration of 10% as the times-ratio of Doppler scattering over non-Doppler scattering, considering that in the choroidal vascular bed most part of the tissue is static. Under each condition, 2×10⁶ photons are launched. The schematic of the layers is shown in Fig. 4a with the path of a typical photon marked by the dashed line. The simulation results are plotted in log scale in Fig. 4b and normalized by the maximums, where the solid line is the DSPDS under the normal condition and the dotted line is the DSPDS under the scattering condition, improved power density of higher Doppler frequency shift can also be observed. In order to study how the measured signal is influenced by the multiple scattering within the choroid vascular bed, the scattering times both for Doppler and non-Doppler scattering are recorded. The average scattering times are evaluated to be 1.0 and 1.5 for photons contributed to Doppler and non-Doppler scattering, respectively, shown in Fig. 4c. It means that most of the photons that are collected by the LDF undergo single scattering instead of multiple scattering with the red blood cells. Hence, the single scattering assumption in the ray trace model depicted in Fig. 2 is valid and multiple backscattering in the choroid vascular bed has a negligible effect on the DSPDS. The same conclusion is obtained in Ref. 23 where there is no scattering plate. 4.Experiments and ResultsCharacteristics of the scattering plate implemented in our experiments is calibrated by a home-made goniometer.24 The measured forward scattering profile is shown in Fig. 5a, where corresponding fitted profile based on the Mie theory is also given. From the fitted forward scattering profile, g is estimated to be 0.71. Figures 5b, 5c show two pictures taken by the camera located at the position where subjects are situated when the LDF is in operation, demonstrating the light distribution over the targeted area corresponding to normal and scattering conditions. The redirection capability of the scattering plate is confirmed by the enlarged light distribution. However, the drawback on spatial resolution of applying the scattering plate is also demonstrated in Figs. 5b, 5c. Fig. 5(a) Forward angular scattering profile of the scattering plate calibrated by a home-made goniometer and fitted by the Mie theory and light spots on targeted area recorded (b) without and (c) with the scattering plate, respectively.  In order to confirm the expectation of the broadening of the DSPDS [P(f d)] and corresponding overestimated ChBSpeed, examinations on ten volunteers subjects were conducted under normal and scattering conditions for comparison. For each subject, three independent examinations were performed with a time interval of half an hour and measurement duration for each examination being 30 s. Figure 6a presents the measured ChBSpeed for each subject with error bar labeled representing the standard deviation of three independent measurements. Improved values of ChBSpeed are realized for the scattering case in comparison to the normal case due to the increased percentage of received photons at higher Doppler frequency shift. This observation is accordant with our theoretical expectation, confirming that the scattering plate introduces more velocity components to the light direction and the photons undergo more scattering events that can be detected. Fig. 6Measured values of (a) ChBSpeed on ten subjects and (b) typical DSPDS [P(f d)] curves on one subject under scattering and normal conditions, respectively.  Typical DSPDS [P(f d)] curves measured on one subject under scattering and normal conditions are shown in Fig. 6b. Comparing with the curve under the normal condition, the broadening of P(f d) can be observed after the adoption of the scattering plate. The broadening of P(f d) is not exactly the same as simulated by the ray trace model, because the simulation based on the ray trace model uses only one specific vessel to explain the broadening of P(f d). But the actual P(f d) is contributed by vessels with different directions and velocities in the choroidal vascular bed,4 such random directions and velocities lead to different scales of broadening corresponding to different vessels. Even though, the enhancement of the number of detected photons that undergo Doppler scattering can still be considered as accordant with the Monte Carlo simulation result. This characteristic of scattering plate is exploited in the developed LDF for sensitivity enhancement on measuring blood flow speed, although quantitative evaluation on sensitivity enhancement is not feasible due to complex of blood vessels for in vivo experiments. 5.ConclusionA portable LDF for in vivo measurement of blood flow in human choroidal vascular bed is developed. Enhancement of the number of detected photons that undergo Doppler scattering and envisioned improved sensitivity of in vivo measurement of choroidal blood flow speed are realized by the use of a scattering plate positioned in front of the eye. The broadening of the DSPDS and enhanced measurement sensitivity of RBCs’ speed are explained through theoretical analysis based on the tracing of ray propagation. Enhancement of the number of detected photons that undergo Doppler scattering can be confirmed by Monte Carlo simulation in which the single blood vessel of the ray trace model is replaced by the simulated choroidal vascular bed. Improved performance with the scattering plate is experimentally confirmed based on measurements of ten volunteers. Typical measured DSPDS shows the broadening of the DSPDS as well as improved density of higher Doppler frequency shift. Increased blood flow velocities from in vivo measurements are realized through usage of the scattering plate as expected in theoretical analysis. However, enhanced measurement sensitivity of RBCs’ speed is not experimentally apparent due to complex in real situations and can only be envisioned. Nevertheless, light detection with the scattering plate is potentially useful in cases where the detection of very slight alternation in blood flow is pursued and the spatial resolution is not as critical as that in choroidal vascular bed, although it influences spatial resolution of the system and decreases the total signal measured. AcknowledgmentThis work was supported by National High Technology Research and Development Program of China (Grant No. 2006AA02Z4E0) and Natural Science Foundation of China (Grant Nos. 60978037, 60878057). ReferencesL. Schmetterer and
G. Garhofer,
“How can blood flow be measured?,”
Surv. Ophthalmol., 52
(6S), 134
–138
(2007). https://doi.org/10.1016/j.survophthal.2007.08.008 Google Scholar
J. Flammer, S. Orgül, V. P. Costa, N. Orzalesi, G. K. Krieglstein, L. M. Serra, J. P. Renard, and
E. Stefansson,
“The impact of ocular blood flow in glaucoma,”
Prog. Retinal Eye Res., 21
(4), 359
–393
(2002). https://doi.org/10.1016/S1350-9462(02)00008-3 Google Scholar
L. Schmetterer and
M. Wolzt,
“Ocular blood flow and associated functional deviations in diabetic retinopathy,”
Diabetologia, 42
(4), 387
–405
(1999). https://doi.org/10.1007/s001250051171 Google Scholar
C. E. Riva, S. D. Cranstoun, J. E. Grunwald, and
B. L. Petrig,
“Choroidal blood flow in the foveal region of the human ocular fundus,”
Invest. Ophthalmol. Visual Sci., 35
(13), 4273
–4281
(1994). Google Scholar
E. Friedman,
“A hemodynamic model of the pathogenesis of age-related macular degeneration,”
Am. J. Ophthalmol., 124
(5), 677
–682
(1997). Google Scholar
C. E. Riva, J. E. Grunwald, S. H. Sinclair, and
B. L. Petrig,
“Blood velocity and volumetric flow rate in human retinal vessels,”
Invest. Ophthalmol Visual Sci., 26
(8), 1124
–1132
(1985). Google Scholar
J. R. Piltz-Seymour,
“Laser Doppler flowmetry of the optic nerve head in glaucoma,”
Surv. Ophthalmol., 43
(1), 191
–198
(1999). https://doi.org/10.1016/S0039-6257(99)00053-3 Google Scholar
C. E. Riva, J. E. Grunwald, and
B. L. Petrig,
“Laser Doppler measurement of retinal blood velocity: validity of the single scattering model,”
Appl. Opt., 24
(1), 605
–607
(1985). https://doi.org/10.1364/AO.24.000605 Google Scholar
C. Wang, Z. Ding, J. Meng, and
B. Yin,
“Simulation and measurement of flow field in micro chip,”
J. Innov. Opt. Health Sci., 3
(1), 25
–30
(2010). https://doi.org/10.1142/S1793545810000782 Google Scholar
J. Meng and
Z. Ding,
“Optical Doppler tomography with short-time Fourier transform and Hilbert transform,”
Proc. SPIE, 6826 682602
(2007). https://doi.org/10.1117/12.757243 Google Scholar
Z. Ding, Y. Zhao, H. Ren, J. Nelson, and
Z. Chen,
“Real-time phase-resolved optical coherence tomography and optical Doppler tomography,”
Opt. Express, 10
(5), 236
–245
(2002). https://doi.org/10.1364/OL.27.000098 Google Scholar
M. Jie, D. Zhihua, Y. Yong, and
G. ZhouYi,
“Study on cerebral microcirculation by optical Doppler tomography,”
Sci.China, Ser. G, 51
(12), 1883
–1891
(2008). https://doi.org/10.1007/s11433-008-0186-3 Google Scholar
E. Logean, M. H. Geiser, B. L. Petrig, and
C. E. Riva,
“Portable ocular laser Doppler red blood cell velocimeter,”
Rev. Sci. Instrum., 68
(7), 2878
–2882
(1997). https://doi.org/10.1063/1.1148211 Google Scholar
M. D. Stern,
“In vivo evaluation of microcirculation by coherent light scattering,”
Nature, 254
(5495), 56
–58
(1975). https://doi.org/10.1038/254056a0 Google Scholar
C. E. Riva,
“Basic principles of laser Doppler flowmetry and application to the ocular circulation,”
Int. Ophthalmol., 23
(4–6), 183
–189
(2001). https://doi.org/10.1023/A:1014433913240 Google Scholar
M. H. Geiser, U. Diermann, and
C. E. Riva,
“Compact laser Doppler choroidal flowmeter,”
J. Biomed. Opt., 4
(4), 459
–464
(1999). https://doi.org/10.1117/1.429960 Google Scholar
D. Toublanc,
“Henyey-Greenstein and Mie phase functions in Monte Carlo radiative transfer computations,”
Appl. Opt., 35
(18), 3270
–3274
(1996). https://doi.org/10.1364/AO.35.003270 Google Scholar
T. Binzoni, T. S. Leung, A. H. Gandjbakhche, D. Rüfenacht and
D. T. Delpy,
“The use of the Henyey–Greenstein phase function in Monte Carlo simulations in biomedical optics,”
Phys. Med. Biol., 51
(17), N313
–N322
(2006). https://doi.org/10.1088/0031-9155/51/17/N04 Google Scholar
B. L. Petrig and
L. Follonier,
“Ray tracing model for the estimation of power spectral properties in laser Doppler velocimetry of retinal vessels and its potential application to retinal vessel oximetry,”
Opt. Express, 13
(26), 10642
–10651
(2005). https://doi.org/10.1364/OPEX.13.010642 Google Scholar
U. Jacobi, M. Kaiser, J. Koscielny, R. Schuetz, M. Meinke, W. Sterry, and
J. Lademann,
“Comparison of blood flow to the cutaneous temperature and redness after topical application of benzyl nicotinate,”
J. Biomed. Opt., 11
(1), 014025
(2006). https://doi.org/10.1117/1.2166370 Google Scholar
L. Wang, S. L. Jacques, and
L. Zheng,
“MCML–Monte Carlo modeling of light transport in multi-layered tissues,”
Comput. Methods Programs Biomed., 47
(2), 131
–146
(1995). https://doi.org/10.1016/0169-2607(95)01640-F Google Scholar
Y. Guo, G. Yao, B. Lei, and
J. Tan,
“Monte Carlo model for studying the effects of melanin concentrations on retina light absorption,”
J. Opt. Soc. Am. A, 25
(2), 304
–311
(2008). https://doi.org/10.1364/JOSAA.25.000304 Google Scholar
C. E. Riva, B. L. Petrig, R. D. Shonat, and
C. J. Pournaras,
“Scattering process in LDV from retinal vessels,”
Appl. Opt., 28
(6), 1078
–1083
(1989). https://doi.org/10.1364/AO.28.001078 Google Scholar
Y. Zhu, Z. Ding, and
M. Geiser,
“Tissue scattering parameter estimation through scattering phase function measurements by goniometer,”
Chin. Opt. Lett., 5
(9), 531
–533
(2007). Google Scholar
|