|
|
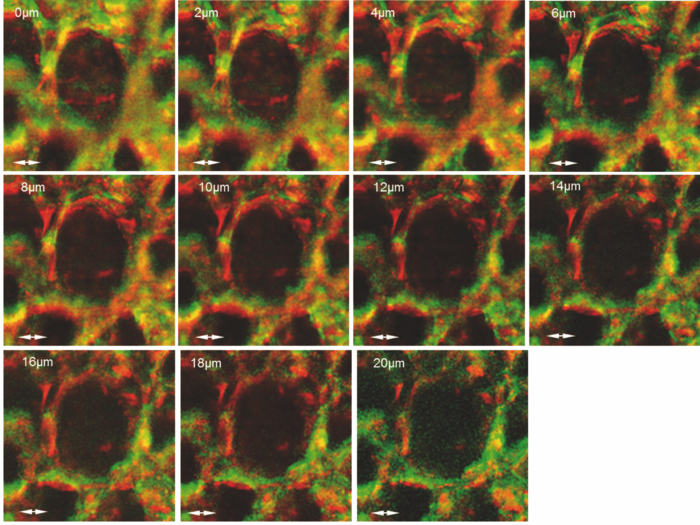
1.IntroductionChlorophylls, lignins, carotenes, and xanthophylls in plant tissues produce a significant level of autofluorescence emission when stimulated with the proper wavelengths, which could be useful for studying their distributions during plant growth.1, 2, 3 Two-photon excitation of autofluorescence redshifts the excitation light into a near-infrared (NIR) region which minimizes scattering and absorption in the tissue and allows imaging of living tissues up to a very high depth.4, 5, 6 The intensity of two-photon-excited autofluorescence (TPEA) depends nonlinearly on the peak intensity of excitation light. Therefore the two-photon excitation is highly localized at the focal point and completely avoids out-of-focus photobleaching and photodamage.4, 5, 6, 7, 8 Second-harmonic generation (SHG) is a process where two photons simultaneously interact with noncentrosymmetrical structures without absorption, producing the radiation at exactly half of the excitation wavelength. SHG imaging can provide the structural organization and molecular orientation information of plants without centrosymmetry. SHG does not involve the excitation of endogenous fluorescent molecules.9, 10, 11 Thus it does not suffer from phototoxicity effects or photobleaching, which limits the usefulness of fluorescence imaging. The excitation of SHG imaging also uses NIR wavelengths, which allows for a large penetration depth and analysis of thick specimens. Moreover, SHG signals have well defined polarization, so SHG polarization anisotropy can be used to determine the absolute orientation and the degree of organization of molecules in tissues. Simultaneously obtaining the TPEA and SHG imaging can be used to observe the distribution of the nature intrinsic fluorophores and also organization and structures of molecules in plants, which is helpful to understand the nature phenomenon in cell level of plants without complex slicing and labeling. However the excitation wavelength of plants for SHG imaging is normally different from the two-photon absorption wavelength of natural fluorophores in plants. Normal femtosecond NIR light with one central wavelength could not cover both wavelength regions and is limited in obtaining TPEA and SHG imaging effectively and simultaneously. In this paper, we use a highly birefringent nonlinear photonic crystal fiber with two zero-dispersion wavelengths (NL-PM-750, NKT) for generating a linearly polarized broadband pulsed supercontinuum beam. The supercontinuum light can efficiently excite TPEA and SHG signals for simultaneously acquiring two channels of nonlinear imaging. 2.Supercontinuum Light Source Generated from a Nonlinear Photonic Crystal FiberWe first measured the TPEA spectrum of the endogenous fluorescent molecules in a leaf from a ficus benjamina tree and the backwards SHG excitation spectrum at the same area using 100 fs pulses with a repetition rate of 80 MHz generated from a Ti:Sapphire laser [Fig. 1a]. Figure 1b displays the measured result. The fluorescent molecules in the leaf are mainly chlorophylls and have a two-photon absorption peak at wavelength 880 nm, while the excitation wavelength for obtaining the maximum backwards SHG intensity is at 830 nm. The difference between the two wavelengths is 50 nm. The noncentrosymmetric chloroplast membrane, with highly birefringent starch granules, is the main source of the SHG signal from the leaf. The microstructure of the chloroplast membrane in the ficus benjamina leaves determines the SHG excitation peak which is different from a two-photon absorption peak of chlorophyll molecules. The full width half maximum bandwidth of a 100-fs laser beam is 15 nm and cannot cover both wavelengths. Therefore a normal femtosecond laser beam with one central wavelength is limited in the case of the simultaneous excitation of autofluorescent and SHG signals. Figure 1c reveals TPEA and SHG signal spectra excited by 100 fs pulses at different central wavelengths. If optical pulses with wavelength of 880 nm are used to excite the two-photon autofluorescent signal from the leaf, the maximum autofluorescent signal can be obtained for autofluorescence imaging. However the SHG intensity from the leaf is only 18% of the SHG intensity excited by the pulses with central wavelength of 830 nm. Therefore femtosecond pulses with one central wavelength are not efficient for the simultaneous generation of TPEA and SHG imaging. Fig. 1(a) An area (circled) of a ficus benjamina leaf was excited by 100 fs pulses with one central wavelength for measuring two-photon excitation and backward SHG excitation spectra. (b) Measured two-photon excitation spectrum and backward SHG excitation spectrum. (c) TPEA and SHG signal spectra for different excitation wavelengths. 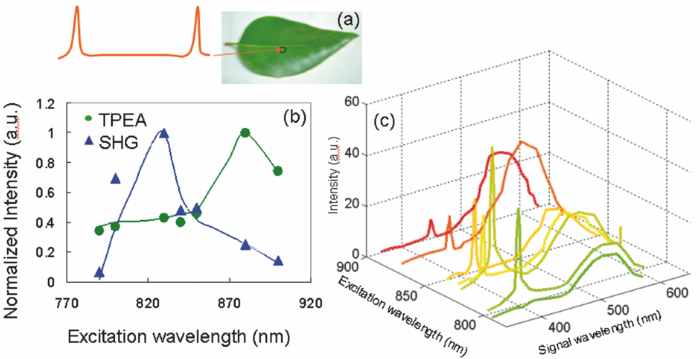 On the other hand, supercontinuum light generated from the highly birefringent nonlinear photonic crystal fibre (NL-PCF) has a broad bandwidth and can cover both two-photon absorption and SHG excitation peaks.12 Figure 2a schematically shows the structure of the NL-PCF and how supercontinuum light is generated by pumping 100 fs pulses into the core of the NL-PCF. By using a microstructure cladding region with air holes, a single-mode beam can be guided in a pure silica core of the NL-PCF. The high index difference between the silica core and the air-filled microstructure enables tight mode confinement, resulting in a small effective mode area of 2 μm2. The NL-PCF has two zero-dispersion wavelengths of 750 and 1260 nm, allowing the efficient supercontinuum generation with an 800 nm pump source.12 Fig. 2(a) Supercontinuum light generated from a NL-PCF. (b) Experimentally obtained spectra of supercontinuum light. (c) Degree of polarization as a function of the input power.  Figure 2b displays the experimentally measured output spectra from a 30-cm long NL-PCF pumped at wavelength 800 nm with a pulse width of 100 fs for different average powers. The stability of this supercontinuum output is very good and the variation of the spectral density of supercontinuum from 55 to 1100 nm in 1 h is measured less than 10%. The polarization of the pumped pulse is aligned with one of the principle axes in the fiber, the polarization maintaining direction of the NL-PCF. The wavelength of 800 nm is between the two zero-dispersion wavelengths which has anomalous dispersion. When the pulses enter NL-PCF, the high nonlinearity and the anomalous dispersion of the fiber transform the pulses to form a high-order soliton. The order of the initial high-order soliton is [TeX:] $N = \sqrt {rP_{\smash {0}} T_{\smash {0}} ^2 /| {\beta _2 }|}$ , where γ, β, P 0 and T 0 are the nonlinearity, the second-order propagation coefficient, the peak power and the pulse width.12 This high-order soliton then quickly breaks up in a fission process which converts it into several lower-order solitons and each soliton has different central wavelengths.12, 13 As the pump power increases, the order of the initial high-order soliton and the number of the split lower-order solitons rise [Fig. 2b]. When the input pump power is 75 mW, the output of the NL-PCF has two lower-order solitons with central wavelengths at 830 and 880 nm [Fig. 2b] which match with the maximum two-photon absorption and SHG excitation wavelengths of the leaf. The pulse width of the two lower-order solitons with center wavelengths at 830 and 880 nm is measured as 1.9 and 1.4 ps, respectively by using a frequency-resolved optical gating real time pulse measurement device (MesaPhotonics).14 Therefore the two lower-order solitons are well suited for simultaneously exciting TPEA and SHG signals for imaging. In addition, the degree of polarization of the supercontinuum output, defined as γ = (I max – I min)/(I max + I min), is 0.96, where I max and I min are the maximum and minimum intensity, respectively. The degree of polarization as a function of the input power is shown in Fig. 2c. Therefore the two lower-order solitons are close to linearly polarized. 3.Supercontinuum can Effectively Excite TPEA and SHG Signals for ImagingFigure 3a shows an optical microscopy reflection image of a ficus benjamina leaf. Figures 3b and 3c depict the TPEA and SHG images of the leaf surface. The imaging size is 100×100 μm2. The excitation beam with an average power of 20 mW was focused on the sample by a 1.2 NA objective lens. The autofluorescence signal reveals the distribution of the fluorescent molecules and the SHG image indicates the orderly asymmetric structured walls behaving as the nonlinear photonic crystals. The combined relative signals [Fig. 3d] show both the functional and structural information of plant cells. The overlap of the SHG image with the TPEA image is because both the SHG signal and the two-photon-excited autofluorescence signal comes from the chloroplast membrane and orderly structured cell walls of the leaf as shown in Fig. 3a. The contrast of TPEA and SHG imaging is useful for understanding the origin of optical signals from different components of the plant tissues. The noncentrosymmetric chloroplast membrane, with highly birefringent starch granules, is the main source of the SHG signal from the leaf. By contrast, the accumulated pigments and photosynthetically active components could contribute to the intrinsic fluorescence of plant cells.1, 2, 15, 16, 17 The broad bandwidth of supercontinuum provides the opportunity for the visualization of different types of chlorophylls, which is useful to study the physiological activities of the cell and investigate the health status of plants.3 Fig. 3(a) Optical microscopy reflection image of the leaf. The size of the image: 200 μm×250 μm. (b) TPEA image of the leaf. (c) SHG image of the same area. An arrow in (c) shows the polarization direction of supercontinuum light. (d) TPEA (red) and SHG (green) image. (e) TPEA and (f) SHG image of the leaf excited by optical pulses with central wavelength of 850 nm. (g) Combined TPEA (red) and SHG (green) image.  The TPEA and SHG images of the same leaf excited by optical pulses with a central wavelength of 850 nm at the same optical power are displayed in Figs. 3e, 3f, 3g. The wavelength of 850 nm is away from the optimal TPEA and SHG excitation wavelengths of the leaf. The contrast of the images shown in Figs. 3e, 3f, 3g is poorer than that excited by supercontinuum [Figs. 3b, 3c, 3d]. 4.SHG Polarization AnisotropyWe also analyzed and measured the SHG polarization anisotropy of the leaf excited by supercontinuum light (Fig. 4). Figures 4a, 4b, 4c show the SHG images of the leaf as the polarization of the supercontinuum is at different orientations. The SHG intensity shows an obvious change with the change of the polarization direction of the supercontinuum. As the polarization of the supercontinuum is fixed, the SHG intensity also changes with the polarization orientation of a polarization analyzer, θ, placed before the detection of the SHG intensity [Fig. 4d]. The results fit a cos2 θ function. The degree of polarization of the SHG signal from the leaf excited by the supercontinuum light beam γ was measured of 0.82 since SHG is a coherent and phase-preserving nonlinear process. This SHG polarization anisotropy can be used to determine the absolute orientation and the degree of organization of molecules in plant tissues. On the other hand, the two-photon-excited autofluorescence by supercontinuum is not linearly polarized because the fluorescent molecules randomly distribute during the excitation of fluorescence. But the degree of polarization of autofluorescence can be used for analyzing the movement of the intrinsic fluorescent molecules. Fig. 4SHG polarization anisotropy measurement of the leaf. (a)–(c) SHG images acquired with different incident polarization directions of supercontinuum with respect to the imaging plane (arrows). (d) Dependence of the SHG intensity as a function of the polarization orientation of a polarization analyzer θ placed before the detection of the SHG intensity. 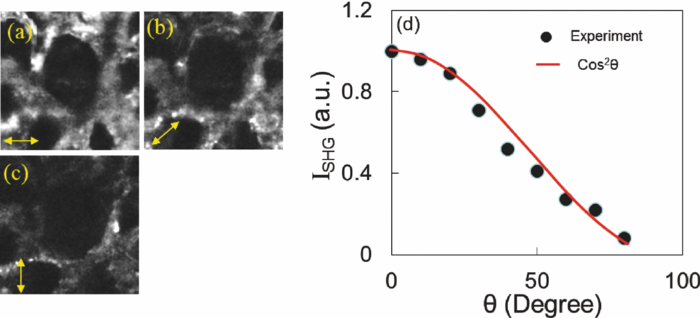 5.Three-Dimensional TPEA and SHG ImagesThree-dimensional (3D) TPEA (red) and SHG (green) images further reveal the structural details and fluorescent molecule distribution inside the plant tissue, as shown in Fig. 5. The redshifted spectral components of the supercontinuum pulses could be beneficial for thick tissue imaging because it suffers less scattering and absorption inside the plant specimen. 6.ConclusionIn conclusion, linearly-polarized pulsed supercontinuum can be effectively used for generation of two channels of 3D nonlinear imaging from plants, TPEA, and SHG imaging. TPEA imaging can be used for monitoring the distribution of fluorescent molecules in plants and SHG imaging for revealing the orientation and organization of molecules in plants. The 3D in vivo TPEA combined with 3D SHG imaging offers scientists useful information for studying bio-phenomena of plants. AcknowledgmentsThe authors acknowledge the support from the Australian Research Council and would like to thank Dr. Xiangping Li for his assistance in the emission spectrum measurements of the samples. ReferencesP. C. Cheng, B. L. Lin, F. J. Kao, M. Gu, M. G. Xu, X. S. Gan, M. K. Huang, and
Y. S. Wang,
“Multi-photon fluorescence microscopy- the response of the plant cells to high intensity illumination,”
Micron, 32 661
–669
(2001). https://doi.org/10.1016/S0968-4328(00)00068-8 Google Scholar
A. H. Reshak,
“Second harmonic generation from thick leaves using the two-photon laser scanning microscope,”
Micron, 40 455
–462
(2009). https://doi.org/10.1016/j.micron.2008.12.008 Google Scholar
P. B. Lukins, S. Rehman, G. B. Stevens, and
D. George,
“Time-resolved spectroscopic fluorescence imaging, transient absorption and vibrational spectroscopy of intact and photo-inhibited photosynthetic tissue,”
J. Lumin., 20 143
–151
(2005). https://doi.org/10.1002/bio.819 Google Scholar
F. Helmchen and
W. Denk,
“Deep tissue two-photon microscopy,”
Nat. Methods, 2 932
–940
(2005). https://doi.org/10.1038/nmeth818 Google Scholar
W. R. Zipfel, R. M Williams, and
W. W. Webb,
“Nonlinear magic: multiphoton microscopy in the biosciences,”
Nat. Biotechnol., 21 1369
–1377
(2003). https://doi.org/10.1038/nbt899 Google Scholar
H. Bao, A. Boussioutas, R. Jeremy, S. Russell, and
M. Gu,
“Imaging of goblet cells as a marker for intestinal metaplasia of the stomach by one-photon and two-photon fluorescence endomicroscopy,”
J. Biomed. Opt., 14
(6), 064031
(2009). https://doi.org/10.1117/1.3269681 Google Scholar
H. Bao and
M. Gu,
“A 0.4-mm-diameter probe for nonlinear optical imaging,”
Opt. Express, 17
(12), 10098
–10104
(2009). https://doi.org/10.1364/OE.17.010098 Google Scholar
H. Bao, J. Allen, R. Pattie, R. Vance, and
M. Gu,
“A fast handhold two-photon fluorescence micro-endoscope with a 475μm×475μm field of view for in vivo imaging,”
Opt. Lett., 33
(12), 1333
–1335
(2008). https://doi.org/10.1364/OL.33.001333 Google Scholar
A. Zoumi, A. Yeh, and
B. J. Tromberg,
“Imaging cells and extracellular matrix in vivo by using second-harmonic generation and two-photon excited fluorescence,”
Proc. Natl. Acad. Sci. U.S.A., 99 11014
–11019
(2002). https://doi.org/10.1073/pnas.172368799 Google Scholar
H. Bao, A. Boussioutas, R. Jeremy, S. Russell, and
M. Gu,
“Second harmonic generation imaging via nonlinear endomicroscopy,”
Opt. Express, 18
(2), 1255
–1260
(2010). https://doi.org/10.1364/OE.18.001255 Google Scholar
R. M. Williams, W. R. Zipfel, and
W. W. Webb,
“Interpreting second-harmonic generation images of collagen I fibrils,”
Biophys. J., 88 1377
–1386
(2005). https://doi.org/10.1529/biophysj.104.047308 Google Scholar
B. J. Chick, J. W. M. Chon, and
M. Gu,
“Polarization effects in a highly birefringent nonlinear photonic crystal fiber with two-zero dispersion wavelengths,”
Opt. Express, 16 20099
–20105
(2008). https://doi.org/10.1364/OE.16.020099 Google Scholar
M. Lehtonen, G. Genty, and
H. Ludvigsen,
“Supercontinuum generation in a highly birefringent microstructured fiber,”
Appl. Phys. Lett., 82 2197
–2199
(2003). https://doi.org/10.1063/1.1565679 Google Scholar
X. Gu, L. Xu, M. Kimmel, E. Zeek, P. O´Shea, A. P. Shreenath, and
R. Trebino,
“Frequency-resolved optical gating and single-shot spectral measurements reveal fine structure in microstructure-fiber continuum,”
Opt. Lett., 27 1174
(2002). https://doi.org/10.1364/OL.27.001174 Google Scholar
T. Bet, J. Teipel, D. Koch, W. Härtig, J. Guck, and
H. Giessen,
“Excitation beyond the monochromatic laser limit: simultaneous 3-D confocal and multiphoton microscopy with a tapered fiber as white-light laser source,”
J. Biomed. Opt., 10 054009
(2005). https://doi.org/10.1117/1.2114788 Google Scholar
H. Kano and
H. Hamaguchi,
“In-vivo multi-nonlinear optical imaging of a living cell using supercontinuum light source generated from a photonic crystal fiber,”
Opt. Express, 14 2798
–2804
(2006). https://doi.org/10.1364/OE.14.002798 Google Scholar
S. W. Chu, I. H Chen, T. M. Liu, C. K. Sun, S. P. Lee, B. L. Lin, P. C. Cheng, M. X. Kuo, D. J. Lin, and
H. L. Liu,
“Nonlinear bio-photonic crystal effects revealed with multimodal nonlinear microscopy,”
J. Microsc., 208 190
–200
(2002). https://doi.org/10.1046/j.1365-2818.2002.01081.x Google Scholar
|